10/03/2023 Daily Reports
- EUR/USD is under making ground on Thursday and has moved up from a low of 1.0536 to score a corrective high of 1.0591 so far in the New York session ahead of the key US Nonfarm Payrolls on Friday. European stocks were held back by higher-for-longer interest rate worries but Treasury yields have eased on Wall Street supporting risk appetite.
- US economic data has proven that there are signs of cracks in a tight US jobs market which is in contrast to how the markets were starting to position following Federal Reserve’s Chair Jerome Powell’s hawkish rhetoric to Congress earlier in the week.
- Data released on Thursday took some of the sting out of Fed Chairman Jerome Powell’s hawkish tone and has shown US jobless claims leaped by 11% last week. This was the biggest increase in five months. At the same time, planned layoffs for February quadrupled year-on-year. This data might be indicating that the Federal Reserve’s hiking cycle has been playing out as intended and negates the need to hike aggressively.
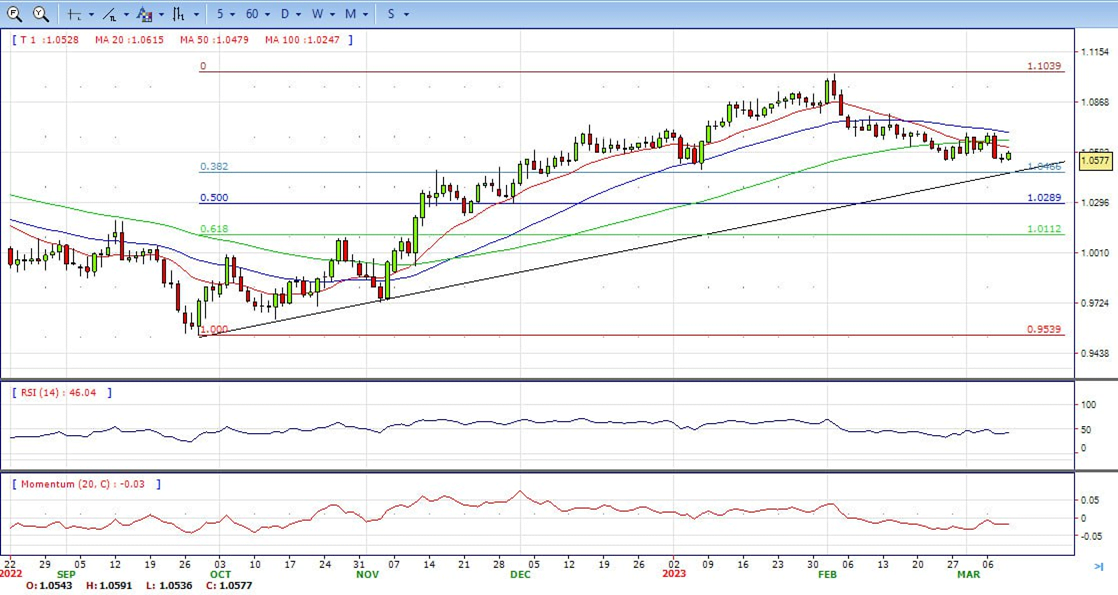
- The EUR/USD pair is trading near the 1.0577, up for the day with bearish stance in daily chart. The pair still stabilized below 20 and 50 SMA, indicates bearish strength. Meanwhile, the 20 SMA started turning flat but continued developing below 50 SMA, suggests bears not exhausted yet. On upside, the immediate resistance is 1.0700, break above this level will extend the advance to 1.0800.
- Technical readings in the daily chart support the bearish stance. The RSI indicator stabilizes around 43. The Momentum indicator holds below the midline, indicating downward potentials. On downside, the immediate support is 1.0530 and below this level will open the gate to 1.0470.
- GBP/USD bounces off the YTD lows of 1.1802 and rises above 1.1900, following Powell’s two-day appearance at the US Congress. Although Powell’s stance turned hawkish, US Thursday’s data might help the Fed to gradually increase rates, though further confirmation is needed on Friday’s Nonfarm Payrolls. At the time of writing, the GBP/USD is trading at 1.1914 after hitting a low of 1.1828.
- Data revealed by the BLS, Jobless Claims for the week ending on March 4 were 211K higher than expected at 195K. Despite a strong ADP report on Wednesday and more job openings than anticipated, rising unemployment claims could ease the tightness of the labor market. A downbeat US Nonfarm Payrolls report, coupled with high unemployment claims, could reduce the Fed needs to tighten conditions at a faster pace.
- On the UK front, an employment report will be released on March 14. Furthermore, the Chancellor of the Exchequer, Jeremy Hunt, will announce the spring budget. Aside from this, money market futures are pricing in a 91% chance that the BoE will increase rates by 25 bps on the BoE’s next meeting on March 23.
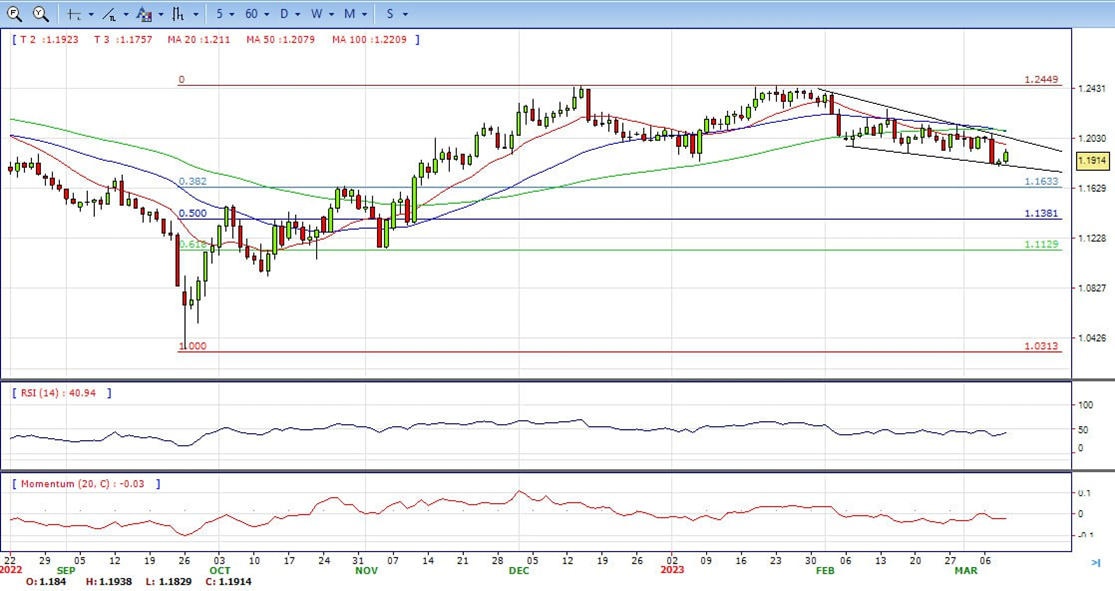
- The GBP/USD offers bearish stance in daily chart. Cable still stabilizes below 20 and 50 SMA, indicating bearish strength in short term. Meanwhile, the 20 SMA continued accelerating south and heading towards longer ones, suggests bears not exhausted yet. On upside, The immediate resistance is 1.1950 with a break above it exposing to 1.2065.
- Technical readings in the daily chart support the bearish stances. RSI indicator stabilizes around 43, while the Momentum indicator stabilizes below the midline, suggesting downward potentials. On downside, the immediate support is 1.1800, unable to defend this level will resume the decline to 1.1640.


- Gold price climbs sharply in the North American session after dropping more than 1.70% on Tuesday. Hawkish remarks by the US Fed Chair Jerome Powell at his appearance at the US Congress bolstered the USD. However, the US employment and inflation figures on Friday and the next week could influence the Fed’s path on interest rates. At the time of writing, the XAU/USD is trading at $1831 after hitting a low of $1812.09.
- Gold jumped sharply on the release of US economic data. The Bureau of Labor Statistics revealed that Initial Jobless Claims for the week ending on March 4 rose by 211K above estimates of 195K. Even though Wednesday’s ADP report was solid, job openings exceeded forecasts; increasing unemployment claims could alleviate the labor market’s tightness. A solid US Nonfarm Payrolls report on Friday would pressure the Federal Reserve to deliver price stability. Hence, further tightening would be needed.
- In the meantime, the greenback is on the back foot, with traders booking profit ahead of tomorrow’s US jobs report. The US Dollar Index, which tracks the buck’s value against a basket of peers, retraces 0.46% at 105.172, a tailwind for the yellow metal prices.
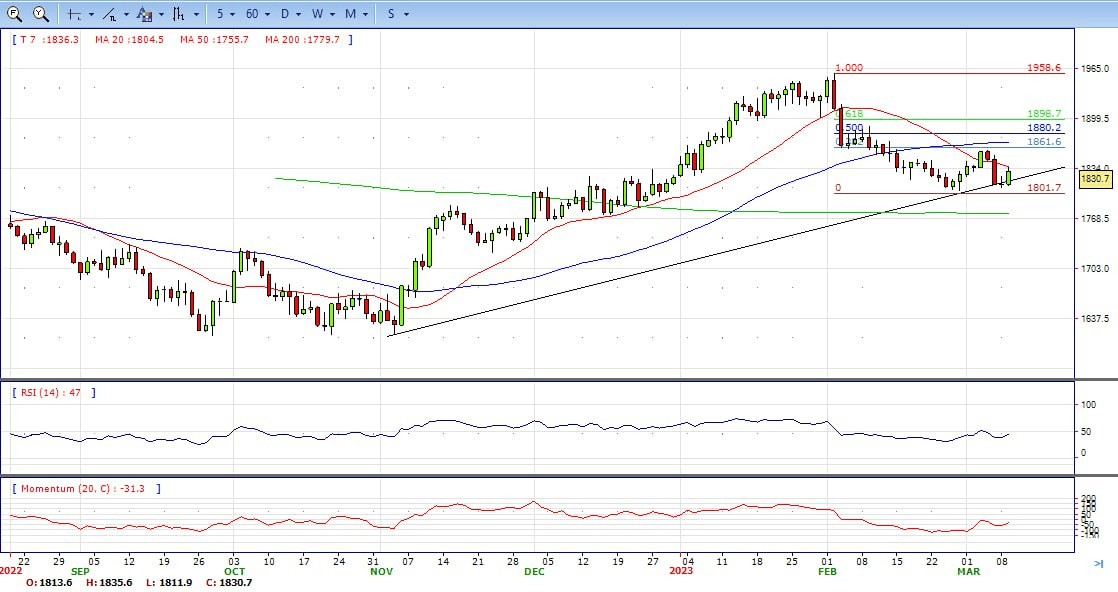
- Gold price stabilized around 1831, up for the day and bearish in the daily chart. The gold price stabilized below 20 and 50 SMA, suggesting bearish strength in short term. Meanwhile, the 20 SMA continued accelerating south and heading towards 200 SMA, indicating bears not exhausted yet. On upside, the immediate resistance is 1858, break above this level will open the gate for more advance to 1891 area.
- From a technical perspective, the RSI indicator holds below the mid-line and stabilizes around 45, on a bearish strength. The Momentum indicator hold just below the midline, suggests downward potentials. On downside, the immediate support is 1805, below this area may resume the decline to 1776.


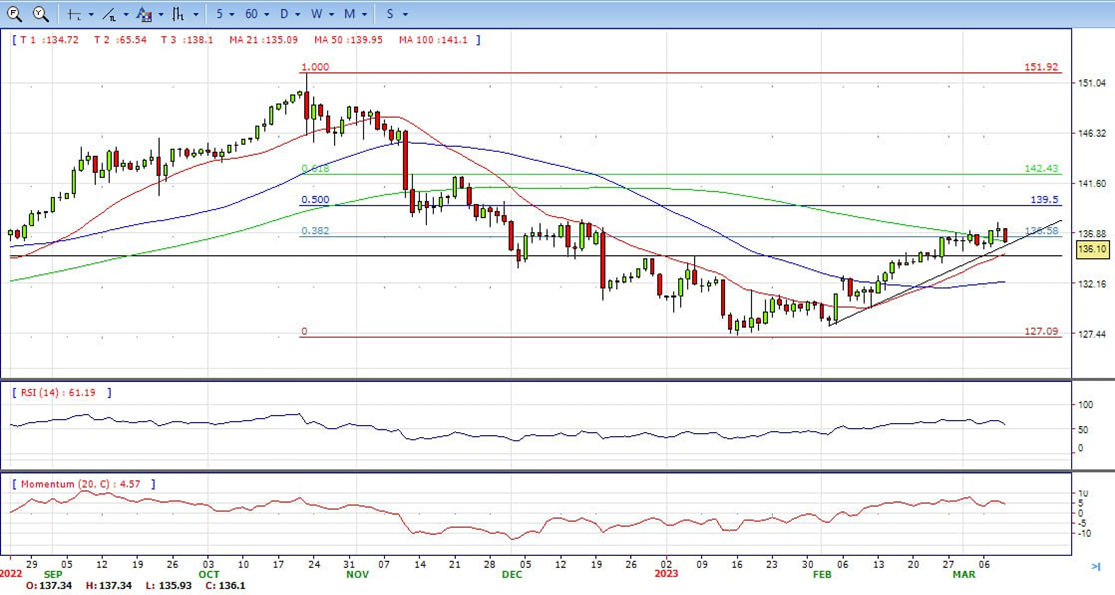
- The USD/JPY pair meets with a fresh supply on Thursday and extends the previous day’s modest pullback from the vicinity of the 138.00 mark, or its highest level since mid-December. The intraday selling picks up pace during the early North American session and momentarily drags spot prices just above the 136.00 mark in the last hour.
- The US Dollar bulls opt to take some profits off the table following the recent strong rally to over a three-month peak and turn out to be a key factor exerting pressure on the USD/JPY pair. Apart from this, the downfall could further be attributed to some repositioning trade ahead of the BoJ monetary policy decision, scheduled to be announced during the Asian session on Friday.
- The downside for the USD, however, is more likely to remain cushioned amid rising bets for a jumbo 50 bps lift-off at the March FOMC meeting. In contrast, the BoJ is expected to stick to its ultra-easy policy settings to support the fragile domestic economy. The divergent policy stance adopted by the two major central banks supports prospects for the emergence of some dip-buying around the USD/JPY pair.
- The USD/JPY pair stabilized around 136.10, down for the day and bullish in the daily chart. The price stabilizes above 20 and 50 SMA, suggests bullish strength in short term. Meanwhile, 20 SMA continued accelerating north and heading towards longer ones, indicating bulls not exhausted. On upside, overcome 138.20 may encourage bulls to challenge 140.00, break above that level will open the gate to 142.20.
- Technical indicators suggest the bullish strength. RSI stabilizes around 59, while the Momentum indicator stabilizes in the positive territory, suggests upward potentials. On downside, the immediate support is 135.30, break below this level will open the gate to 134.00 area.
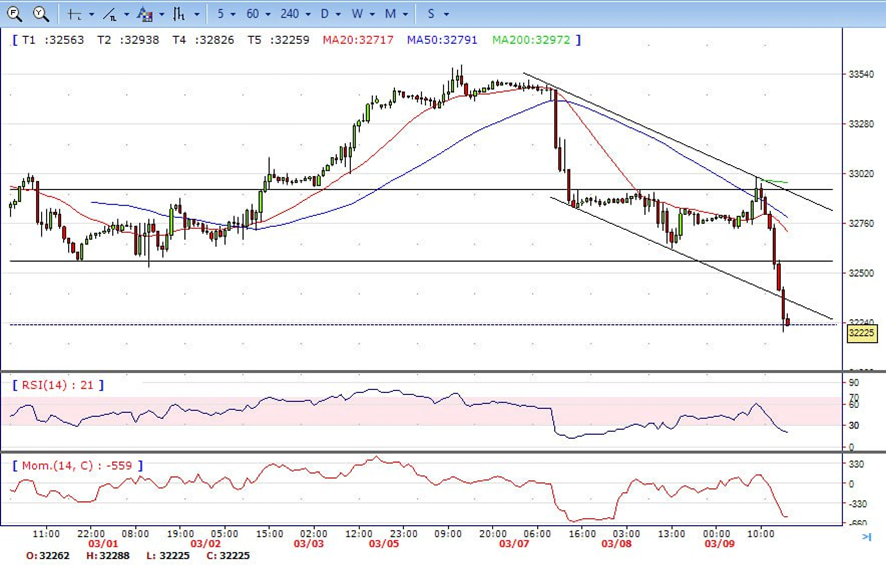
- DJI still under the sell pressure after the release of US economic data on Thursday, plunged from intraday high 33000 area to low 32190. It hold near the bottom and ended the day around 32240, down for the day and indicates bearish sign in the hourly chart. Right now market is standing below 20 and 50 SMA, suggests bearish strength. Meanwhile, 20 SMA continued accelerating south and developing far below longer ones, suggests bears not exhausted yet. On upside, overcome 32560 may encourage bulls to challenge 32760, break above that level will open the gate to 33000.
- Technical indicators suggest the bearish movement. RSI stabilizes around 22, while the Momentum indicator stabilizes in negative territory, suggests bearish potentials. On downside, the immediately support is 32190, break below this level will open the gate for more decline to 32000 area.
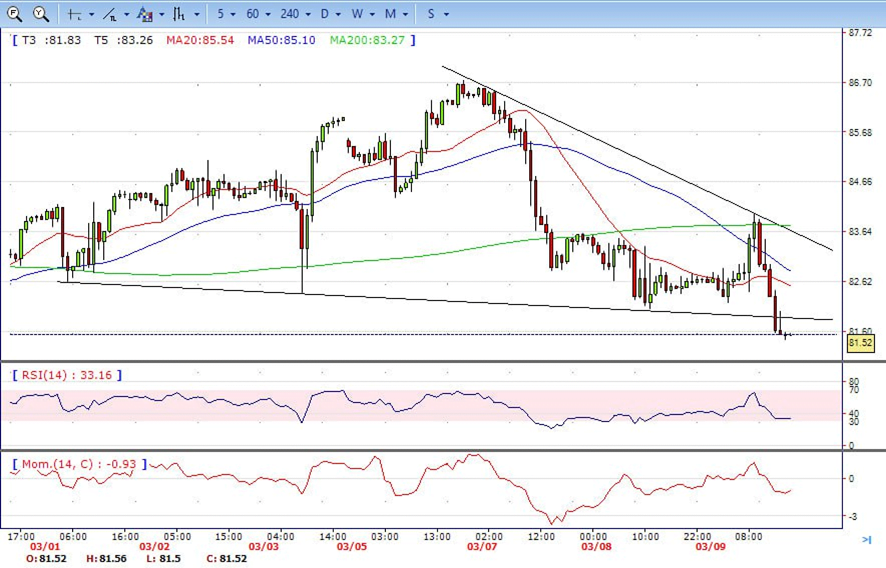
- Brent still under the sell pressure after the release of US economic data on Thursday, plunged from intraday high 84.00 area to low 81.40. It hold near the bottom and ended the day around 81.50. The price currently stabilizes below 20 and 50 SMA, suggests bearish strength in the hourly chart. Meanwhile, the 20 SMA continued accelerating south and developing far below longer ones, indicates bears not exhausted yet. On upside, overcome 82.50 may encourage bulls to challenge 84.00, break above that level will open the gate to 85.00.
- Technical indicators also suggest bearish movement, hovering below the midline. RSI drops to 33, while the Momentum indicator stabilizes in negative territory, suggests downward potentials. On downside, the immediately support is 81.40, break below this level will open the gate for more decline to 80.40 area.