09/01/2023 Daily Reports
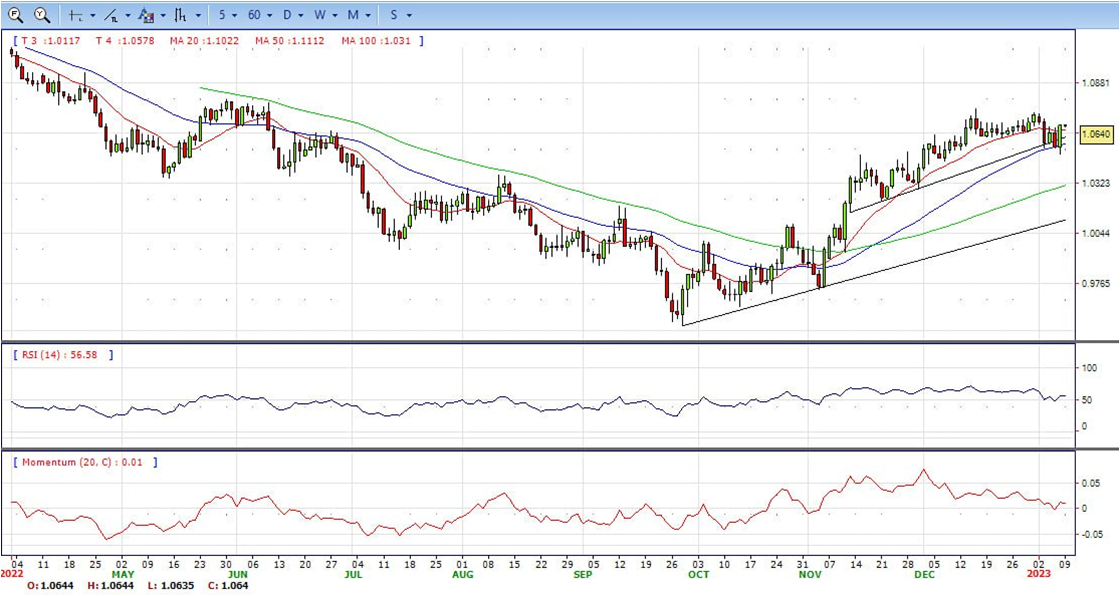
- The EUR/USD jumped above 1.0600 amid a sharp reversal of the US Dollar that tumbled across the board following the ISM Service PMI report. The pair rose 1.25% from the daily low and is having the best day in a month.
- The first leg lower of the US Dollar followed the release of the Nonfarm Payroll report. The economy added 223K in December which represents a slowdown from the prior month and shows the job market remains in good shape. The unemployment rate dropped to 3.5%.
- More recently, ISM Service PMI index came in at 49.6 in December, well below the 55 of market consensus. The Price Paid Index fell unexpectedly from 70 to 67.6. The report triggered concerns about a potential “hard landing” for the US economy. At the same time, the jobs numbers keep the debate open about the next Federal Reserve rate hike by 25 or 50 basis points.
- After the figures, the Greenback accelerated the decline across the board as US yields tumbled. The US 10-year yield fell from 3.75% to 3.61%, the lowest level since December 20. European yields are also sharply lower. The German 10-year bond yield fell to 2.19%, the lowest since December 19, while the Italian 1-year fell to 4.19%.
- Technical readings in the daily chart support the neutral to bullish stances. The RSI indicator is above 50. The Momentum indicator is also above the mid-line, indicating bullish potentials. On downside, the immediate support is 1.0600 and below this level will open the gate to 1.0540.
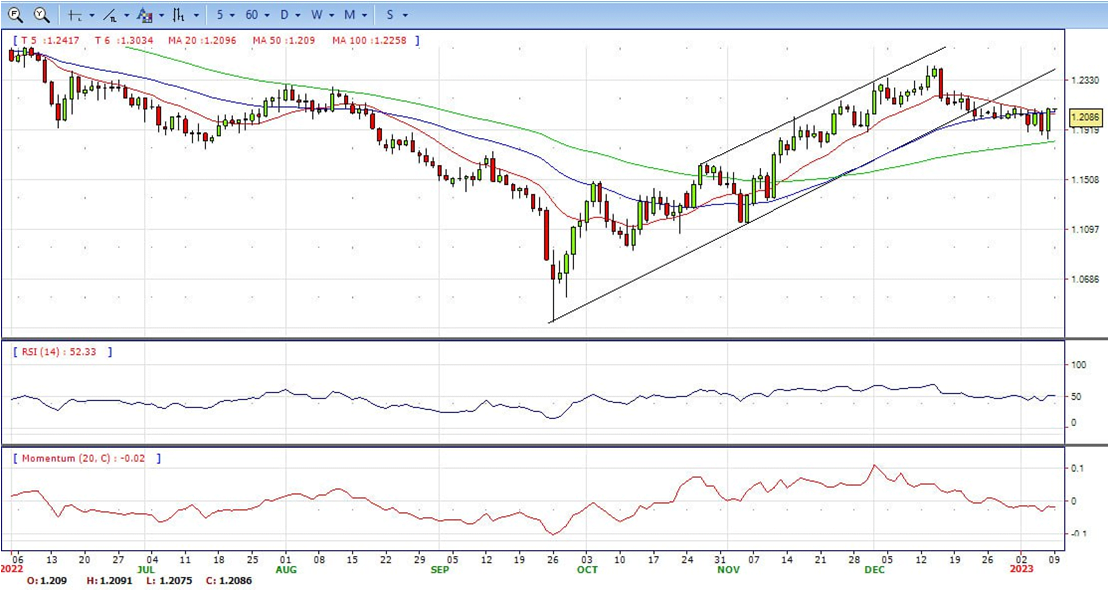
- The Pound Sterling (GBP) extended its gains against the US Dollar (USD), surging more than 160 pips on Friday, following a disappointing ISM Services report and an earlier jobs report. The GBP/USD Is peaking at 1.2099.
- US ISM Services Index plunges and weakened the USD. The GBP/USD printed another leg-up of more than 100 pips following the US Nonfarm Payrolls data release. Later, the Institute for Supply Management (ISM) revealed the Services PMI Index, which shrank to 49.6 against forecasts of 55 and trailed the November 56.5 jump. It should be said that it’s the lowest reading since May 2020, and traders should be wary that PMI readings below 50 indicate contraction.
- Earlier, the US Department of Labor revealed that the US economy added more jobs than expected and that the Unemployment Rate edged lower. The report’s spotlight was Average Hourly Earning, which showed that wage inflation is easing, dropping to 4.6% YoY, below the 5.0% estimates.
- Meanwhile, further Fed speaking failed to underpin the US Dollar, as Federal Reserve Governor Lisa D. Cooks said that inflation is “far too high” and of “great concern” despite recent reports. In the meantime, Richmond’s Fed President Thomas Barkin said the Fed is still resolute on inflation and that it needs to stay on the case until inflation is “sustainably’ back to the 2% goal. He added that adopting a more gradual approach on interest rate paths should limit harm to the US economy.
- Technical indicators developing below the mid-lines. RSI indicator is around 50, while the Momentum indicator continued in negative territory, still suggesting a bit bearish strength. On downside, the immediate support is 1.2040, unable to defend this level will resume the decline to 1.1940.


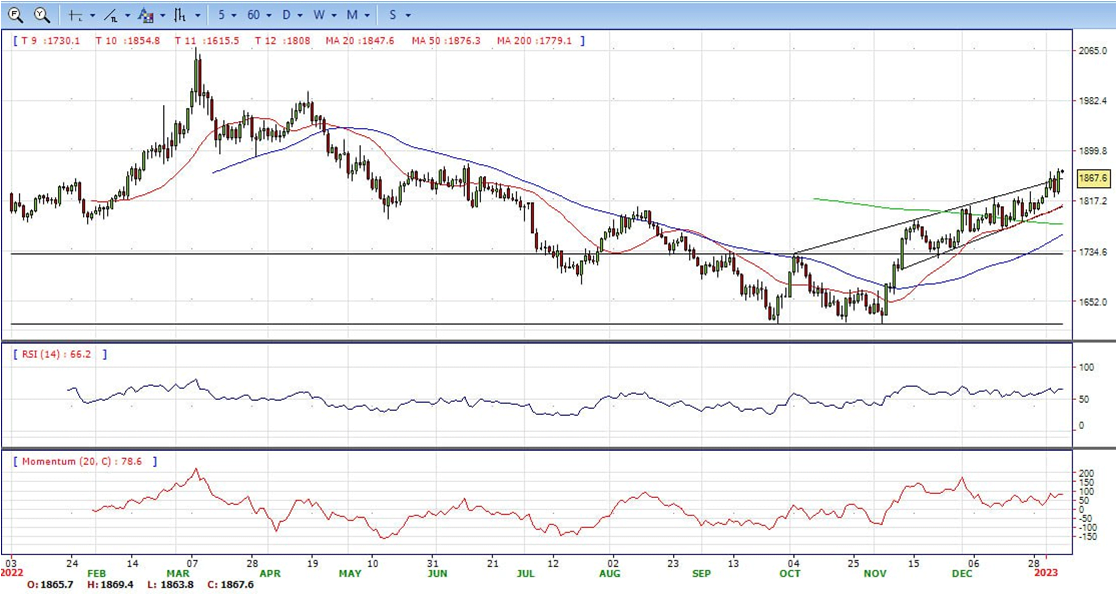
- Gold price (XAU/USD) rallied to the highest levels since June, close to $1,866 by the press time, after printing the biggest daily jump in five weeks the previous day.
- On Friday, United States Non-farm Payrolls (NFP) rose by 223,000 in December compared to the market expectations of 200,000 and November’s increase of 256,000 (revised from 263,000). Further details of the US December jobs report revealed that the Unemployment Rate declined to 3.5% from 3.6% in November and 3.7% expected. More importantly, the Average hourly earnings rose 0.3% in December versus 0.4% prior while the YoY figures eased to 4.6% from 4.8% in November
- Further, US ISM Services PMI slumped to the lowest levels in 31 months while suggesting a contraction in activities with 49.6 figures for December, versus the market expectations of 55 and 56.5 marked in November. On the same line, US Factory Orders also slumped, falling 1.8% in November after gaining 0.4% in October.
- Despite the mixed readings of the key US data, Atlanta Federal Reserve bank president Raphael Bostic stated that the US economy is definitely slowing, which in turn drowned the key US Treasury bond yields and the US Dollar. That said, the US 10-year Treasury yields dropped 16 basis points (bps) to 3.56%, the lowest levels in three weeks, whereas the US Dollar Index (DXY) marked the biggest daily slump since November 11. Given the inverse relationship between the Gold price and the US Dollar, the yellow metal managed to refresh the multi-day high afterward.
- From a technical perspective, the RSI indicator holds above the mid-line and stabilized around 55, still on a bullish strength. The Momentum indicator continued developing above the mid-line, suggests upside potentials. On downside, the immediate support is 1860, below this area may resume the decline to 1842.


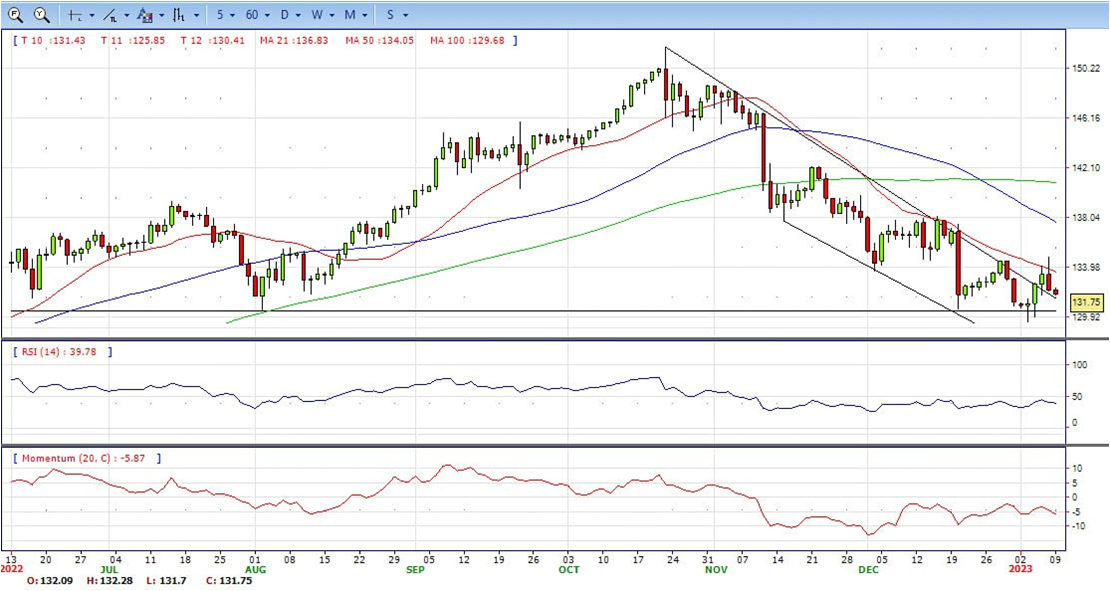
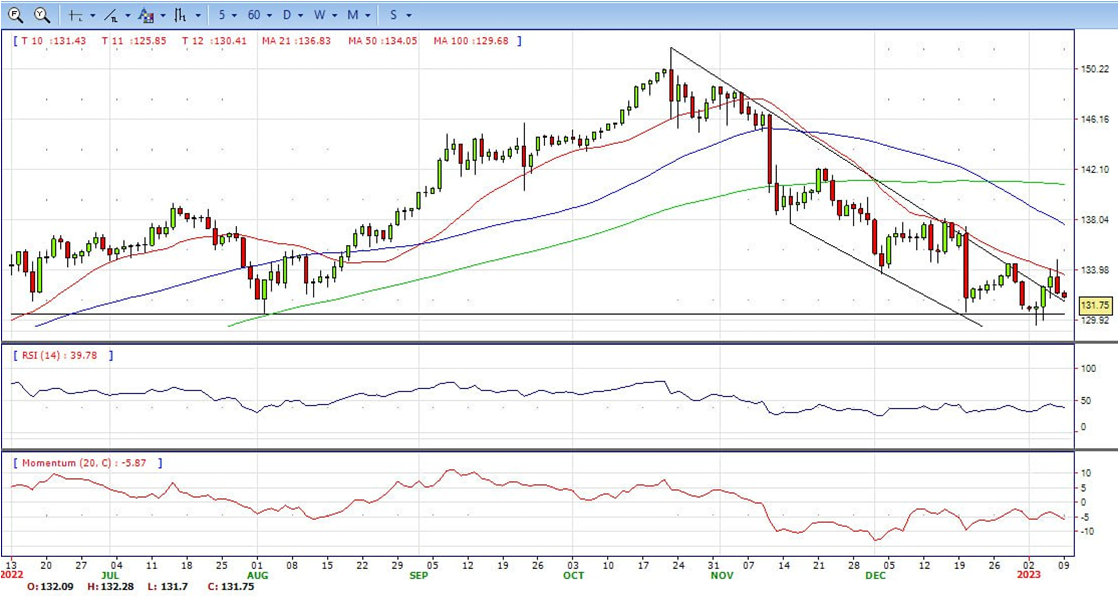
- The USD/JPY struggles at the 21-day Moving Average (EMA) around 134, dropping beneath the 133.00 mark, after weak US economic data, weighed on the US Dollar, exacerbating a fall of more than 200 pips in the major and closed at 132.09.
- The Non-farm Payrolls in December increased by 223K, above estimates of 200K, data showed on Friday. The Unemployment Rate fell to 3.5% YoY, against estimates of 3.7%, while Average hourly earnings rose 4.6%, below the market consensus of 5.0%, welcomed news for Fed officials, who see wage pressures as a hurdle to tackle inflation. Services PMI slumped to the lowest levels in 31 months while suggesting a contraction in activities with 49.6 figures for December, versus the market expectations of 55 and 56.5 marked in November.
- Japanese Prime Minister Fumio Kishida said on Sunday his government and the central bank must discuss their relationship in guiding economic policy after he names a new Bank of Japan (BOJ) governor in April, reported Reuters. The news also adds that the remark heightens the chance the government may revise its a decade-long blueprint with the central bank that focuses on beating deflation, a move that would lay the groundwork for an exit from the BOJ’s ultra-loose monetary policy.
- The USD/JPY pair stabilized around 133.30 for settlement,up for the day and neutral in the daily chart. The price still hold below all main SMAs but breach of up trend-line. On upside, overcome 134.50 may encourage bulls to challenge 136.00, break above that level will open the gate to 138.50.
- Technical indicators suggest the bearish strength, hovering below the mid-line. RSI fell to 35, while the Momentum indicator continued in negative territory, suggests bear potentials. On downside, the immediately support is 131.5, break below this level will open the gate to 130 area.
- DJI gained strength last Friday, hit intraday low 33037 area, then reversed to 33862 following a disappointing ISM Services report and an earlier jobs report. Market shows bullish strength in the hourly chart. It rose above all main SMAs, suggests strong bullish sign. Meanwhile, the 20 SMA continued accelerating north and heading towards longer ones, indicating a more upside potential. On upside, overcome 33864 may encourage bulls to challenge 34000, break above that level will open the gate to 34300.
- Technical indicators also suggest the bullish movement, developing above the mid-line. RSI stabilized around 70, while the Momentum indicator hovering well above the mid-line, suggests upwards potentials. On downside, the immediately support is 33575, break below this level will open the gate for more decline to 33425 area.
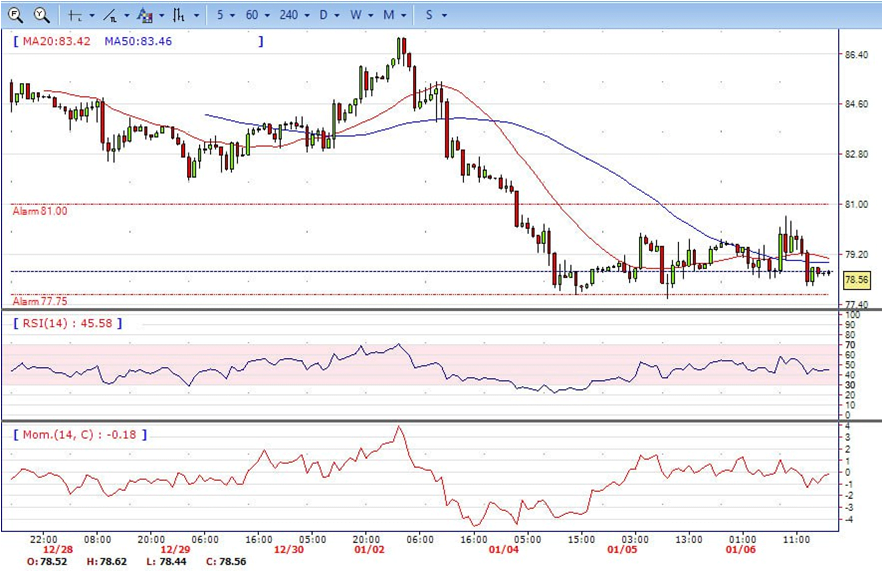
- The Brent is still under the sell pressure, the prices did climb to a fresh high of 80.58 on early US session. However, it gave up the gains and continued its side-way moves to 78.50 area. The market down for the day and still bearish in the hourly chart. The Brent stabilized below 20 SMA and 50MA, suggests some bearish strength. The price still maintains the downward slope, the cross between 20 and 50MA, indicating bears not exhausted yet. On upside, overcome 80.00 may encourage bulls to challenge 80.58, break above that level will open the gate to 82.00.
- Technical indicators suggest the bearish movement, hovering below the mid-line. RSI stabilized around 43, while the Momentum index continued developing below the mid-line, suggests downward potentials. On downside, the immediately support is 77.60, break below this level will open the gate for more decline to 75.65 area.