07/12/2022 Daily Reports
- The Euro is extending some of its Monday losses against the US Dollar, stuck below the 1.0500 figure amidst a risk-off impulse, as data released in the United States did not bolster the USD. Factory Orders in Germany surprisingly exceeded estimates, underpinning the Euro. Therefore, the EUR/USD is trading at 1.0465 after hitting a daily low of 1.0459.
- Wall Street is set to open lower, portraying a dismal mood. The Department of Commerce (DoC) in the United States revealed the October Trade Balance, which showed the deficit widening for two-consecutive months, as figures came at $-78.2B exceeding estimates of $-80B, though trailed by September’s $-74.1B. Delving into the data, the Exports rose by $256.6B below September’s data, while Imports jumped $334.8B above the previous month’s $332.6B.
- In the Euro area, Germany revealed its October Factory Orders, which rose above estimates of 0.1% and smashed September’s figures. Worth noting that orders grew for the first time since July. Compared to October 2021, orders fell at an adjusted 3.2%. The report added that companies still have difficulties fulfilling their orders as supply chains are interrupted, blamed on the war in Ukraine and distortions spurred by the Covid-19 crisis.
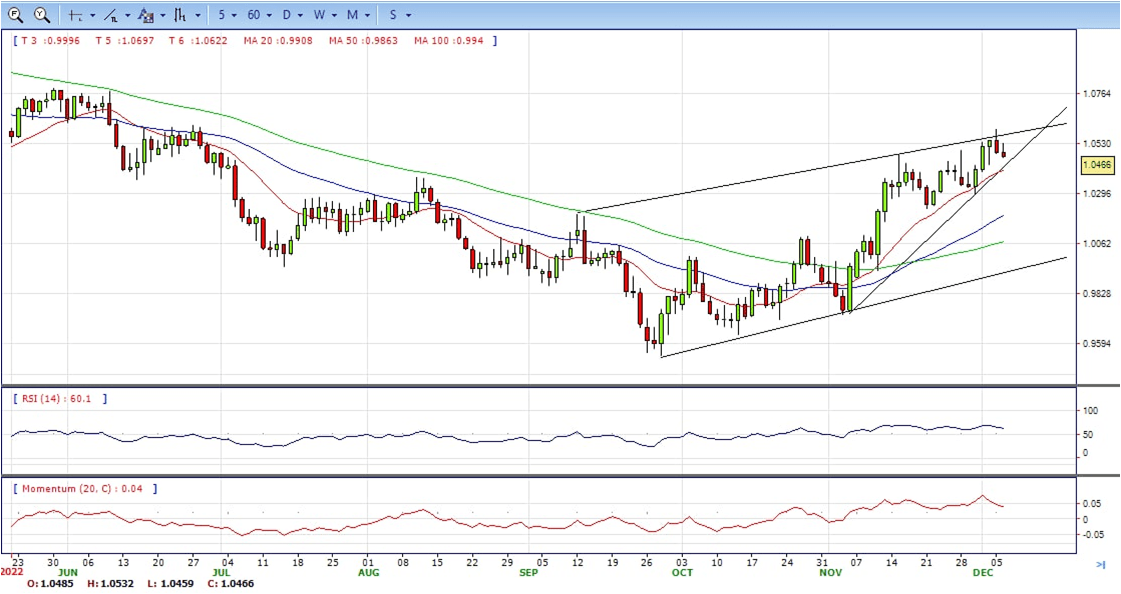
- The EUR/USD pair is trading near the 1.0465, down for the day with bullish stance in daily chart. The pair stabilized above 20 and 50 SMA, indicates bullish strength. Meanwhile, the 20 SMA continued accelerating north and developing far above longer ones, suggests bulls not exhausted yet. On upside, the immediate resistance is 1.0600, break above this level will extend the advance to 1.0700.
- Technical readings in the daily chart support the bullish stances. The RSI indicators hovering above the midline and stabilized around 62. The Momentum indicator stabilized above the midline, indicating upward potentials. On downside, the immediate support is 1.0430 and below this level will open the gate to 1.0290.
- The GBP/USD pair surrendered the support of 1.2160 in the US session. the British Pound remains within the bullish trend but is testing the 1.2130 December low.
- The US Dollar struggles to capitalize on the overnight solid recovery move from over a five-month low and turns out to be a key factor lending support to the GBP/USD pair. That said, expectations that the Fed may raise interest rates more than projected act as a tailwind for the buck. This, along with a bleak outlook for the UK economy, keeps a lid on any meaningful upside for spot prices.
- On the United Kingdom front, upbeat consumer spending data failed to keep reins in the Pound Sterling. Like-For-Like Retail Sales reported by the British Retail Consortium (BRC) escalated to 4.1% from the prior release of 1.2% in November on an annual basis. This might create more troubles for the Bank of England (BOE) as upbeat retail sales cement higher inflation expectations in the near term.
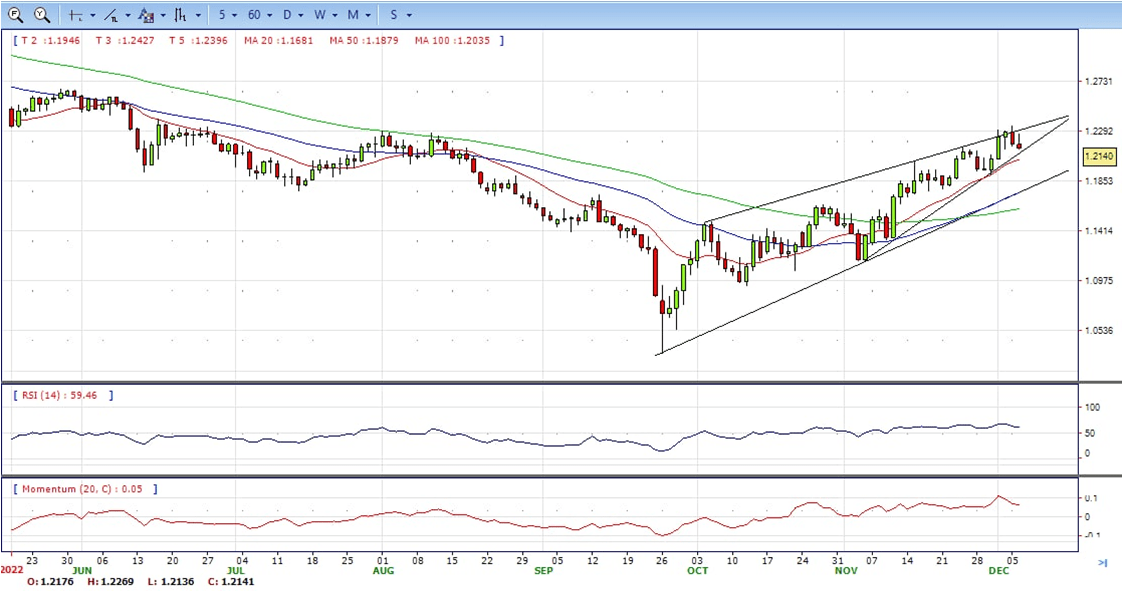
- The GBP/USD offers bullish stance in daily chart. Cable still stabilized above all main SMAs, indicating bullish strength in short term. Meanwhile, the 20 SMA continued accelerating north and developing above longer ones, suggests bulls not exhausted yet. On upside, The immediate resistance is 1.2230 with a break above it exposing to 1.2350.
- Technical readings in the daily chart support the bullish stances. RSI indicator stabilized around 61, while the Momentum indicator stabilized above the midline, suggesting upward potentials. On downside, the immediate support is 1.2130, unable to defend this level will resume the decline to 1.2030.


- Gold price turns positive after diving to new weekly lows around $1766.90 and grinds higher amidst a buoyant US Dollar, even though US Treasury yields are weakening, amidst a risk-off impulse spurred by increasing recessionary jitters. That said, the XAU/USD is trading at $1769.48, almost flat, at the time of typing.
- Earlier, the US Department of Commerce revealed that Trade Balance in the United States widened to $-78.2B compared to September’s $-74.1B, beneath estimates of $-80B. Although the trade deficit expanded, data was mainly ignored as investors assessed the US economy.
- Given the backdrop mentioned above, the next week’s FOMC meeting would be crucial, albeit the Federal Reserve Chair Jerome Powell gave the green light on 50 bps rate hikes. However, with US data looming, like the Producer Price Index, the University of Michigan, and the following week’s CPI, it would shed some cues about inflation elevating or easing.
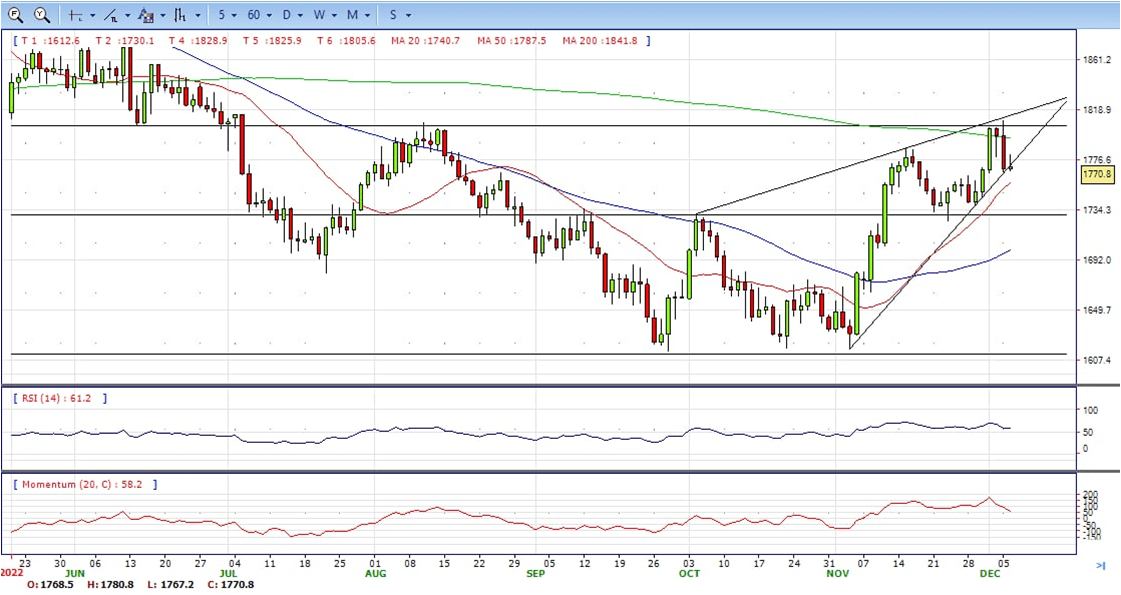
- Gold price stabilized around 1767, down for the day and bullish in the daily chart. The gold price still stabilized above 20 and 50 SMA, suggesting bullish strength in short term. Meanwhile, the 20 SMA continued accelerating north and developing above 50 SMA, indicating bulls not exhausted yet. On upside, the immediate resistance is 1810, break above this level will open the gate to extend the advance to 1830 area.
- From a technical perspective, the RSI indicator hold above the midline and stabilized around 58, suggesting bullish strength. The Momentum indicator stabilized above the midline, suggests upward potentials. On downside, the immediate support is 1760, below this area may resume the decline to 1730.


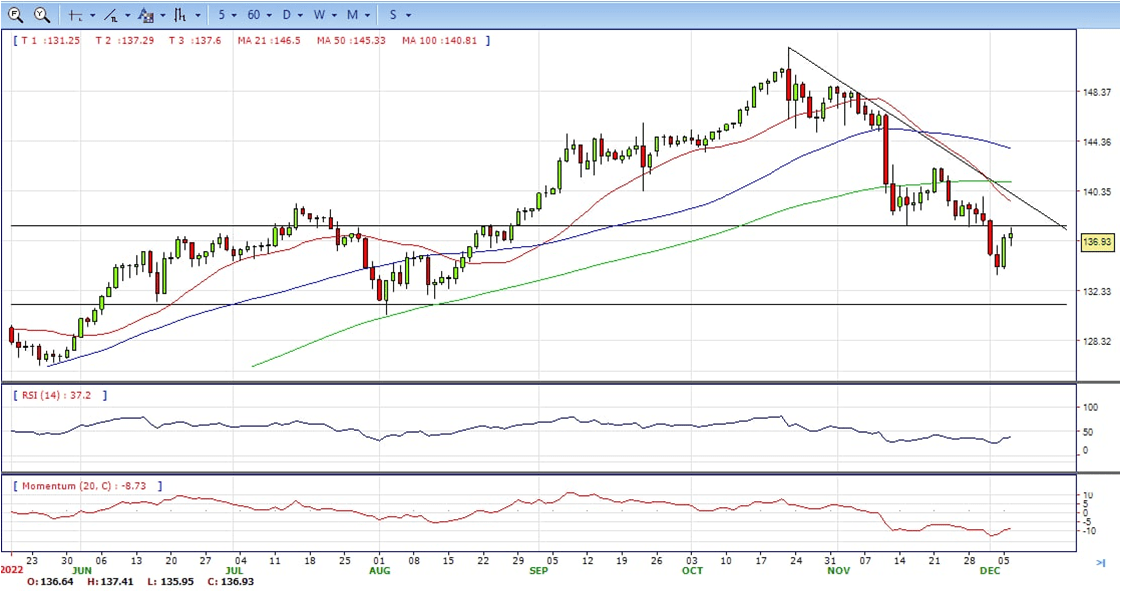
- The USD/JPY remains advance in the North American session, spurred by dented risk appetite produced by the last three days’ economic data from the US suggesting further tightening needs by the Federal Reserve. Nonetheless, the USD/JPY edges higher, trading at 136.90, partly due to increasing US Treasury yields.
- Before Wall Street opened, the US Department of Commerce revealed that Trade Balance in the United States widened to $-78.2B compared to September’s $-74.1B, beneath estimates of $-80B. Delving into the data, the Exports rose by $256.6B below September’s data, while Imports jumped $334.8B above the previous month’s $332.6B.
- Meanwhile, data revealed since last Friday portrays that the labor market in the US remains tight, while Average Hourly Earnings jimping 5.1% YoY added to inflationary pressures. Aside from employment data, the US Institute for Supply Management revealed that the Service PMI Index rose 56.6, better than the 53.3 expected.
- The USD/JPY pair stabilized around 136.90, up for the day and bearish in the daily chart. The price still maintains the downward slope and develops below all main SMAs, suggests bearish strength in short term. Meanwhile, 20 SMA continued accelerating south and developing below longer ones, indicating bears not exhausted. On upside, overcome 137.50 may encourage bulls to challenge 140.00, break above that level will open the gate to 142.20.
- Technical indicators suggest the bearish strength. RSI stabilized around 39, while the Momentum indicator continued developing below the midline, suggests downward potentials. On downside, the immediate support is 136.00, break below this level will open the gate to 135.00 area.
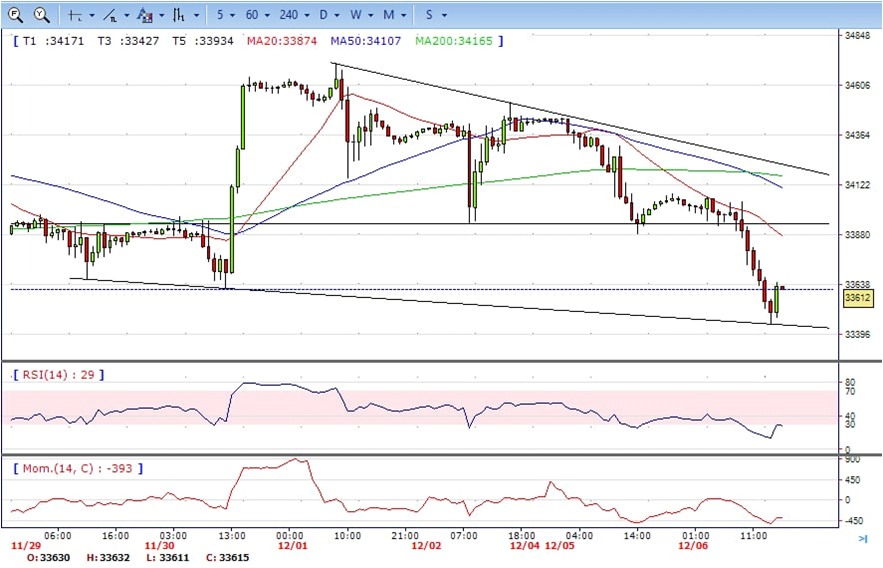
- DJI continued under the sell pressure, tumbled from intraday high 34080 area to low 33450. It recovered modestly at the US session and ended Tuesday at around 33600, down for the day and bearish in the hourly chart. The price stabilized below 20 and 50 SMA, suggests bearish strength. Meanwhile, 20 SMA continued accelerating south and developing below 50 SMA, suggests bears not exhausted yet. On upside, overcome 33900 may encourage bulls to challenge 34150, break above this level will open the gate to 34500.
- Technical indicators indicates the bearish strength. RSI stabilized around 29, while the Momentum indicator stabilized below the midline, suggests downward potentials. On downside, the immediate support is 33450, break below this level will open the gate for more decline to 33180 area.
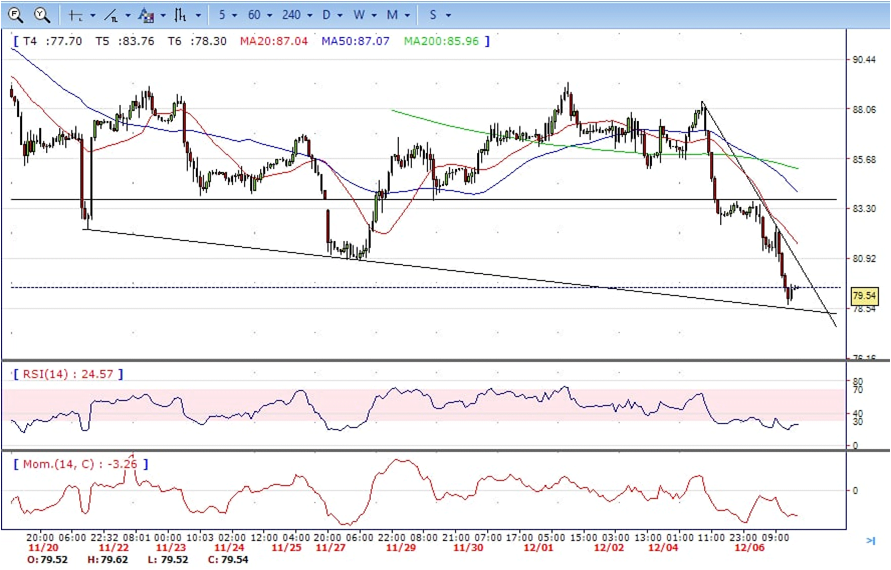
- Brent still under the sell pressure, dropped from intraday high 83.70 to intraday low 78.70 area. It hold near the bottom and ended Tuesday at around 79.60, down for the day and bearish in the hourly chart. The price stabilized below 20 and 50 SMAs, suggests bearish strength in short term. Meanwhile, the 20 SMA continued accelerating south and developing below 50 SMA, indicating bearish bias. On upside, overcome 80.90 may encourage bulls to challenge 82.50, break above this level will open the gate to 83.70.
- Technical indicators suggest the bearish movement, hovering below the midline. RSI stabilized at around 25, while the Momentum indicator stabilized below the midline, suggests downward potentials. On downside, the immediate support is 78.70, break below this level will open the gate for more decline to 77.00 area.