05/01/2023 Daily Reports
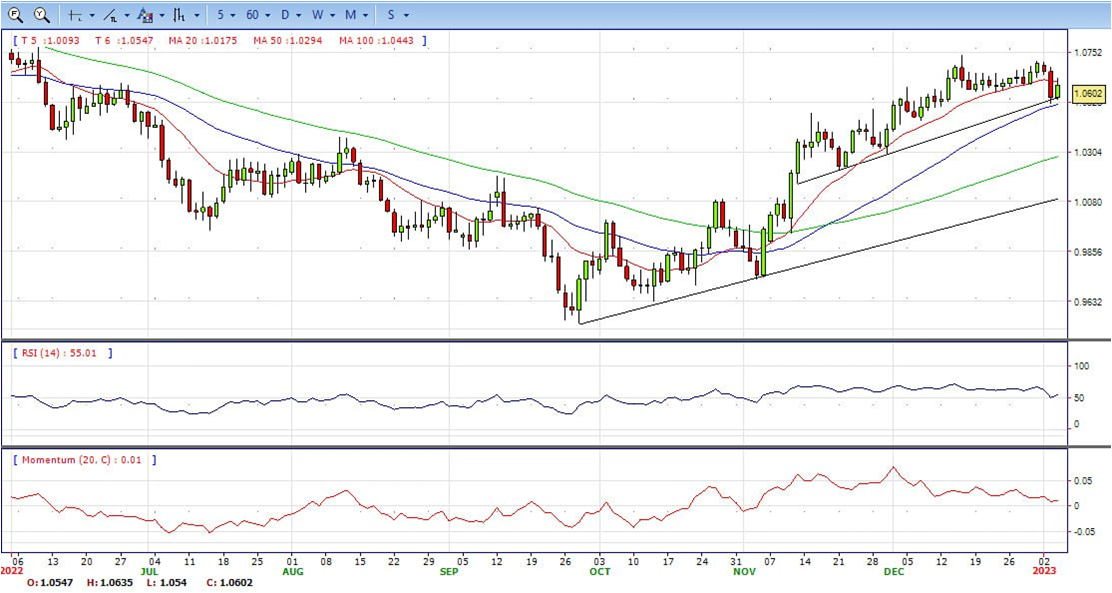
- The Euro (EUR) retraces against the US Dollar (USD) after hitting daily highs of 1.0635 and is dropping after the release of mixed US economic data, slightly boosted the US Dollar and shifting sentiment sour. At the time of writing, the EUR/USD is trading at 1.0616, above its opening price by 0.66%.
- The EUR/USD fell below 1.0600 after the release of US economic data. November’s JOLTs report showed that the labor market remains tight, coming at 10.458M vs. 10.0M estimates, while October’s upward revision to 10.512M vs. 10.334M cemented the Federal Reserve’s (Fed) case for a 50 bps rate hike on February 1.
- At the same time, the Institute for Supply Management (ISM) revealed the Manufacturing PMI index for December, which fell to 48.4, more than the 48.5 estimated by street analysts. Timothy R. Fiore, Chair of the ISM, noted, “The US manufacturing sector again contracted, with the Manufacturing PMI® at its lowest level since the coronavirus pandemic recovery began. With Business Survey Committee panelists reporting softening new order rates over the previous seven months, the December composite index reading reflects companies’ slowing their output.”
- From a daily chart perspective, the EUR/USD remains neutral biased, seesawing around the 20-day Exponential Moving Average (EMA) at around 1.0583. Since today’s price action has failed to crack Tuesday’s high of 1.0683, the EUR/USD pair remains exposed to selling pressure. However, it should be said that the Relative Strength Index (RSI) bounced nearby the 50 mid-line, the EUR/USD key resistance levels are 1.0683, followed by the 1.0700 mark. On the flip side, the EUR/USD first support would be the 1.0600 mark, followed by the 20-day EMA at 1.0584 and the January 3 swing low of 1.0519.
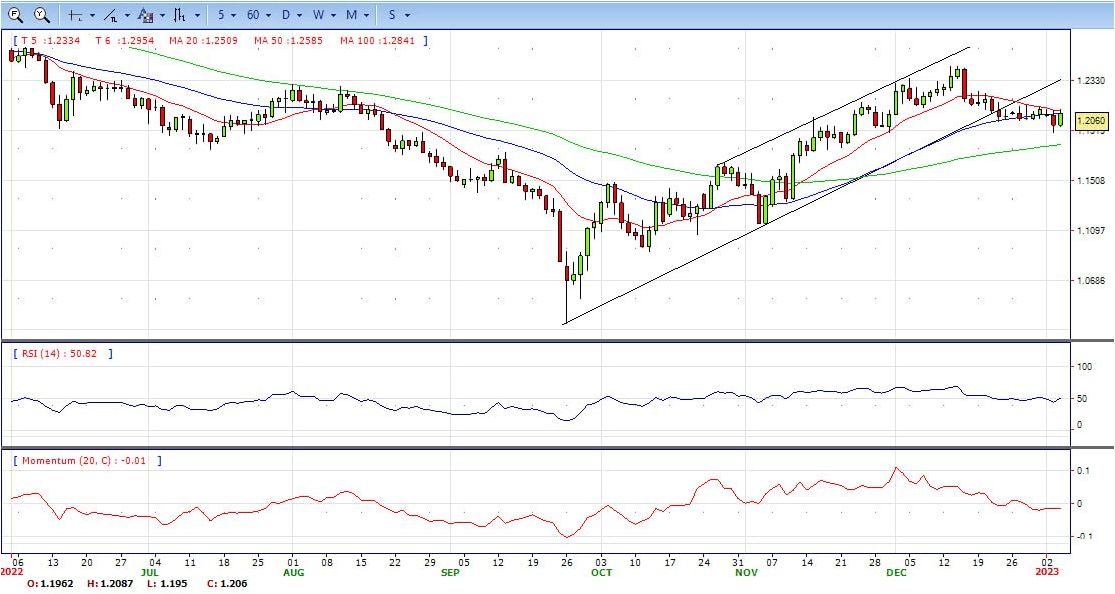
- GBP/USD edged modestly lower after having reached a daily high of 1.2088 during the European trading hours. As of writing, the pair was still up 0.75% on the day at 1.2057.
- The positive shift witnessed in risk sentiment earlier in the day caused the US Dollar to come under renewed selling pressure. Additionally, falling US Treasury bond yields put additional weight on the currency. The benchmark 10-year US Treasury bond yield, which fell more than 2% on Tuesday, stays in negative territory below 3.7%.
- Later in the session, the ISM’s will release the December Manufacturing PMI report. The headline PMI is forecast to decline to 48.5 from 49 in December. Market participants will also pay close attention to the Prices Paid component of the survey, which will offer fresh insight into input inflation in the manufacturing sector.
- The GBP/USD offers bearish stance as it still below 20 and 50 SMA, indicating bear in short term. RSI indicator around 50, while the Momentum indicator stabilized below the midline, suggesting more downward potentials. On downside, the immediate support is 1.1960, unable to defend this level will resume the decline to 1.1900. On the flip side, a break of 1.2100 above 20 and 50 SMA might change the bias to bull.


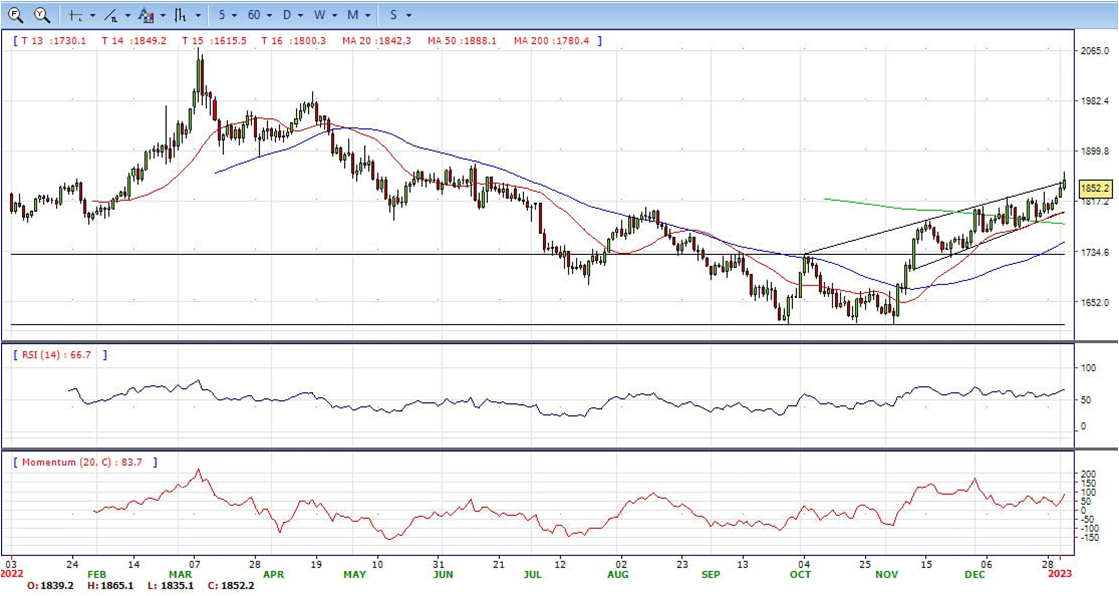
- Gold price is holding close to the highest level in seven months above $1,860 in the European session, accelerating the upbeat momentum, as the US Dollar tumbled across the board following a hot start to 2023. It then clings to gains around $1850 following the release of the Federal Reserve’s Open Market Committee (FOMC) minutes for the last meeting, which emphasized the need for the central bank to tighten conditions amid stubbornly high inflation levels. At the time of writing, the XAG/USD is trading at around $1,850.
- The December minutes showed that policymakers agreed to slow the pace of interest rate hikes but added that a slowdown is not a “weakening commitment to achieving price stability on that inflation is already on a persistent downward path.” Fed officials added that the US central bank had made significant progress in moving to restrictive policies and added that no rate cuts would be necessary for 2023.
- Gold price has delivered a breakout of the Ascending Triangle chart pattern formed on a four-hour scale. The horizontal resistance of the aforementioned chart pattern is placed from December 13 high at $1,824.55 while the upward-sloping trendline is plotted from December 16 low at $1,774.36.
- From a technical perspective, Advancing 20-and 50-period Exponential Moving Averages (EMAs) at $1,820.00 and $1,812.07 respectively add to the upside filters. Meanwhile, the Relative Strength Index (RSI) (14) is at 66 and Momentum above 80, which indicates more upside ahead.


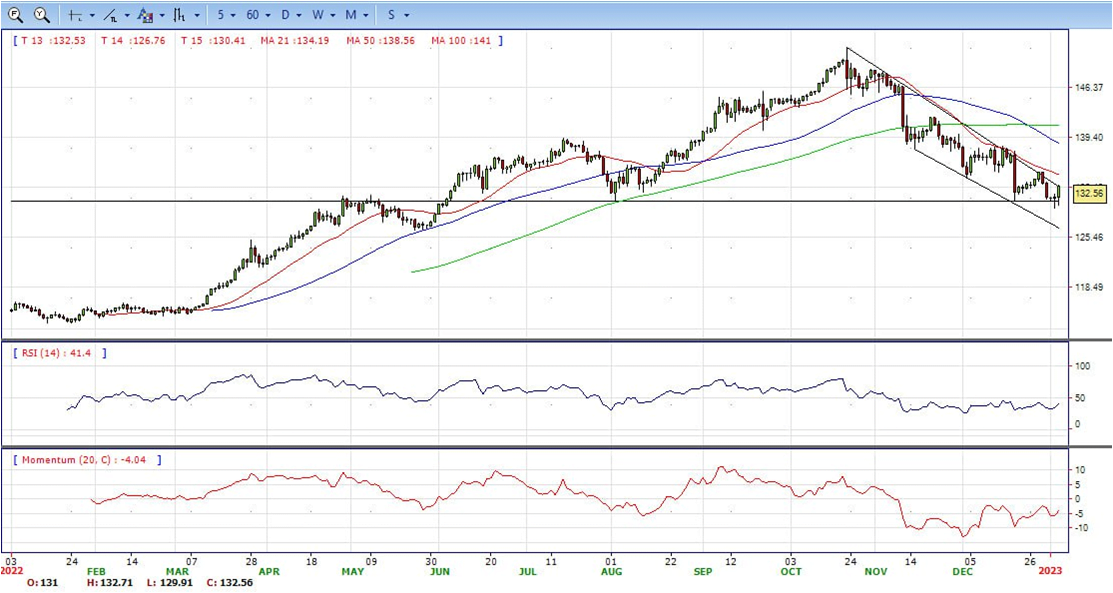
- The USD/JPY jumped from below 131.00 to 132.60 hitting the highest level since December 30 following the release of the US ISM Manufacturing Index and remained strong after the FOMC minutes. A sharp rebound in US yields weighed on the Japanese Yen.
- The DXY is falling by just 0.35% and trades at 104.30 after being under 104.00 hours ago. The rebound accelerated after the latest round of US economic data. On the contrary, the Yen weakened amid surging US bond yields. The US 10-year yield rose from six-day lows at 3.67% to 3.71%.
- The ISM Manufacturing report showed that business activity in the manufacturing sector contracted for the second straight month in December. The main index declined to 48.4 from 49 in November and below the market consensus of 48.5. The employment index rose to 51.4 surpassing expectations. The Price Paid index declined from 43 to 39.4, another sign of a slowdown in inflation.
- The USD/JPY is breaking and holding above 131.30/50, a positive development for the bulls. The pair is now looking at 132.00. Above the next relevant barrier is seen at the 134.20/50 zone. However, short term remain bearish as market still below 21, 50 and 100 MA. A decline back under 131.50 should suggest that the bearish pressure is still intact suggesting the bullish correction is over. A consolidation below 130.00 is needed to clear the way to more losses.
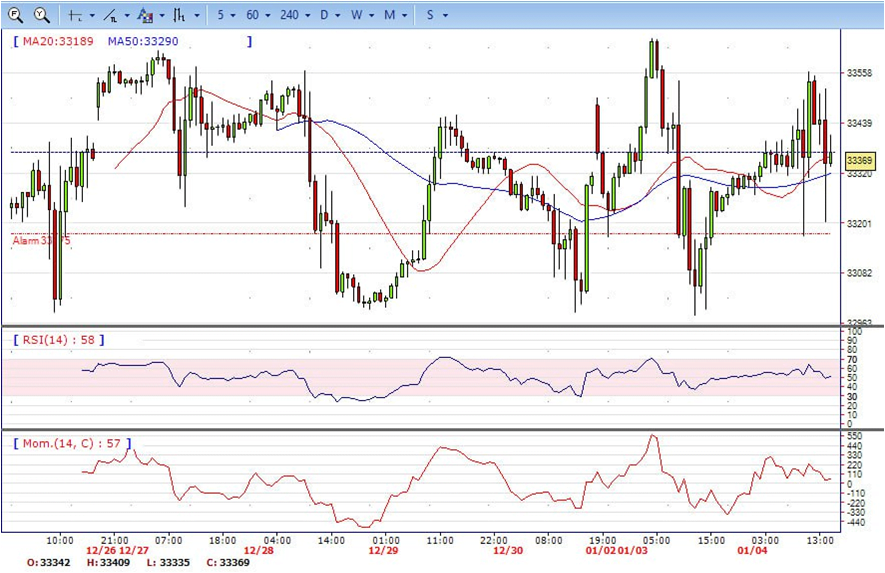
- DJI is doing sideways today, price hit as high as 33560 and dip as low as 33170. Market is trading at 33380 as the time of writing, slight down for the day and bullish in the daily chart. The price stabilize around 20 and 50 SMA, suggest neutral in short term. Meanwhile, 20 SMA started turning flat but continued trading above 50 SMA, suggest bulls not exhausted yet. On upside, overcome 33550 may encourage bulls to challenge 33650, break above this level will open the gate to 34000.
- Technical indicators suggest the neutral condition. RSI stabilize at around 50, while the Momentum indicator stabilize around 0, On downside, the immediate support still at 33000, break below this level will open the gate for more decline to 32850 area.
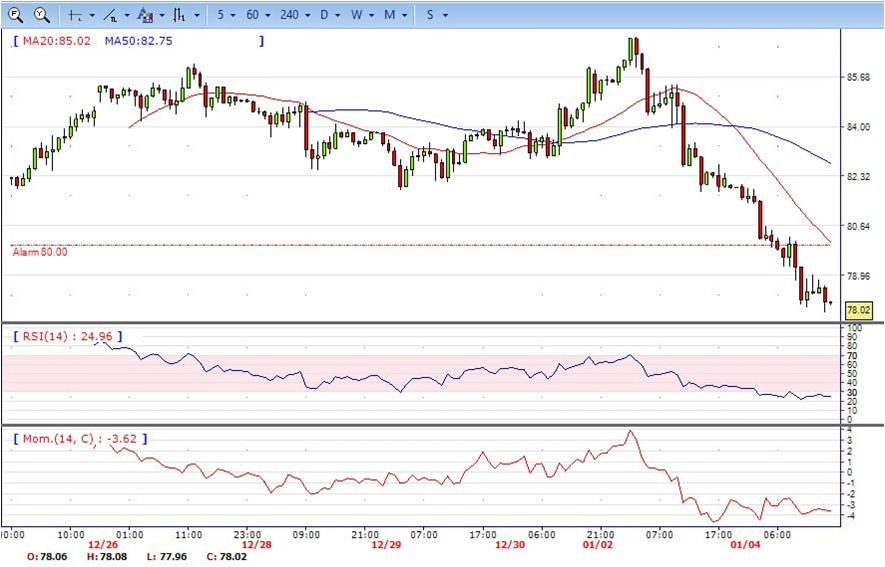
- The Brent Oil fell more than 2% on Wednesday, the prices hit a 3-week low of 77.74 lately and short term poses strong bearish condition. The recent weakness still due concerns of diminishing demand from China, as the country worried about delayed economic recovery in China. At the time of writing, Brent is trading at 77.96 per barrel.
- Brent fell below both 20 and 50MA, also short term trendline breach from hourly chart suggest a strong bearish sign. Technical indicators suggest on the downside. RSI slip below 50 and stay at 25, while the Momentum indicator sharply fell to negative territory, suggest downwards potentials. On downside, the immediate support is 77, break below this level will open the gate for more decline to 76 area.