04/10/2022 Daily Reports
- The EUR/USD found support above 0.9750 and rose during the American session to 0.9844, hitting a fresh daily high. The pair ended Monday around 0.9820, still bearish in the daily chart.
- The DXY printed a new weekly low at 111.47 and it is hovering around 111.65. The greenback is falling across the board weakened by several factors, including a recovery in Treasuries. The US 10-year yield bottomed at 3.57%, moving further away from the 4% area it traded just a few days ago. European yields are also lower on Monday.
- US economic data came in below expectations with the ISM Manufacturing Index at 50.2 in September down from 52.8 in August and below the 52.2 of market consensus. It was the lowest reading in over two years.
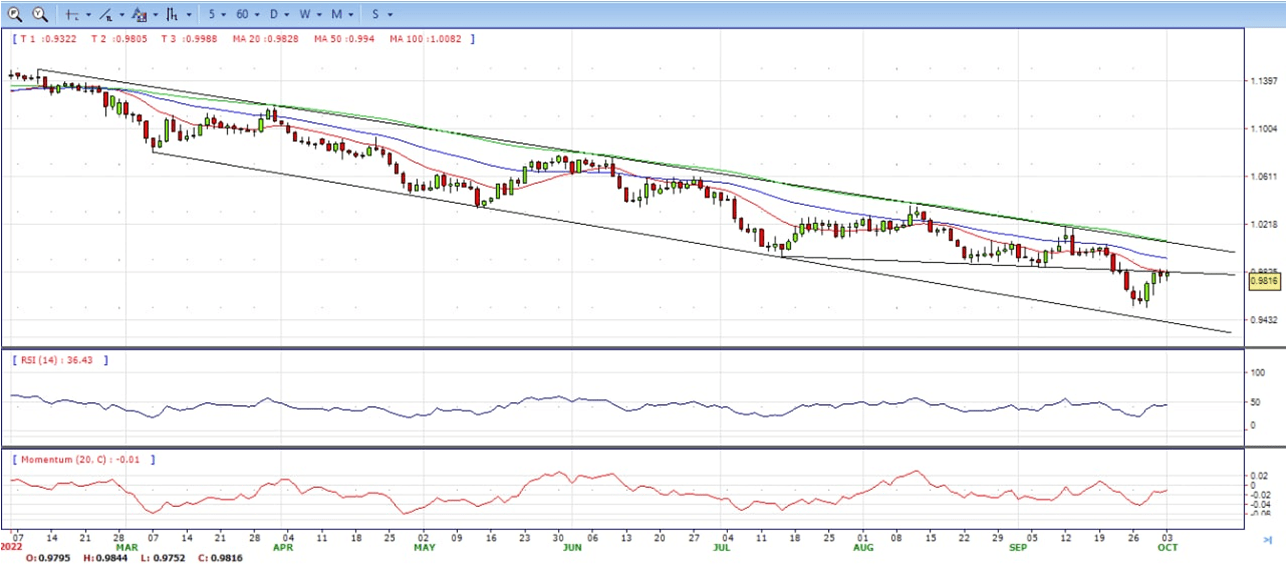
- The EUR/USD pair is trading near the 0.9820, unchanged for the day with the bearish stance in daily chart. The pair still stabilized below 20 and 50 SMA, indicates bearish strength. Meanwhile, 20 SMA continued accelerating south and developing below longer ones, suggests bears not exhausted yet. On upside, the immediate resistance is 0.9830, break above this level will extend the advance to 0.9920.
- Technical readings in the daily chart support the bearish stances. The RSI indicators hovering below the midlines and stabilized around 44, shows bearish strength. The Momentum indicator stabilized below the midline, indicating downward potentials. On downside, the immediate support is 0.9730 and below this level will open the gate to 0.9630.
- Following the sharp upsurge witnessed in the early European morning, the GBP/USD pair stayed in a consolidation phase near 1.1200 before gathering bullish momentum in the American session. The pair was last seen trading at its highest level in 10 days at 1.1330, neutral to bullish in the daily chart.
- Reports suggesting that British Prime Minister Liz Truss and Finance Minister Kwasi Kwarteng would reverse a cut to the higher rate income tax caused UK gilt yields to fall sharply and provided a boost to the British pound at the beginning of the week. After Kwarteng confirmed the reports by saying “we are not proceeding with the abolition of the 45p tax rate. We get it, and we have listened,” the pair held its ground despite the modest dollar strength.
- Although the headline PMI arrived above 50, the Employment Index fell to 48.7, revealing a contraction in manufacturing sector jobs ahead of the September Nonfarm Payrolls data on Friday. Additionally, the Prices Paid Index fell to 51.7 from 52.5 in August. Softening input inflation and declining employment in the sector caused investors to reassess the Fed’s policy outlook with the CME Group FedWatch Tool’s probability for a 75 basis points rate hike falling toward 50.
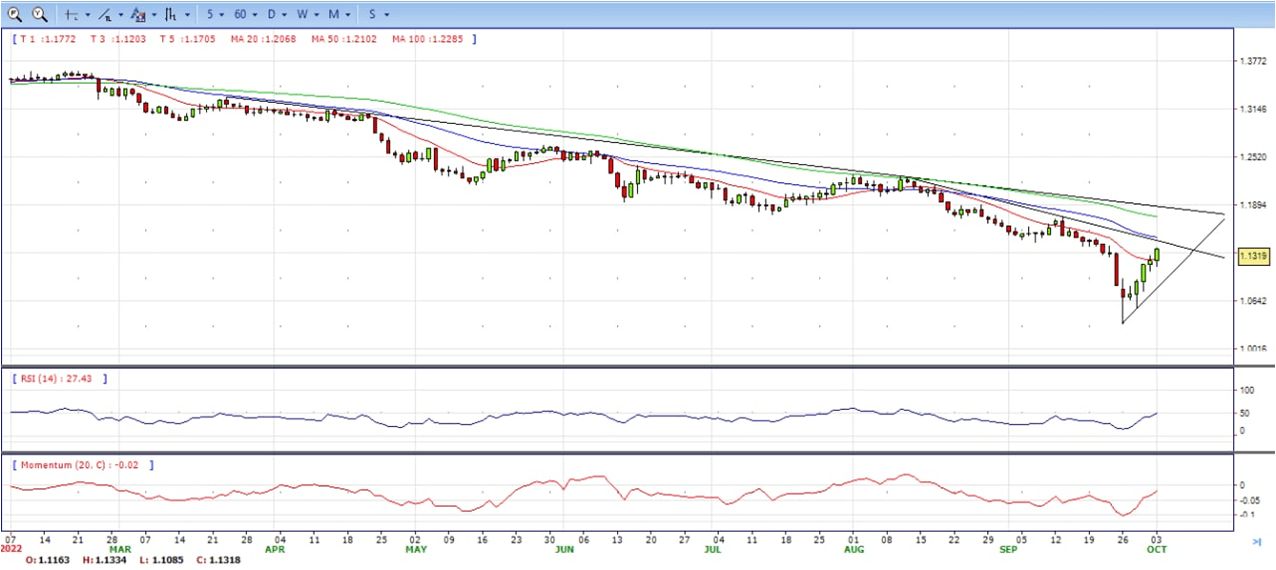
- The GBP/USD still offers neutral stance in daily chart, it maintains the upward slope after hit 1.0350 low. Cable now is stabilized above 20 SMA, indicating bullish strength in short term. However, the 20 SMA started turning flat but continued developing far below longer ones, suggesting bears not exhausted yet. On upside, The immediate resistance is 1.1340 with a break above it exposing to 1.1450.
- Technical readings in the daily chart neutral to bearish stances. RSI indicator stabilized around 50, while the Momentum indicator stabilized below the midline, suggesting downward potentials. On downside, the immediate support is 1.1170, unable to defend this level will resume the decline to 1.1030.

- Gold gathered bullish momentum and climbed above $1,700 for the first time since mid-September. The pair ended Monday near the top, bullish in the daily chart.
- The sharp decline witnessed in the US Treasury bond yields seems to be fueling gold’s rally on the first trading day of the fourth quarter. The benchmark 10-year US T-bond yield was last seen losing 5.5% on the day at 3.6%. Reflecting the negative impact of falling yields’ on the dollar’s market valuation, the US Dollar Index is down 0.3% on the day below 112.00.
- The sharp decline witnessed in the US Treasury bond yields seems to be fueling gold’s rally on the first trading day of the fourth quarter. The benchmark 10-year US T-bond yield was last seen losing 5.5% on the day at 3.6%. Reflecting the negative impact of falling yields’ on the dollar’s market valuation, the US Dollar Index is down 0.3% on the day below 112.00.
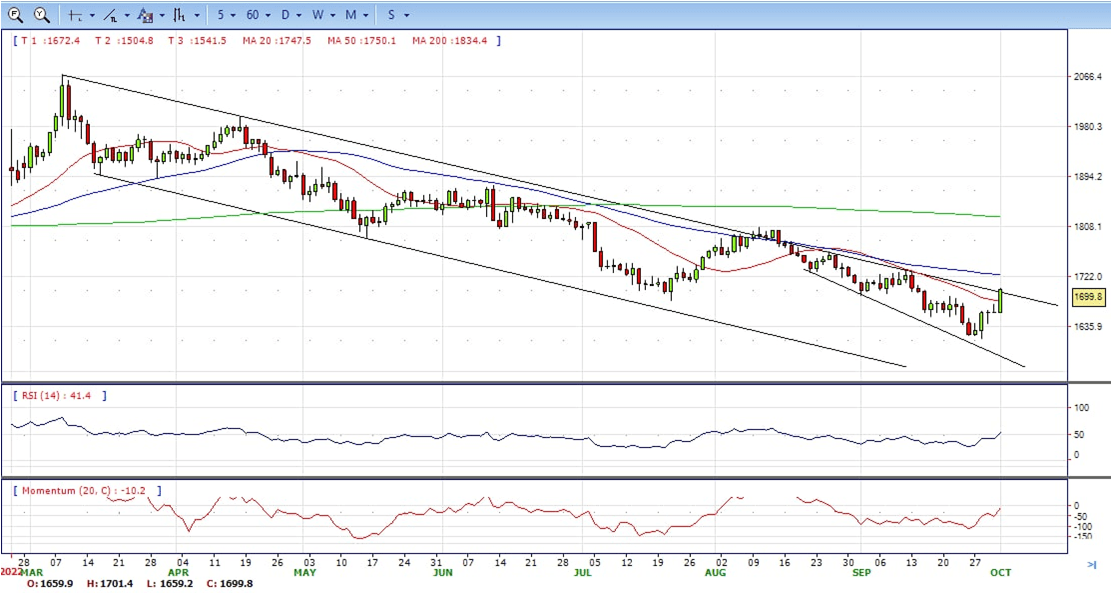
- Gold price stabilized around 1700, up for the day and bullish in the daily chart. The gold price stabilized above 20 SMA and now is challenging upside bearish trend line, suggesting bullish strength. However, the 20 SMA started turning flat but continued developing below longer ones, indicating bears not exhausted yet. On upside, the immediate resistance is 1702, break above this level will open the gate to extend the advance to 1718 area.
- From a technical perspective, the RSI indicator hold above the midline and stabilized around 55, suggesting bullish strength. The Momentum indicator struggled near the midline, suggests directionless potentials. On downside, the immediate support is 1680, below this area may resume the decline to 1660.


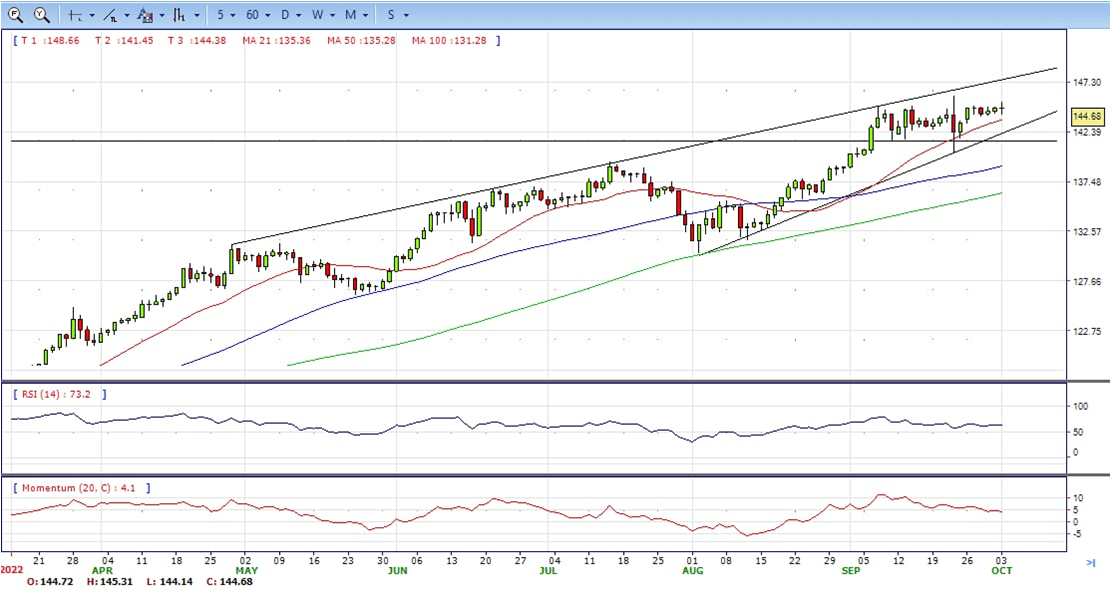
- The USD/JPY dropped after testing the YTD highs at around 145.32 during Monday’s overnight session, though retreated as US T-bond yields, namely the 10-year, collapsed more than 20 bps as sentiment improved. Therefore, the USD/JPY is trading at 144.70, still bullish in the daily chart.
- Japan’s finance minister Shunichi Suzuki said on Monday that the government stands ready to intervene in currency markets to prevent deeper losses in the domestic currency. This, along with the prevalent cautious market mood, offers some support to the safe-haven Japanese yen and caps the upside for the USD/JPY pair.
- A big divergence in the monetary policy stance adopted by the Bank of Japan and other major central banks might continue to weigh on the JPY. It is worth mentioning that the BoJ has been lagging behind other major central banks in the process of policy normalisation and remains committed to continuing with its monetary easing.
- The USD/JPY pair stabilized around 144.70, up for the day and bullish in the daily chart. The price still maintains the upward slope and stabilized above all main SMAs, suggests bullish strength. Meanwhile, 20 SMA continued accelerating north and developing above longer ones, indicating bulls not exhausted in the long term. On upside, overcome 145.00 may encourage bulls to challenge 146.00, break above that level will open the gate to 147.00.
- Technical indicators suggest the bullish strength. RSI stabilized around 64, while the Momentum indicator continued developing above the midline, suggests upward potentials. On downside, the immediate support is 143.00, break below this level will open the gate to 140.30 area.


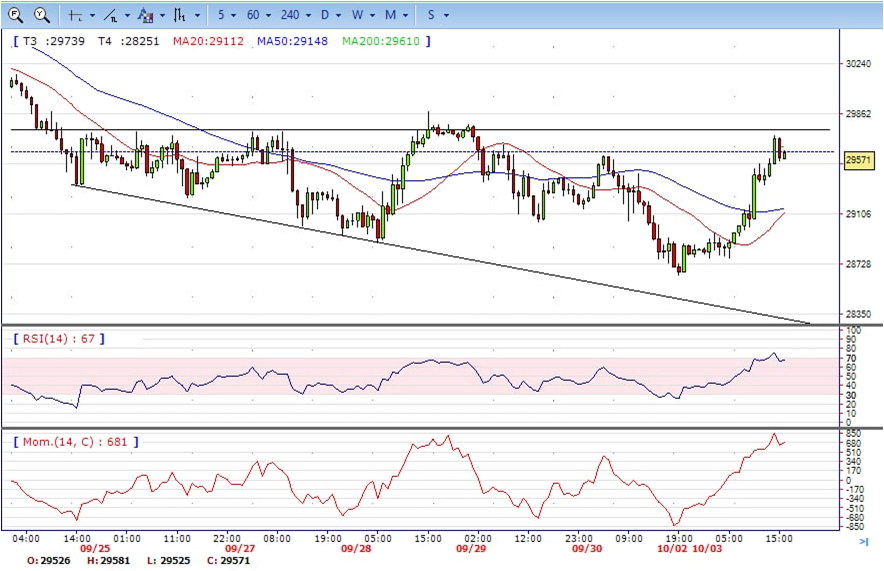
- DJI made a strong rally with around 1000 pips gain, jumped from intraday low 28640 to high 29700. It hold near the top to ended Monday, bullish in the hourly chart. It stabilized above 20 and 50 SMA, suggests bullish strength. Meanwhile, the 20 SMA continued accelerating north and heading towards longer ones, suggesting bulls not exhausted yet. On upside, overcome 29800 may encourage bulls to challenge 30000, break above this level will open the gate to 30300.
- Technical indicators suggest the bullish strength. RSI stabilized around 67, while the Momentum indicator stabilized in positive territory, suggests upward potentials. On downside, the immediate support is 29300, break below this level will open the gate for more decline to 29000 area.
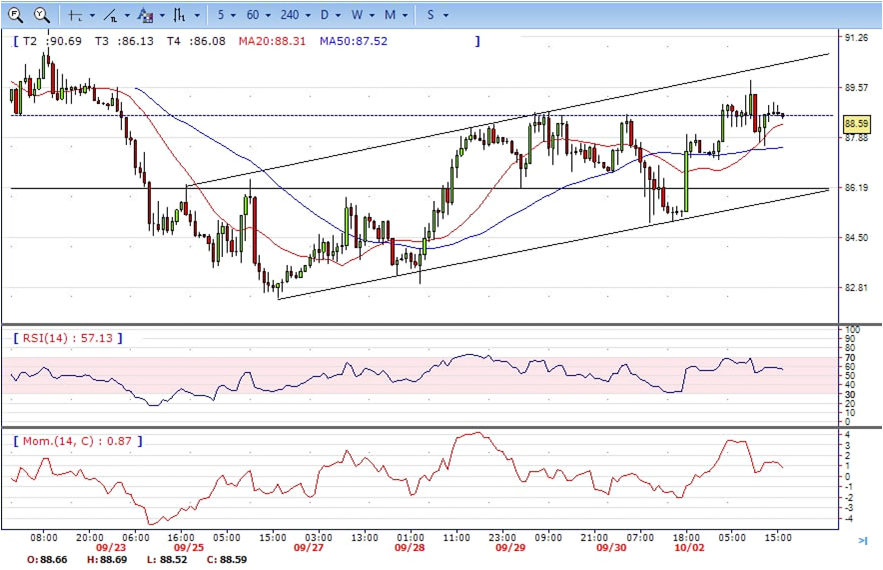
- Brent continued the advance, climbed from 87.00 low to 89.80 region. It retreated modestly and ended Monday around 88.60, still bullish in the hourly chart. The price stabilized above 20 and 50 SMAs, suggests bullish strength in short term. Meanwhile, the 20 SMA continued accelerating north and developing above longer ones, indicating bulls not exhausted yet. On upside, overcome 89.80 may encourage bulls to challenge 91.60, break above this level will open the gate to 92.80.
- Technical indicators suggest the bullish movement, hovering above the midline. RSI stabilized around 59, while the Momentum indicator stabilized in positive territory, suggests upward potentials. On downside, the immediate support is 87.50, break below this level will open the gate for more decline to 86.10 area.