04/04/2023 Daily Reports
- The EUR/USD rose further following the release of US Economic data and printed a fresh daily high at 1.0916. It then pulled back to 1.0900. The US Dollar is under pressure amid lower yields and risk appetite.
- Data showed that economic activity in the US manufacturing sector continued to contract with the ISM Manufacturing PMI falling to 46.3 from 47.7 in February, below the market consensus of 47.5. Ahead of the ADP and the NFP, the Employment index fell to 46.9 from 49.1. A different report showed Construction Spending declined by 0.1% in February. The US Dollar Index is falling 0.50% and is about to test last week’s lows near 102.00. The US 10-year dropped to 3.41%, the lowest level in a week. The lower gained momentum after the release of the US ISM manufacturing report.
- The EUR/USD pair is trading near the 1.0900, up for the day with bullish stance in daily chart. The pair stabilized above 20 and 50 SMA, indicates bullish strength. Meanwhile, the 20 SMA continued accelerating north and heading towards 50 and 200 SMA, suggests bulls not exhausted yet. On upside, the immediate resistance is 1.0930, break above this level will extend the advance to 1.1030.
- Technical readings in the daily chart support the bullish stance. The RSI indicator stabilizes around 60. The Momentum indicator holds above the midline, indicating bullish potentials. On downside, the immediate support is 1.0790 and below this level will open the gate to 1.0700.

- GBP/USD was up some 0.70% in mid-morning US session trade on Monday, traveling from a low of 1.2274 to score a high of 1.2423 after the US Dollar fell sharply during the Wall Street opening hours.
- The greenback was heavily dented by Monday’s economic reports that showed US manufacturing activity in March slumped to its lowest level in nearly three years as new orders continued to contract. The ISM reported that its Manufacturing PMI fell to 46.3 last month. This was the worst since May 2020, from 47.7 in February. Nevertheless, federal funds futures are now pricing in a 60% chance of another 25 bps rate hike by the Fed in May, down around 5% on the back of today´s manufacturing data. Moreover, futures traders have also factored in a pause in June and rate cuts by December.
- The GBP/USD offers bullish stance in daily chart. Cable stabilizes above 20 and 50 SMA, indicating bullish strength in short term. Meanwhile, the 20 SMA continued accelerating north and heading towards longer ones, suggests bulls not exhausted yet. On upside, the immediate resistance is 1.2450 with a break above it exposing to 1.2550.
- Technical readings in the daily chart support the bullish stances. RSI indicator stabilizes around 58, while the Momentum indicator stabilizes above the midline, suggesting upward potentials. On downside, the immediate support is 1.2270, unable to defend this level will resume the decline to 1.2170.


- Gold price is up by almost 1% on Monday, after rising more than $40 from the daily low. XAU/USD bottomed on Asian hours at $1,949 and then reversed its course. Recently reached at $1,990 the highest level in a week. It remains near the high, with a positive tone as the US Dollar tumbles.
- The yellow metal gained momentum amid a slide in US yields, a weaker US Dollar and risk appetite. The US 10-year yield fell to 3.40% after the release of the US ISM Manufacturing PMI. The US Dollar Index is down by 0.45%, hovering around 102.15, after reaching levels under 102.00. Large price swing could continue, taking into account what’s ahead in the economic calendar. After today’s softer ISM Manufacturing PMI, attention turns to Wednesday’s ADP Private Employment and ISM Service PMI; on Friday the official employment report is due.
- Gold price stabilized around 1985, up for the day and bullish in the daily chart. The gold price still stabilizes above all main SMAs, suggesting bullish strength in short term. Meanwhile, the 20 continued accelerating north and continued developing far above 200 SMA, indicates bulls not exhausted yet. On upside, the immediate resistance is 2010, break above this level will open the gate for more advance to 2040 area.
- From a technical perspective, the RSI indicator holds above the mid-line and stabilizes around 61, on a bullish strength. The Momentum indicator hold in the positive territory, suggests upward potentials. On downside, the immediate support is 1934, below this area may resume the decline to 1919.


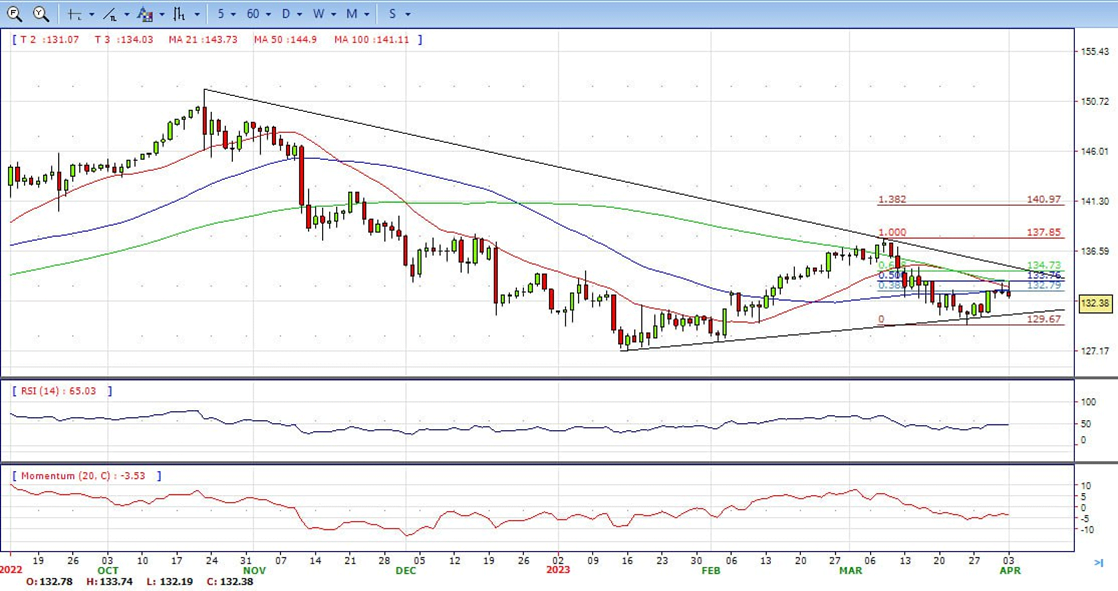
- USD/JPY retraces from two-week highs at around 133.75 and extends its losses below the 50-day Exponential Moving Average at 133.25 after failing to pierce the 200-day EMA at 133.79. At the time of writing, the USD/JPY is exchanging hands at 132.28, down 0.33%.
- The US Dollar struggles to capitalize on its intraday gains amid the uncertainty over the Fed’s rate-hike path, which turns out to be a key factor exerting some downward pressure on the USD/JPY pair. The downside, however, seems limited, at least for the time being, amid a generally positive risk tone, which tends to undermine the traditional safe-haven Japanese Yen.
- The USD/JPY pair stabilized around 132.38, down for the day and bearish in the daily chart. The price still stabilizes below 20 and 50 SMA, suggests bearish strength in short term. Meanwhile, 20 SMA continued accelerating south and heading towards 50 SMA, indicating bears not exhausted. On upside, overcome 133.80 may encourage bulls to challenge 135.10, break above that level will open the gate to 137.00.
- Technical indicators suggest the bearish strength. RSI stabilizes around 48, while the Momentum indicator stabilizes below the midline, suggests downward potentials. On downside, the immediate support is 131.60, break below this level will open the gate to 130.40 area.
- DJI continued the advance, climbed from the intraday low 33440 area to intraday high 33820. It holds near the top and ended the week around 33785, up for the day and indicates bullish sign in the hourly chart. Right now market is standing above 20 and 50 SMA, suggests bullish strength. Meanwhile, 20 SMA continued accelerating north and developing above longer ones, suggests bulls not exhausted yet. On upside, overcome 33850 may encourage bulls to challenge 34250, break above that level will open the gate to 34550.
- Technical indicators suggest the bullish movement. RSI stabilizes around 76, while the Momentum indicator stabilizes above the midline, suggests upward potentials. On downside, the immediately support is 33530, break below this level will open the gate for more decline to 33250 area.

- Brent continued the advance, jumped more than $5 per barrel after the Monday open due to OPEC+ output cut. It holds near the top and ended Monday around 85.05, up for the day and indicates bullish sign in the hourly chart. Meanwhile, the 20 SMA continued accelerating north and developing far above 200 SMA, indicates bulls not exhausted yet. On upside, overcome 87.00 may encourage bulls to challenge 89.00, break above that level will open the gate to 91.00.
- Technical indicators also suggest bullish movement, hovering above the midline. RSI stabilizes at 67, while the Momentum indicator stabilizes in positive territory, suggests upward potentials. On downside, the immediately support is 83.50, break below this level will open the gate for more decline to 80.00 area.