03/04/2023 Daily Reports
- The Euro drops from around weekly highs of 1.0925 on a buoyant US Dollar and on buyers’ failure to crack the YTD high at 1.0929. Nevertheless, a triple bottom in the daily chart is intact, at the brisk of being negated. At the time of writing, the EUR/USD is trading at 1.0838.
- The Core Personal Consumption Expenditures Price Index rose 0.3% in February, less than the 0.4% of market consensus to an annual rate of 4.6%, below the 4.7% of January. The PCE Price Index rose 0.3% in February and 5% YoY. The same report showed that Personal income grew by 0.3%, above the 0.2% expected while Personal Spending rose by 0.5%, surpassing consensus of 0.3%. In the Eurozone, the Harmonised CPI came in softer at 6.9% YoY in March, down from 8.5%, below expectations of a drop to 7.1%. The Core CPI steadied at 5.7% YoY.
- The EUR/USD pair is trading near the 1.0838, down for the day with bullish stance in daily chart. The pair stabilized above 20 and 50 SMA, indicates bullish strength. Meanwhile, the 20 SMA continued accelerating north and heading towards 50 and 200 SMA, suggests bulls not exhausted yet. On upside, the immediate resistance is 1.0930, break above this level will extend the advance to 1.1030.
- Technical readings in the daily chart support the bullish stance. The RSI indicator stabilizes around 58. The Momentum indicator holds above the midline, indicating bullish potentials. On downside, the immediate support is 1.0820 and below this level will open the gate to 1.0700.

- The Pound Sterling traded with decent losses in the mid-North American session, pressured by a resurgence of the US Dollar, trimming its Thursday’s losses. Although inflation data could spur a pivot in the US Fed policy stance, market participants buy the US Dollar as the weekly, monthly, and quarter-end looms. At the time of writing, the GBP/USD is trading at 1.2330.
- US economic data from the Department of Commerce revealed that the Fed’s favourite inflation gauge, the core PCE rose 4.6% YoY, beneath forecasts and a prior’s month reading of 4.7%. Headline inflation was 5%, beneath January’s 5.3%, signalling that the cumulative tightening by the Fed continues to temper inflation. On the UK front, the economy expanded by 0.1% in Q4 2022, and by 0.6% YoY, according to data from the Office for National Statistics.
- The GBP/USD offers bullish stance in daily chart. Cable stabilizes above 20 and 50 SMA, indicating bullish strength in short term. Meanwhile, the 20 SMA continued accelerating north and heading towards longer ones, suggests bulls not exhausted yet. On upside, the immediate resistance is 1.2450 with a break above it exposing to 1.2550.
- Technical readings in the daily chart support the bullish stances. RSI indicator stabilizes around 58, while the Momentum indicator stabilizes above the midline, suggesting upward potentials. On downside, the immediate support is 1.2280, unable to defend this level will resume the decline to 1.2170.


- Gold price pulls back from its highs on Friday, exchanging hands in the $1,970s at time of writing, as the dust settles after the release of lower-than-expected Core Personal Consumption Expenditure – Price Index data from the US.
- The preliminary PCE price index data out on Friday showed a slight decline to 4.6% YoY in February when 4.7% had been expected, the same as January. On a monthly basis inflation rose 0.3% versus 0.4% forecast from 0.5% previously. The market response has been for US Treasury yields to pull back, the US Dollar to edge down, with the result that Gold price popped higher. The lower-than-expected inflation data raises the chances the Fed will do nothing at its May meeting and perhaps even that it may actually cut rates later in the year. Lower interest rates favour Gold because they reduce the opportunity cost of holding the precious metal vis-a-vis cash or cash equivalents.
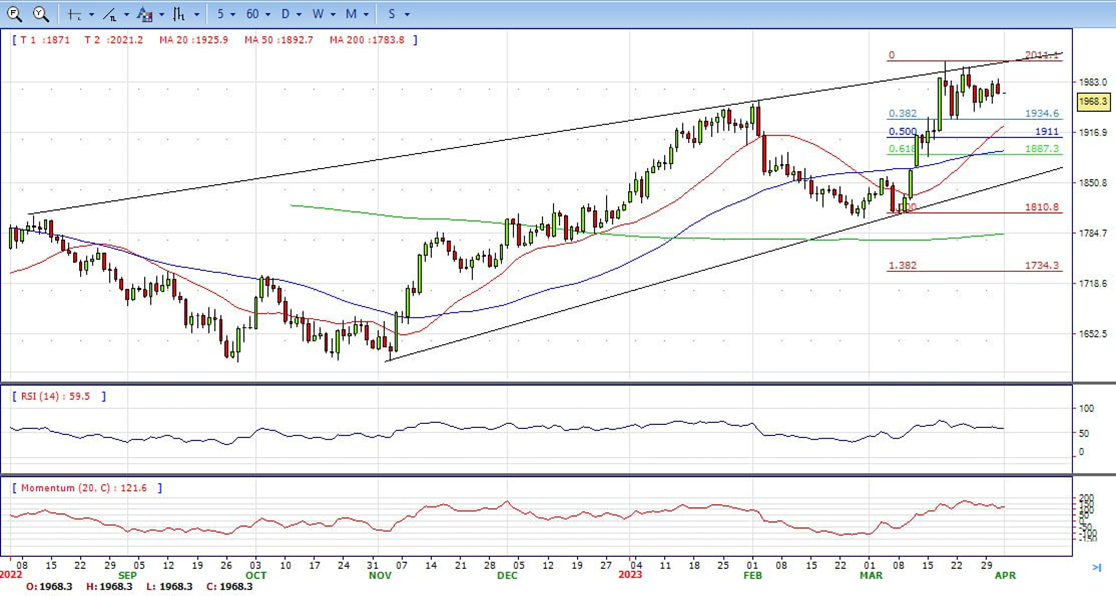
- Gold price stabilized around 1968, down for the day and bullish in the daily chart. The gold price still stabilizes above all main SMAs, suggesting bullish strength in short term. Meanwhile, the 20 continued accelerating north and continued developing far above 200 SMA, indicates bulls not exhausted yet. On upside, the immediate resistance is 2010, break above this level will open the gate for more advance to 2040 area.
- From a technical perspective, the RSI indicator holds above the mid-line and stabilizes around 59, on a bullish strength. The Momentum indicator hold in the positive territory, suggests upward potentials. On downside, the immediate support is 1934, below this area may resume the decline to 1919.


- The USD/JPY pair surrenders a major part of its intraday gains to a two-week high and retreats below the 133.00 round-figure mark during the late of North American session on Friday.
- The modest intraday US Dollar uptick loses steam after the US Bureau of Economic Analysis reported that the Personal Consumption Expenditures Price Index decelerated to a 5% YoY rate in February from 5.3% previous. Adding to this, the Core PCE Price Index – the Fed’s preferred inflation gauge – unexpectedly edged lower to a 4.6% YoY rate from 4.7% in January. The data adds to the uncertainty about the Fed’s rate-hike path, which acts as a headwind for the Greenback and prompts some intraday selling around the USD/JPY pair. Friday’s US economic docket also features the release of the Chicago PMI and revised Michigan Consumer Sentiment Index, though might do little to provide any meaningful impetus. Nevertheless, the USD/JPY pair still seems poised to register weekly gains for the first time in the previous five and remains at the mercy of the USD price dynamics heading into the weekend.
- The USD/JPY pair stabilized around 132.85, slightly up for the day and bearish in the daily chart. The price still stabilizes below 20 and 50 SMA, suggests bearish strength in short term. Meanwhile, 20 SMA continued accelerating south and heading towards 50 SMA, indicating bears not exhausted. On upside, overcome 133.80 may encourage bulls to challenge 135.10, break above that level will open the gate to 137.00.
- Technical indicators suggest the neutral to bearish strength. RSI stabilizes around 50, while the Momentum indicator stabilizes below the midline, suggests downward potentials. On downside, the immediate support is 131.60, break below this level will open the gate to 130.40 area.

- DJI continued the advance, climbed from the intraday low 33000 area to intraday high 33530. It holds near the top and ended the week around 33520, up for the day and indicates bullish sign in the hourly chart. Right now market is standing above 20 and 50 SMA, suggests bullish strength. Meanwhile, 20 SMA continued accelerating north and developing above longer ones, suggests bulls not exhausted yet. On upside, overcome 33600 may encourage bulls to challenge 33900, break above that level will open the gate to 34250.
- Technical indicators suggest the bullish movement. RSI stabilizes around 85, while the Momentum indicator stabilizes above the midline, suggests upward potentials. On downside, the immediately support is 33120, break below this level will open the gate for more decline to 32860 area.

- Brent continued the advance, traded from intraday low 77.80 area to intraday high 79.85. It holds near the top and ended the week around 79.85, up for the day and indicates bullish sign in the hourly chart. Meanwhile, the 20 SMA continued accelerating north and developing far above 200 SMA, indicates bulls not exhausted yet. On upside, overcome 80.00 may encourage bulls to challenge 81.70, break above that level will open the gate to 83.50.
- Technical indicators also suggest bullish movement, hovering above the midline. RSI stabilizes at 66, while the Momentum indicator stabilizes in positive territory, suggests upward potentials. On downside, the immediately support is 78.40, break below this level will open the gate for more decline to 77.10 area.