04/01/2023 Daily Reports
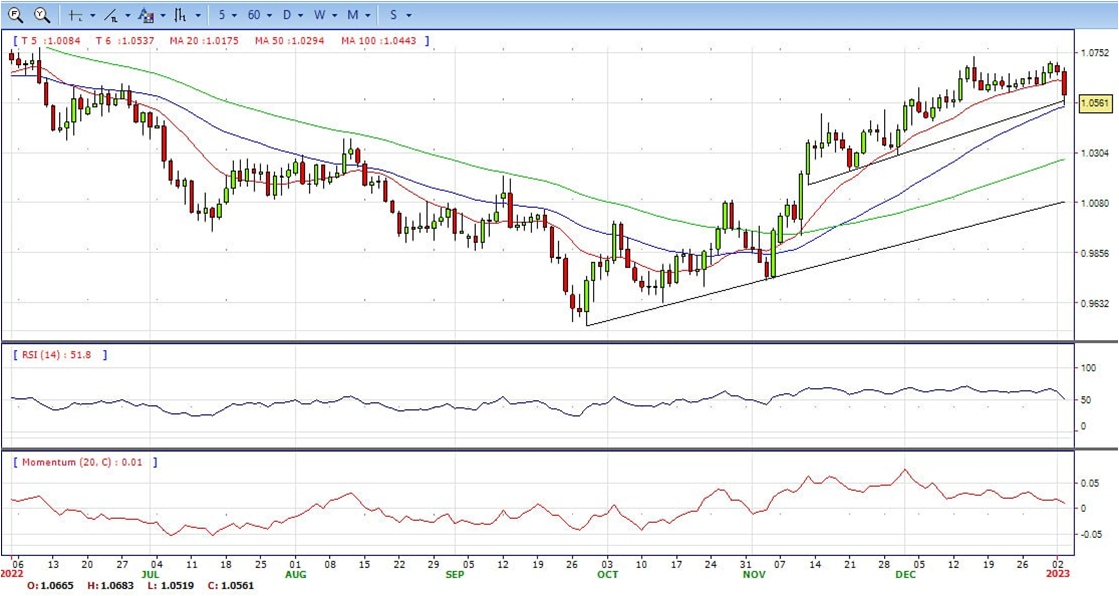
- EUR/USD declined sharply in the early European session and touched its lowest level in three weeks at 1.0520 before staging a modest rebound. As of writing, the pair was trading at 1.0560, where it was still down nearly 1% on a daily basis.
- The renewed US Dollar strength earlier in the day weighed heavily on EUR/USD. The risk-positive market environment, however, helped the pair limit its losses for the time being. At the time of press, US stock index futures were up between 0.4% and 0.8% on the day, pointing to a positive opening in Wall Street’s main indexes.
- In the meantime, the data from Germany revealed on Tuesday that inflation, as measured by the Consumer Price Index (CPI), declined to 8.6% on a yearly basis in December from 10% in November. This reading came in below the market expectation of 9% and made it difficult for the Euro to gather recovery momentum.
- S&P Global’ s December Manufacturing PMI will be the only data featured in the US economic docket and it is expected to come in at 46.2, matching the flash estimate. The US Dollar’s valuation is likely to continue to drive EUR/USD’s action in the second half of the day with American investors returning from the three-day weekend.
- EUR/USD has breached the rising trendline support at 1.0630, with a daily closing below it awaited to confirm a symmetrical triangle breakdown. The 14-day Relative Strength Index (RSI) has dipped sharply toward the 50.00 level from around 70.00, justifying the latest downtick. On the other side, EUR/USD needs to recapture the 21DMA support-turned-resistance to attempt a tepid bounce. Further up, the triangle support now resistance will come into play.
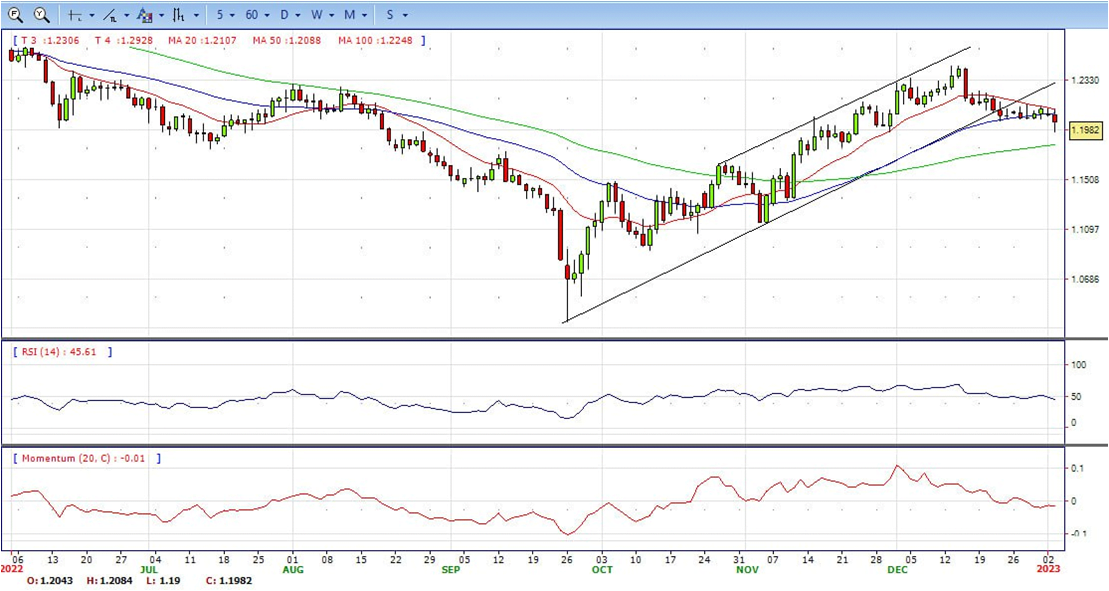
- The Pound Sterling (GBP) trimmed some of its earlier losses against the US Dollar (USD) after plunging to the 100-day Exponential Moving Average (EMA), hitting a daily low of 11899. Nevertheless, the bounce was short-lived, even though the GBP/USD climbed to the 1.2000 figure but remained negative in the day. At the time of writing, the GBP/USD is trading at 1.1985, below its opening price by 0.48%.
- On the UK front, Manufacturing PMI, revelated by S&P Global/CIPS, dropped to a 31-month low of 45.3, continuing its downtrend, as it trailed November’s 46.5. should be said that the index has remained below the 50 neutral mark for five consecutive months. Delving into the report, output, new orders, employment, and inventories, decelerated.
- Meanwhile, political jitters in the UK seem to be putting additional weight on the Pound Sterling. The Telegraph reported over the weekend that British Prime Minister Rishi Sunak had shelved the childcare reform that was designed to help parents save money and return to work. Additionally, the first of five consecutive days of national rail strikes have gone underway on Tuesday.
- The GBP/USD offers bearish stance as it fell below 20 and 50 SMA, indicating bear in short term. RSI indicator below 50, while the Momentum indicator stabilized below the midline, suggesting more downward potentials. On downside, the immediate support is 1.1900, unable to defend this level will resume the decline to 1.1800.


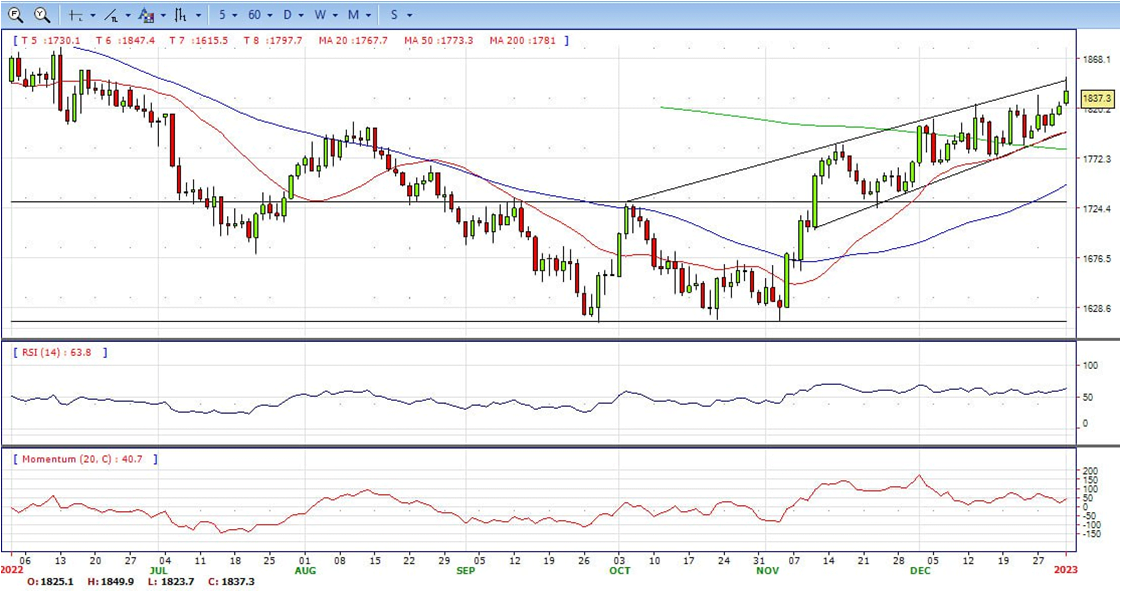
- Gold prices are having a volatile session on Tuesday after resuming normal trading activity. Earlier XAU/USD peaked at $1,849.99, a level last seen back in May, and then started to pullback, finding support at $1,830. Before Wall Street’s opening bell it is hovering slightly below $1,840.
- The key driver in Gold’s correction was a rally of the US Dollar against G10 currencies. The DXY is off highs, up by 1%. Now it is retreating across the board, favoring the bounce back to the upside in the yellow metal.
- Economic data released on Tuesday showed inflation slowed in Germany in December more than expected. German bond yields are falling with the 10-year yield down by almost 3% at 2.36%, far from the 2.57% of last week. US yields are also lower with the 10-year at 3.74%. The decline in yields and the rebound in risk appetite during the last hours, offered support to Gold prices and a modest boost back to the $1,840 area. S&P futures are up by 0.63%.
- Gold price has delivered a breakout of the Ascending Triangle chart pattern formed on a four-hour scale. The horizontal resistance of the aforementioned chart pattern is placed from December 13 high at $1,824.55 while the upward-sloping trendline is plotted from December 16 low at $1,774.36.
- From a technical perspective, Advancing 20-and 50-period Exponential Moving Averages (EMAs) at $1,820.00 and $1,812.07 respectively add to the upside filters. Meanwhile, the Relative Strength Index (RSI) (14) has shifted into the bullish range of 60.00-80.00 from the 40.00-60.00 range, which indicates more upside ahead.


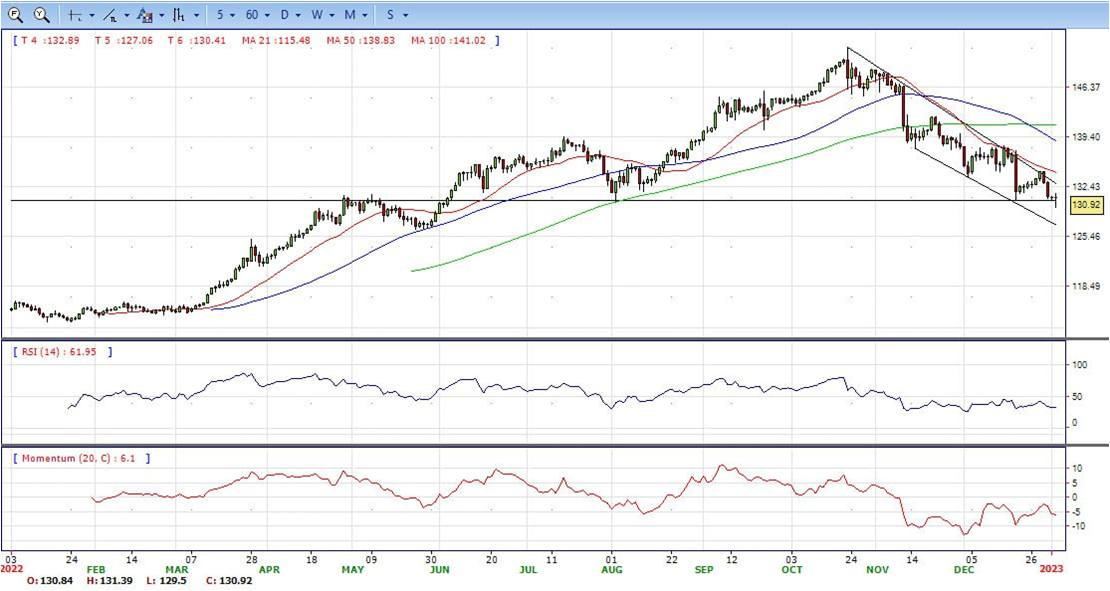
- USD/JPY reversed its direction and sharply rose toward 131.00 after having touched its lowest level since late May at 129.50 during the Asian trading hours. The pair, however, lost its bullish momentum and was last seen losing 0.25% on the day at 130.40.
- The sudden US Dollar strength in the European morning provided a boost to the pair on Tuesday. Earlier in the day, the Japanese yen gathered strength on growing expectations of a hawkish Bank of Japan (BOJ) policy shift. Over the weekend, Nikkei reported that the BOJ was considering raising its inflation forecasts for 2023 and 2024 in January.
- The BoJ is due to meet again this month, on January 18. Given the tweaks made to its yield curve-control policy last month, there is a greater sense of anticipation that further adjustments could be forthcoming between now and the end of Governor Kuroda’s tenure in April and potentially as soon as this month. In the past 5 days, the JPY has appreciated by over 2% vs. the USD suggesting that the speculators are already positioning for a more hawkish outcome from the BoJ later this month. Implied market rates are pointing to a rate hike from the BoJ into positive territory within a 6 month view. Before it raises rates, however, the BoJ could first inject greater flexibility into its YCC policy. The market is likely to be disappointed if BoJ policy makers offer nothing new on the policy front this month
- USD/JPY has already fallen back substantially since its highs near 151.95 in late October. This factor combined with the still hawkish Fed is likely to limit to extent of further near-term downside in the currency pair. That said, the currency pair is currently trading close to near-term support at the May low of 130.41. A close below would open up scope for a fall to the May low around 126.36
- Technical indicators also suggest the bearish strength. RSI stabilized around 33, while the Momentum indicator continued developing below the midline, suggests downward potentials.
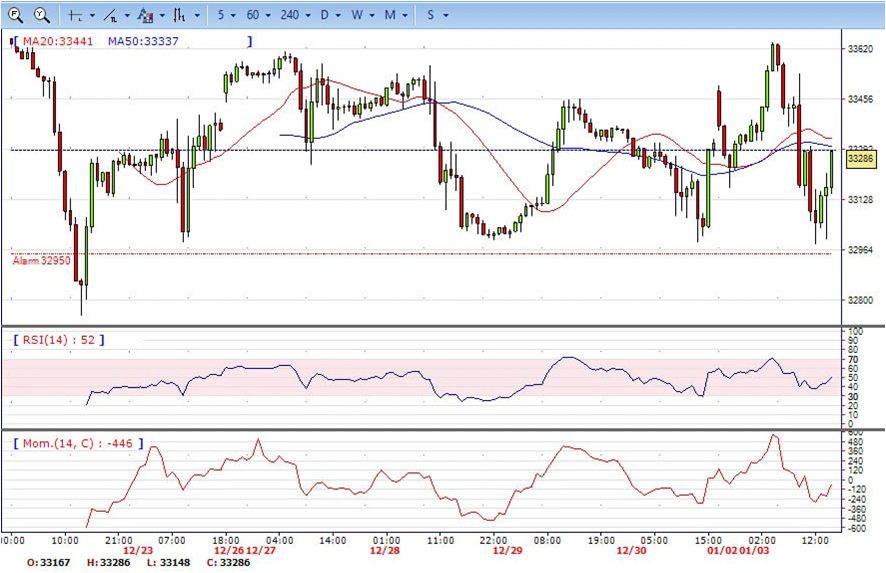
- DJI under the sell pressure, tumbled from intraday high 33450 area to low 32988. It rebound lately and surged to 33280 area at the end of the day, slight down for the day and bullish in the daily chart. The price stabilize around 20 and 50 SMA, suggest neutral in short term. Meanwhile, 20 SMA started turning flat but continued trading above 50 SMA, suggest bulls not exhausted yet. On upside, overcome 33300 may encourage bulls to challenge 33650, break above this level will open the gate to 34000.
- Technical indicators suggest the neutral condition. RSI stabilize at around 50, while the Momentum indicator stabilize around 0, On downside, the immediate support is 33000, break below this level will open the gate for more decline to 32850 area.
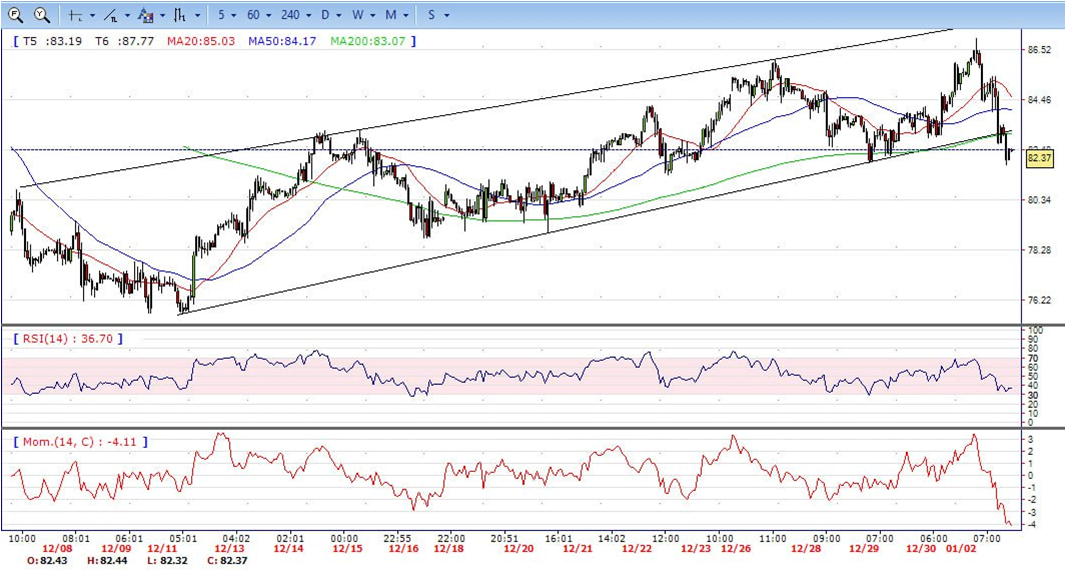
- The Brent Oil tank more than 3% on Tuesday, due to increased concerns of diminishing demand from China, as the country battles spurring Covid-19 cases amidst increasing worries for a worldwide recession. At the time of writing, Brent is trading at 82.35 per barrel.
- Brent halted its upward trend and fell below both 20 and 50, also short term trendline breach from hourly chart suggest a bearish sign. Technical indicators suggest the bearish movement. RSI slip below 50 and stay at 40, while the Momentum indicator sharply fell to negative territory, suggest downwards potentials. On downside, the immediate support is 81.80, break below this level will open the gate for more decline to 81.30 area.