EUR/USD
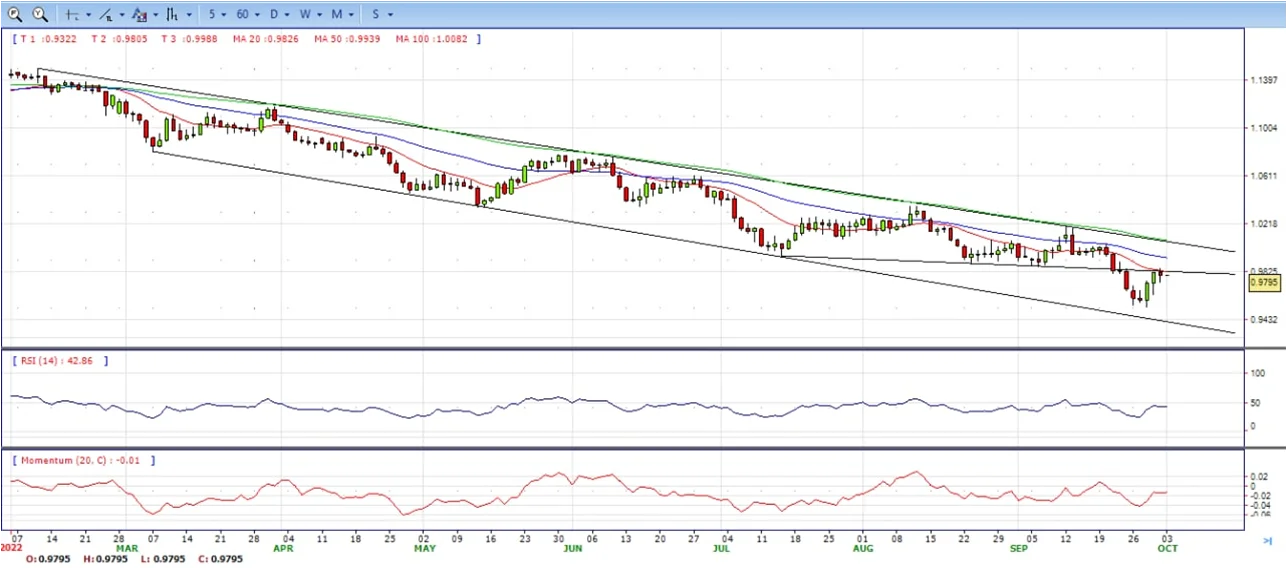
- The EUR/USD retraces from daily highs of around 0.9853 due to Fed officials expressing the necessity of higher rates for longer. The pair ended Friday around 0.9800, still bearish in the daily chart.
- A bunch of Fed policymakers crossing news wires, led by Vice-Chair Lael Brainard, expressed that the Fed needs to keep interest rates higher-for-longer, so the bank can attain its goal. She added that the Fed would not pull back prematurely while echoing other colleagues’ expression of not knowing where rates would peak. Later in the same tone, San Francisco’s Mary Daly commented that further hikes were coming and that the Fed is “resolute” in taming inflation.
- Aside from this, the US Commerce Department revealed that the US Federal Reserve’s favorite measure of inflation, known as the PCE, increased more than estimated in August, at a 0.3% MoM pace, 6.2% YoY, while core PCE, which excludes volatile items, accelerated at a 0.6% MoM, up 4.9% YoY.
- The EUR/USD pair is trading near the 0.9800, unchanged for the day with the bearish stance in daily chart. The pair still stabilized below 20 and 50 SMA, indicates bearish strength. Meanwhile, 20 SMA continued accelerating south and developing below longer ones, suggests bears not exhausted yet. On upside, the immediate resistance is 0.9830, break above this level will extend the advance to 0.9920.
- Technical readings in the daily chart support the bearish stances. The RSI indicators hovering below the midlines and stabilized around 43, shows bearish strength. The Momentum indicator stabilized below the midline, indicating downward potentials. On downside, the immediate support is 0.9700 and below this level will open the gate to 0.9630.
Open A Demo
CDO has wide range of tools, professional and friendly support for clients to achieve their financial markets trading goals. Open a live account now to enjoy this experience with virtual deposit.
GBP/USD
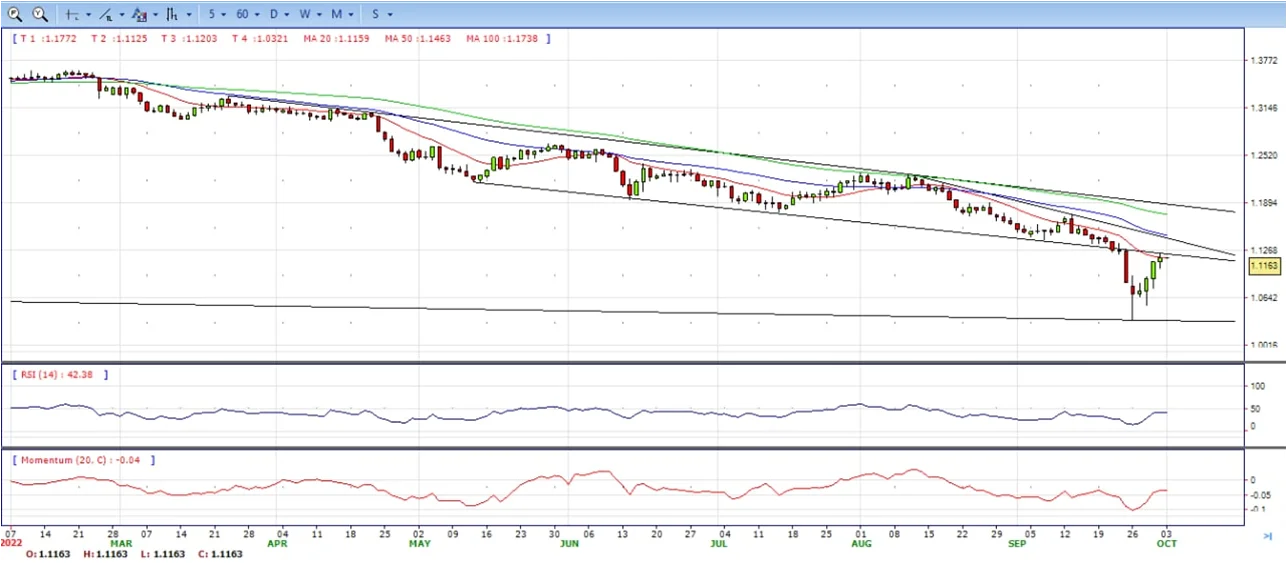
- The GBP/USD is recovering from earlier losses as the North American session progresses, even though the market sentiment shifted sour as Fed officials reinforced their “hawkish” message of keeping interest rates higher for longer. Therefore, the pair ended Friday at 1.1168, gaining 0.46%, after reaching a daily low of 1.1024..
- The US Department of Commerce revealed that the Federal Reserve preferred inflation measure, the PCE, rose by 0.3% MoM in August, above estimates of 0.1%, while the annual reading decelerated from 6.3% to 6.2%. In the meantime, the so-called Core PCE, which strips volatile items like food and energy, exceeded estimates at 0.6% MoM, while the YoY rose by 4.9%, also above forecasts.
- On the Uk side, the British pound has recovered from reaching 1.0300 levels on a YTD low last Friday, courtesy of new Primer Minister Liz Truss’ tax-cutting plans to stimulate the economy. That triggered one of the most volatile sessions, sending the GBP/USD tumbling from daily highs of 1.0900 to 37-year lows of 1.0356.
- The GBP/USD still offers bearish stance in daily chart, it maintains the downward slope and now is stabilized below all main SMAs, indicating bearish strength. Meanwhile, the 20 SMA continued accelerating south and developing far below longer ones, suggesting bears not exhausted yet. On upside, The immediate resistance is 1.1230 with a break above it exposing to 1.1370.
- Technical readings in the daily chart support the bearish stances. RSI indicator stabilized around 42, while the Momentum indicator stabilized below the midline, suggesting downward potentials. On downside, the immediate support is 1.1020, unable to defend this level will resume the decline to 1.0900.
XAU/USD
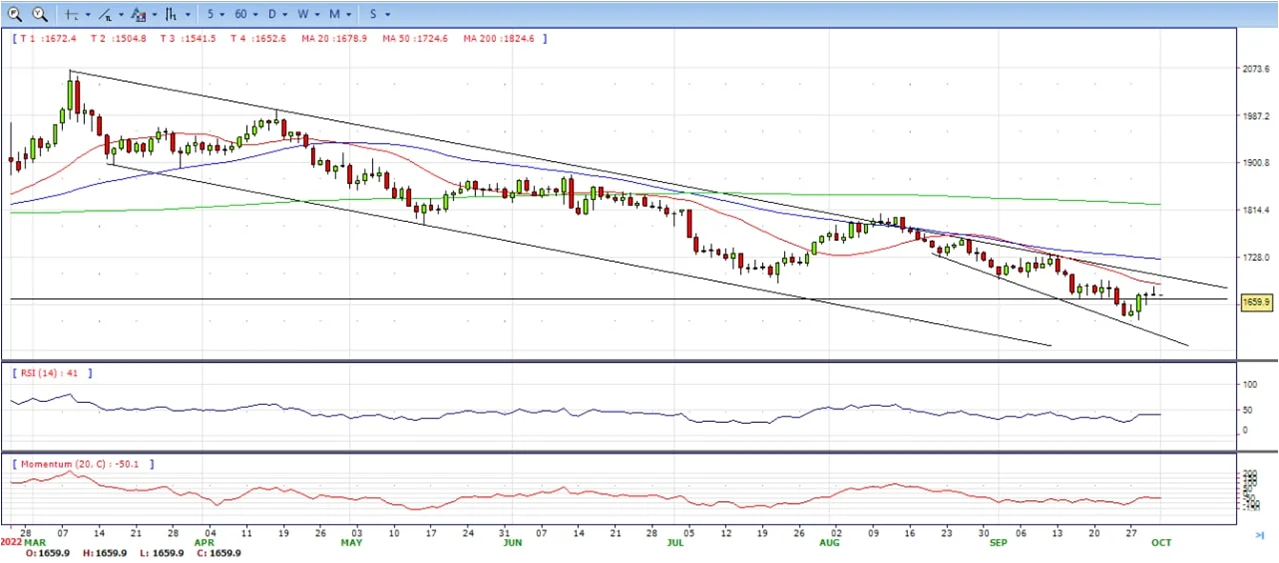
- Gold surrenders a major part of its intraday gains to a fresh weekly high touched earlier this Friday and retreats below the $1,660 level during the early North American session, still bearish in the daily chart.
- Despite growing recession fears and geopolitical risk, the safe-haven XAU/USD has been struggling to gain any meaningful traction amid the Federal Reserve’s commitment to getting inflation under control. Investors seem convinced that the US central bank will stick to its aggressive rate hiking cycle and have been pricing in the possibility of another supersized 75 bps rate hike in November.
- Apart from this, resurgent US dollar demand turns out to be another factor exerting additional downward pressure on the dollar-denominated commodity. In fact, the USD Index, which measures the greenback’s performance against a basket of currencies, stages a solid recovery from the weekly low and for now, seems to have stalled this week’s sharp pullback from a two-decade high.
- Gold price stabilized around 1660, unchanged for the day and bearish in the daily chart. The gold price still stabilized below all main SMAs, suggesting bearish strength. Meanwhile, the 20 SMA continued accelerating south and developing below longer ones, indicating bears not exhausted yet. On upside, the immediate resistance is 1675, break above this level will open the gate to extend the advance to 1688 area.
- From a technical perspective, the RSI indicator hold below the midline and stabilized around 41, suggesting bearish strength. The Momentum indicator struggled below the midline, suggests bearish potentials. On downside, the immediate support is 1640, below this area may resume the decline to 1615.

CDO TRADER
CDO TRADER, our cutting-edge trading platform, follows the technology from the forefront with new features added continuously. Moreover, CDO TRADER is now available for Android and iOS! So it allows you to trade on the go!
USD/JPY
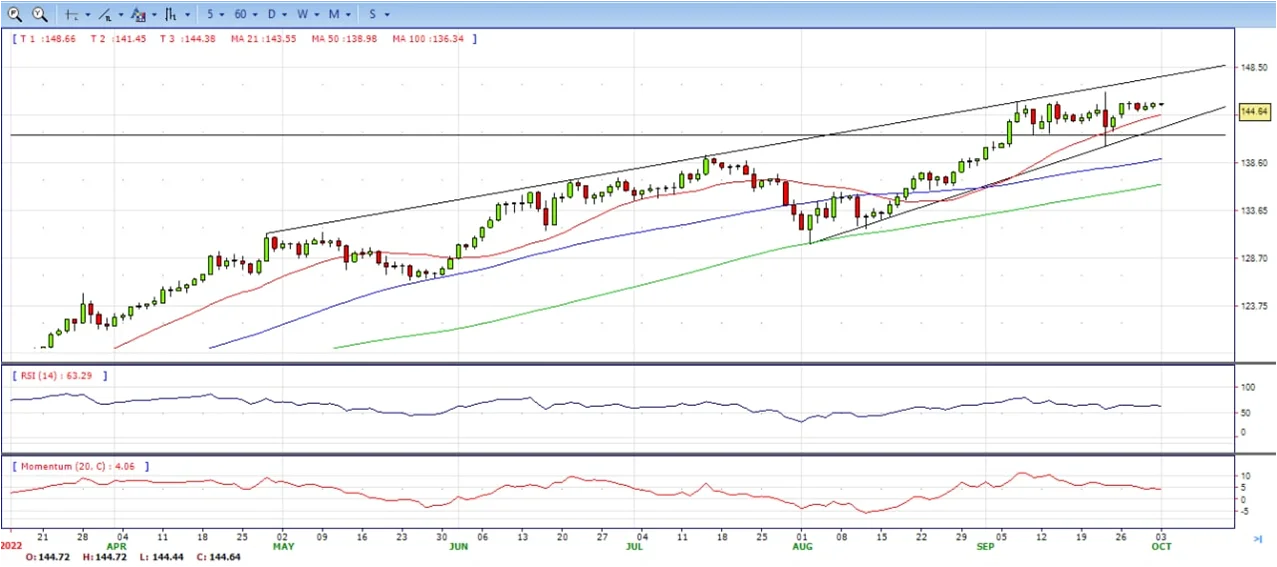
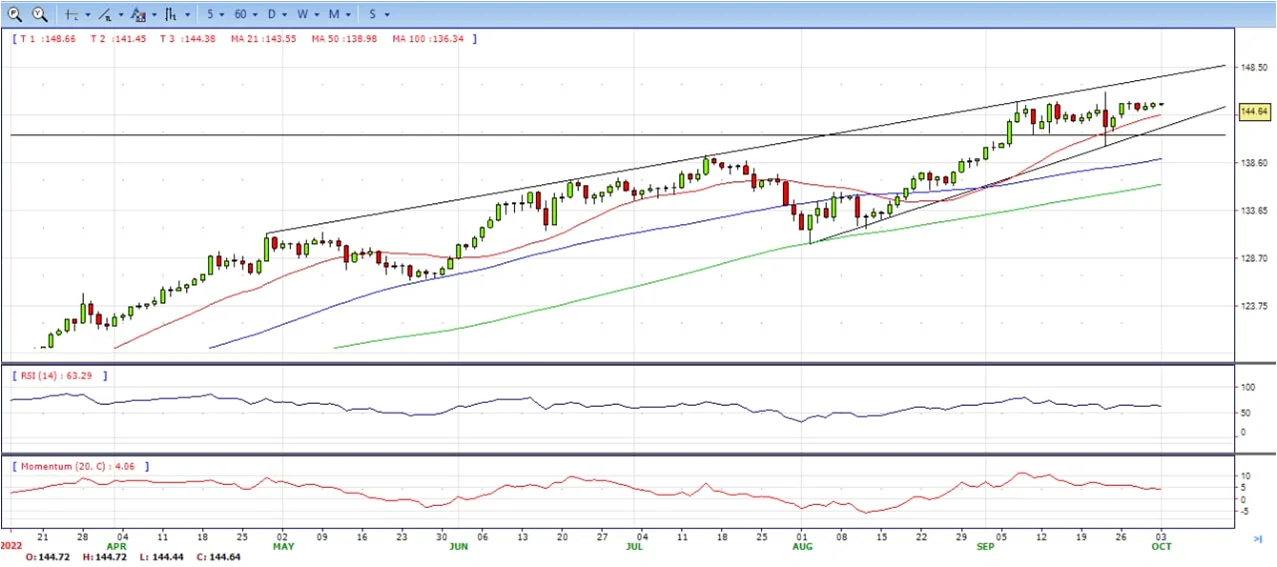
- The USD/JPY consolidates in the 144.00-145.00 area following last week’s Bank of Japan (BoJ) intervention, which had kept the major directionless, as traders remain on the sidelines.
- The US dollar surrenders its modest intraday gains and languishes near the weekly low amid a further pullback in the US Treasury bond yields, which, in turn, acts as a headwind for the USD/JPY pair. The UK debt market seems to have stabilized following the Bank of England’s intervention for the second day on Thursday. The spillover effect drags the benchmark 10-year US Treasury note away from a 12-year high set earlier this week and weighs on the greenback.
- The Japanese yen, on the other hand, draws support from mostly upbeat macro releases. In fact, official data showed that Industrial Production rose 2.7% in August from the prior month, surpassing estimates. A separate reading revealed that Japanese retail sales grew more than anticipated during the reported month. Furthermore, the unemployment in Japan edged down to 2.5% from the 2.6% previous, matching expectations and underpinning the domestic currency.
- The USD/JPY pair stabilized around 144.70, up for the day and bullish in the daily chart. The price still maintains the upward slope and stabilized above all main SMAs, suggests bullish strength. Meanwhile, 20 SMA continued accelerating north and developing above longer ones, indicating bulls not exhausted in the long term. On upside, overcome 145.00 may encourage bulls to challenge 146.00, break above that level will open the gate to 147.00.
- Technical indicators suggest the bullish strength. RSI stabilized around 62, while the Momentum indicator continued developing above the midline, suggests upward potentials. On downside, the immediate support is 143.00, break below this level will open the gate to 140.30 area.
MetaTrader 4
MT4 has user friendly interface that is providing simplicity and efficiency. The traders can perform trading strategies for different products like Forex and CFD. MetaTrader 4 has over 50 built-in indicators, also it’s the tool that predicts trends and defines the appropriate entry and exit points.

DJI
- DJI under the strong sell pressure, tumbled from 29550 strong resistance region to low 28755. It hold near the bottom to ended the week, still bearish in the hourly chart. It stabilized below 20 and 50 SMA, suggests bearish strength. Meanwhile, the 20 SMA started turning south and heading towards longer ones, suggesting bears not exhausted yet. On upside, overcome 29000 may encourage bulls to challenge 29200, break above this level will open the gate to 29400.
- Technical indicators suggest the bearish strength. RSI stabilized around 26, while the Momentum indicator stabilized in negative territory, suggests downward potentials. On downside, the immediate support is 28700, break below this level will open the gate for more decline to 28500 area.
BRENT
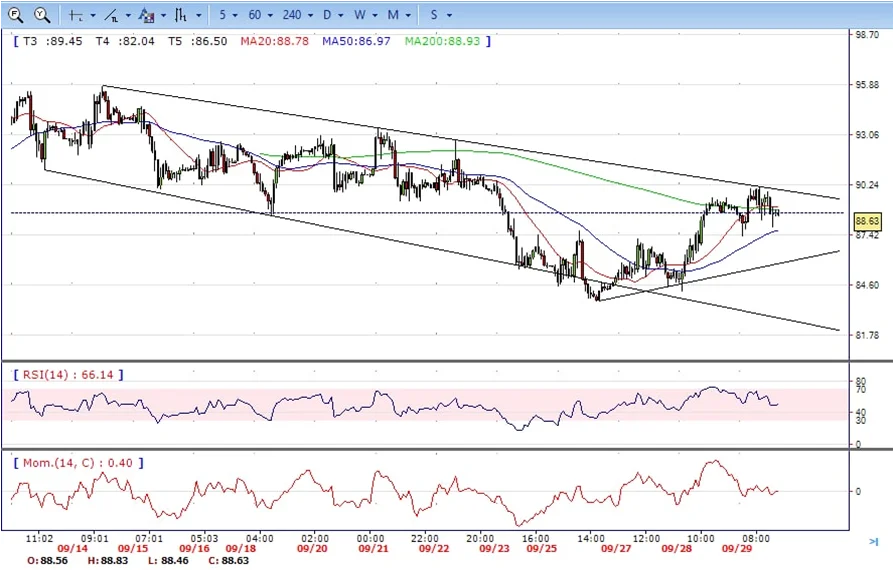
- Brent still under the sell pressure, retreated from 88.64 high to low 85.00 region. It ended the week near the bottom and still bearish in the hourly chart. The price stabilized below 20 and 50 SMAs, suggests bearish strength in short term. Meanwhile, the 20 SMA continued accelerating south and developing below longer ones, indicating bears not exhausted yet. On upside, overcome 86.50 may encourage bulls to challenge 87.50, break above this level will open the gate to 88.70.
- Technical indicators suggest the bearish movement, hovering below the midline. RSI stabilized around 32, while the Momentum indicator stabilized in negative territory, suggests downward potentials. On downside, the immediate support is 85.00, break below this level will open the gate for more decline to 83.50 area.
Contact Us
Please, fill the form to get an assistance.


