EUR/USD
- The EUR/USD recovered from earlier losses that dragged the pair towards its daily low of 1.0962 and is trading at around the 1.1020s area after inflation in the US proved to be stickier than expected, warranting further tightening by the Fed.
- Wall Street prints solid gains in the mid-day of the New York session. The US Department of Commerce revealed that the Fed’s preferred gauge for inflation, the core Personal Consumption Expenditure (PCE) in March, rose by 4.6%, unchanged from February’s data. Therefore, further tightening is expected by the Federal Reserve, even though the headline figure slowed to 0.1% MoM less than the prior’s month 0.3%, and the annual figures slowed from 5.1% to 4.2%.
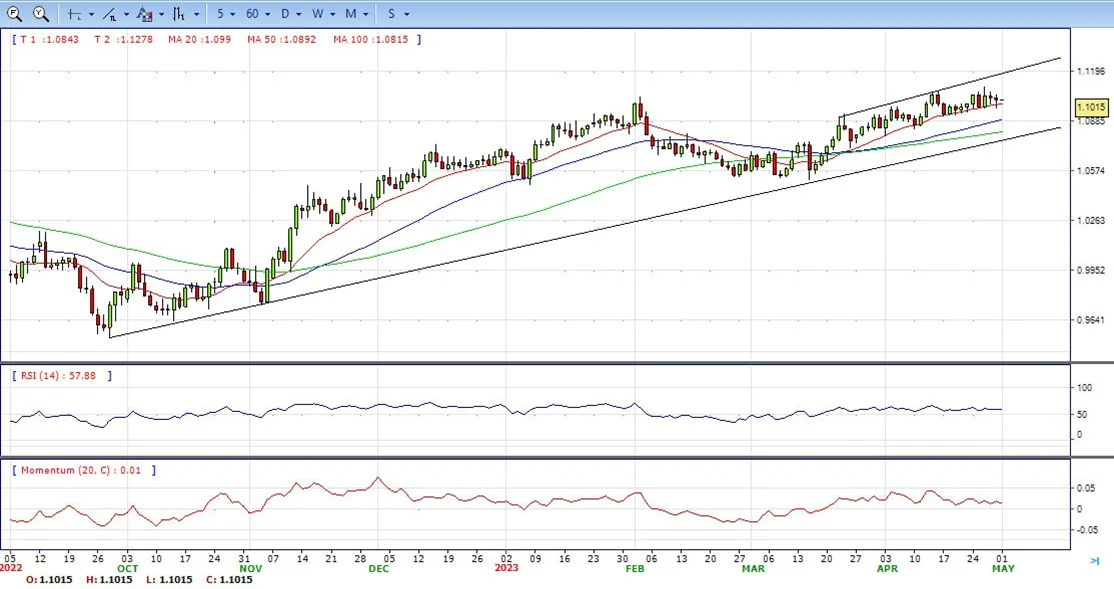
- The EUR/USD pair is trading near the 1.1015, slightly down for the day with bullish stance in daily chart. The pair stabilized above 20 and 50 SMA, indicates bullish strength. Meanwhile, the 20 SMA continued accelerating north and heading towards 50 and 200 SMA, suggests bulls not exhausted yet. On upside, the immediate resistance is 1.1100, break above this level will extend the advance to 1.1180.
- Technical readings in the daily chart support the bullish stance. The RSI indicator stabilizes around 59. The Momentum indicator holds above the midline, indicating bullish potentials. On downside, the immediate support is 1.0960 and below this level will open the gate to 1.0900.
Open A Demo
CDO has wide range of tools, professional and friendly support for clients to achieve their financial markets trading goals. Open a live account now to enjoy this experience with virtual deposit.
GBP/USD
- The GBP/USD soared to fresh YTD highs at 1.2583 despite fundamental news from the US increasing the likelihood of a Federal Reserve 25 bps rate hike. Therefore, the GBP/USD is trading at 1.2561, above its opening price by 0.60%.
- The US Dollar retreats from a two-and-half-week-high touched this Friday in reaction to the softer US macro data, which, in turn, is seen lending some support to the GBP/USD pair. In fact, the US Bureau of Economic Analysis reported that the US Personal Consumption Expenditures (PCE) Price Index declined more-than-expected, to 4.2% on a yearly basis in March from 5.1% previous. The Core PCE Price Index (the Fed’s preferred inflation gauge), meanwhile, edged lower to 4.6% from 4.7%.
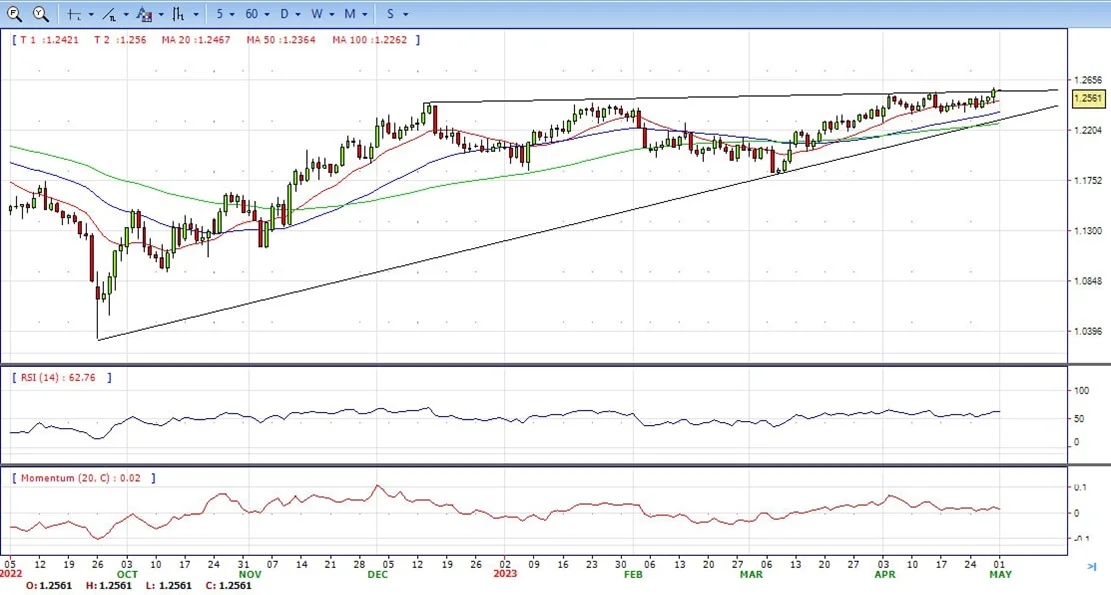
- The GBP/USD offers bullish stance in daily chart. Cable stabilizes above 20 and 50 SMA, indicating bullish strength in short term. Meanwhile, the 20 SMA continued accelerating north and developing far above longer ones, suggests bulls not exhausted yet. On upside, the immediate resistance is 1.2580 with a break above it exposing to 1.2670.
- Technical readings in the daily chart support the bullish stances. RSI indicator stabilizes around 62, while the Momentum indicator stabilizes above the midline, suggesting upward potentials. On downside, the immediate support is 1.2500, unable to defend this level will resume the decline to 1.2350.

CDO TRADER
CDO TRADER, our cutting-edge trading platform, follows the technology from the forefront with new features added continuously. Moreover, CDO TRADER is now available for Android and iOS! So it allows you to trade on the go!
XAU/USD
- Gold price registers minimal gains, as traders brace for the weekend, gains 0.16%% after data from the US showed that inflation remains at high levels, justifying the need for further tightening by the US Federal Reserve. After hitting a daily low of 1976.30, the XAU/USD is trading at $1989.6, barely changed for the day.
- US equities continued to climb. A report by the US Department of Commerce showed inflation in the United States had decelerated, with the Personal Consumption Expenditure (PCE) rate slowing from 5.1% to 4.2% in YoY readings. The monthly growth rate increased to 0.1%, below the prior month’s 0.3%. Despite this deceleration, the Fed’s preferred gauge for inflation, the core PCE, remained unchanged at 4.6% YoY, suggesting that inflationary pressures remain stickier than estimates. As a result, investors continued to believe that the Fed would raise rates.
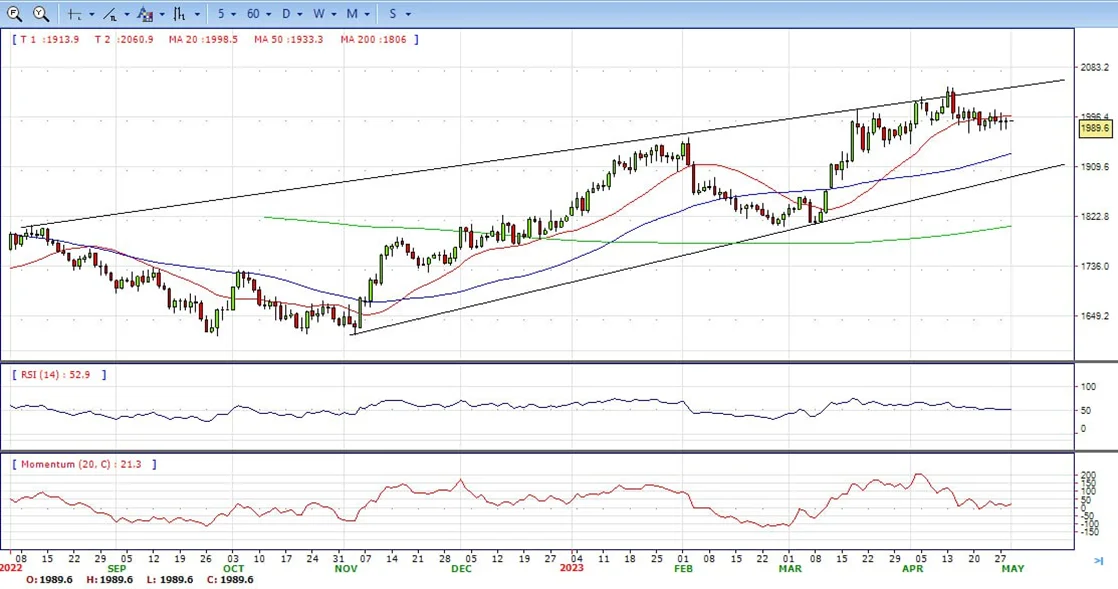
- Gold price stabilized around 1989, unchanged for the day and neutral to bullish in the daily chart. The gold price stabilizes below 20 SMA, suggesting bearish strength in short term. Meanwhile, the 20 SMA started turning flat but continued developing far above 50 and 200 SMA, indicates bulls not exhausted yet. On upside, the immediate resistance is 2015, break above this level will open the gate for more advance to 2032 area.
- From a technical perspective, the RSI indicator holds above the mid-line and stabilizes around 52, on a bullish strength. The Momentum indicator hold near the midline, suggests directionless potentials. On downside, the immediate support is 1969, below this area may resume the decline to 1950.
MetaTrader 4
MT4 has user friendly interface that is providing simplicity and efficiency. The traders can perform trading strategies for different products like Forex and CFD. MetaTrader 4 has over 50 built-in indicators, also it’s the tool that predicts trends and defines the appropriate entry and exit points.

USD/JPY
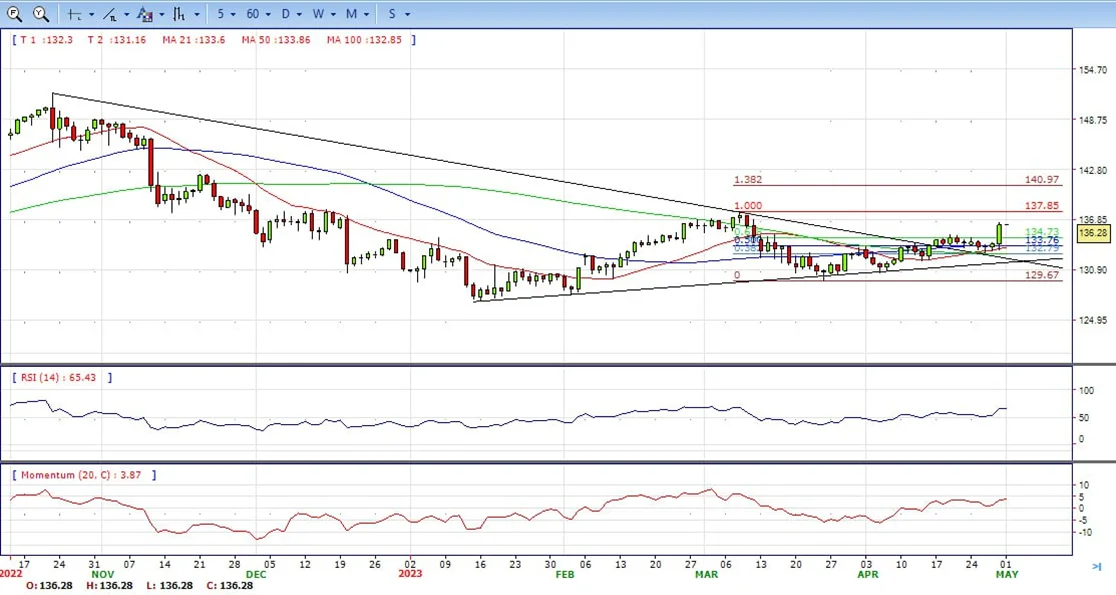
- The USD/JPY rose sharply after the first monetary policy decision by the Bank of Japan new Governor Kazuo Ueda struck a dovish tone, a greenlight for US Dollar buyers, against the Japanese Yen. Therefore, the USD/JPY extended its gains of more than 1.73%, trading at 136.27.
- The Japanese Yen turns out to be the worst-performing G10 currency on Friday in reaction to the Bank of Japan’s decision to leave its ultra-loose monetary policy settings unchanged. The Japanese central bank also made no tweaks to its yield curve control (YCC) by a unanimous vote, while the BoJ Governor sounded dovish during the post-meeting press conference. This, along with resurgent US Dollar demand, provides a goodish lift to the USD/JPY pair and further contributes to the intraday rally of over 300 pips.
- The USD/JPY pair stabilized around 136.28, up for the day and bullish in the daily chart. The price stabilizes above 20 and 50 SMA, suggests bullish strength in short term. However, 20 SMA started turning flat but continued developing below longer ones, indicating bears not exhausted. On upside, overcome 136.60 may encourage bulls to challenge 138.00, break above that level will open the gate to 140.00.
- Technical indicators suggest the bullish strength. RSI stabilizes around 64, while the Momentum indicator stabilizes above the midline, suggests upward potentials. On downside, the immediate support is 134.70, break below this level will open the gate to 133.00 area.
DJI
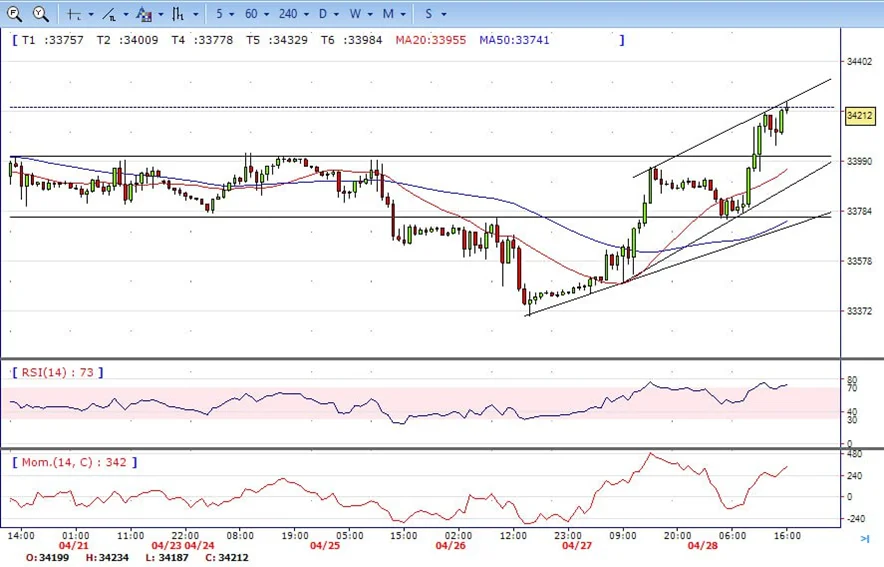
- DJI continued the strong rally on Friday, jumped from intraday low 33750 area to high 34234 level. It holds near the top in the last hour of US session and ended the day around 34210. Right now market is standing above 20 and 50 SMA, suggests bullish strength. Meanwhile, 20 SMA started turning north and heading towards longer ones, suggests bulls not exhausted yet. On upside, overcome 34280 may encourage bulls to challenge 34560, break above that level will open the gate to 34850.
- Technical indicators suggest the bullish movement. RSI stabilizes around 72, while the Momentum indicator stabilizes above the midline, suggests upward potentials. On downside, the immediately support is 34000, break below this level will open the gate for more decline to 33750 area.
BRENT
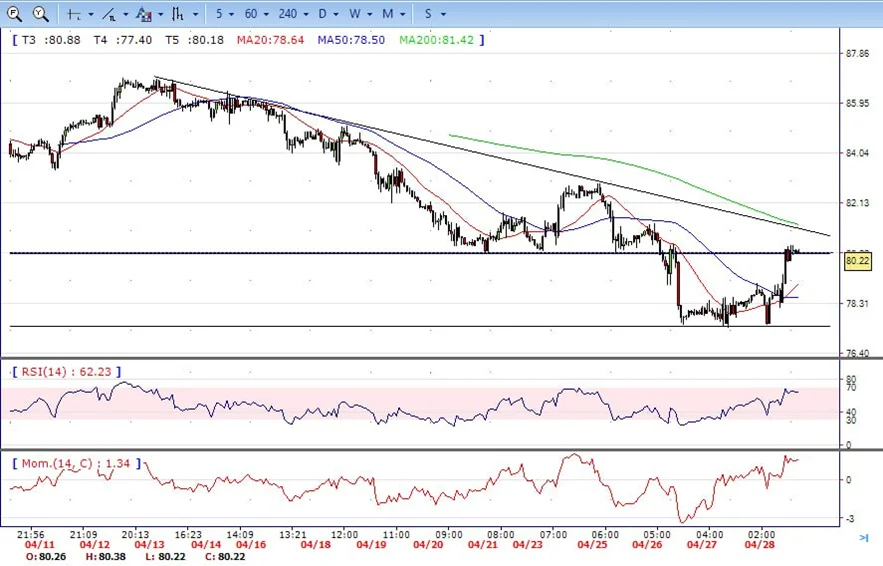
- Brent continued the advance, climbed from intraday low 77.50 to high 80.52. It holds near the top and ended the day around 80.20, up for the day and indicates bullish sign in the hourly chart. Meanwhile, the 20 SMA continued accelerating north and heading towards longer ones, indicates bulls not exhausted yet. On upside, overcome 80.50 may encourage bulls to challenge 81.40, break above that level will open the gate to 83.00.
- Technical indicators also suggest bullish movement, hovering above the midline. RSI stabilizes at 64, while the Momentum indicator stabilizes in positive territory, suggests upward potentials. On downside, the immediately support is 79.00, break below this level will open the gate for more decline to 77.40 area.
Contact Us
Please, fill the form to get an assistance.


