EUR/USD
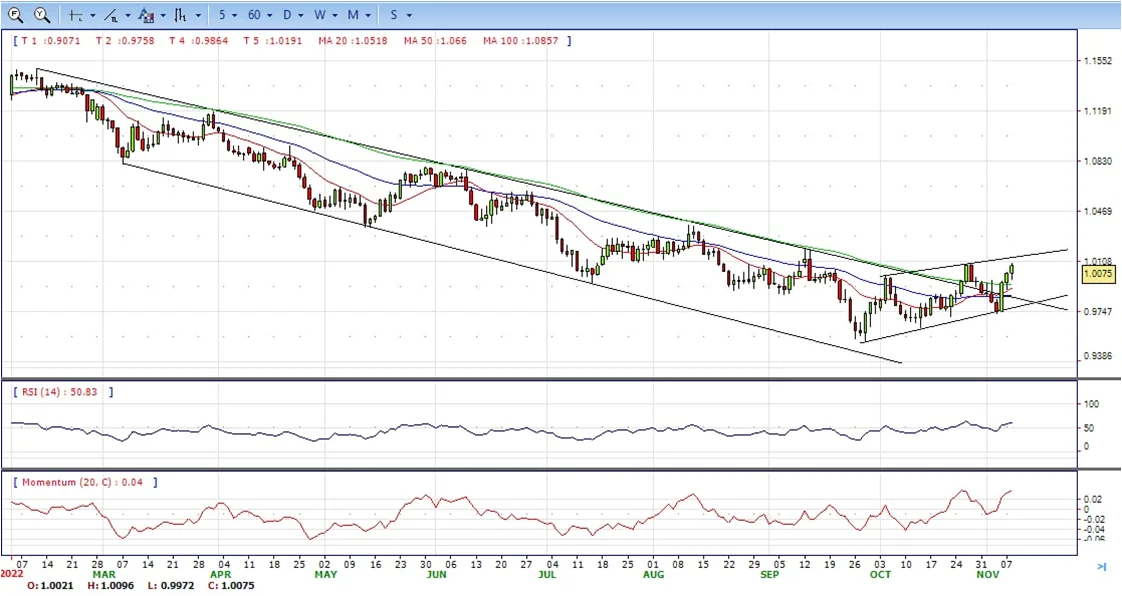
- EURUSD rallied in a broad risk-on setting, taking out the Monday highs for a fresh high for the week, eating into shorts from the prior. At the time of writing, the pair is ducking below 1.0096 highs into 1.0078 but remains a good 100 pips above the lows of the day.
- Investors cheered the prospects of gridlock in US politics as the US midterm election voting got underway with results expected later tonight in the US hours. Investors are hoping for a political gridlock that could prevent radical policy changes and for a slowdown in the pace of rate hikes from the Federal Reserve.
- As for the Fed, there were no officials slated during the midterm elections although there will be plenty to go on between speakers and data before the December 13-14 meeting. However, for this week, the US Consumer Price Index will be critical.
- The EUR/USD pair is trading near the 1.0076, up for the day with the neutral to bullish stance in daily chart. The pair stabilized above 20 and 50 SMA, indicates bullish strength. Meanwhile, the 20 SMA started turning north and heading towards longer ones, suggests bulls not exhausted yet. On upside, the immediate resistance is 1.0100, break above this level will extend the advance to 1.0200.
- Technical readings in the daily chart support the bullish stances. The RSI indicators hovering above the midlines and stabilized around 60. The Momentum indicator stabilized above the midline, indicating upward potentials. On downside, the immediate support is 0.9970 and below this level will open the gate to 0.9900.
Open A Demo
CDO has wide range of tools, professional and friendly support for clients to achieve their financial markets trading goals. Open a live account now to enjoy this experience with virtual deposit.
GBP/USD
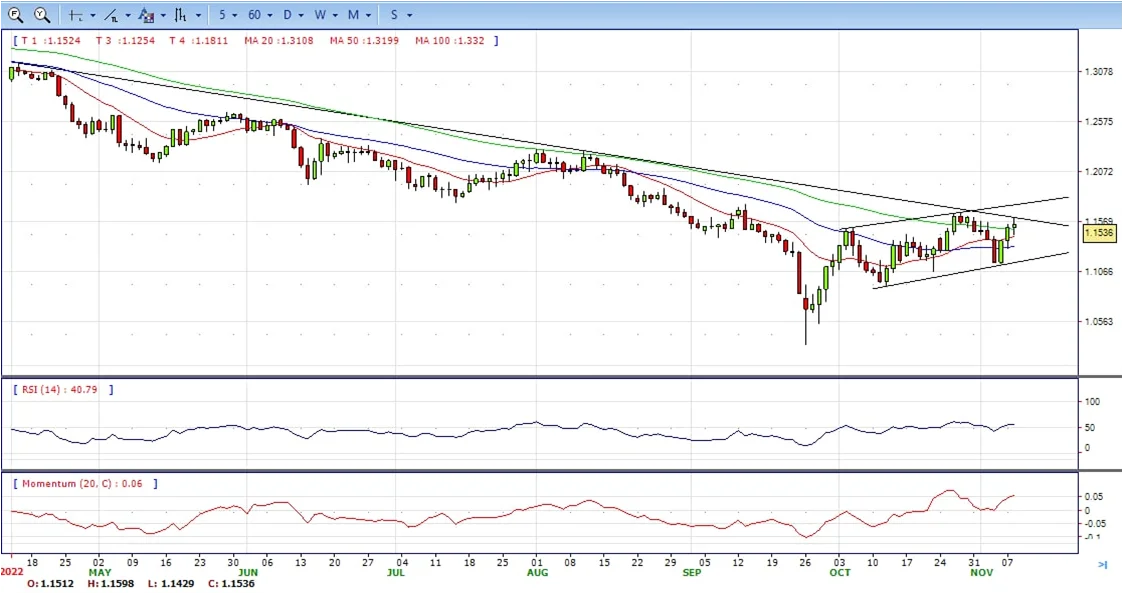
- The pound rushed higher during Tuesday’s US session, bouncing off the 1.1470 area to erase daily losses and session highs right below 1.1600 as the Americans head to the polls. The pair ended the day at around 1.1540, still bullish in the daily chart.
- The Greenback has dropped across the board in the US trading session, with US Treasury bond yields losing ground and Wall Street posting gains, with all eyes on the outcome of the US mid-term elections.
- A hitherto rangebound market has led to a significative US Dollar pullback as the first surveys started hinting at a Republican victory. This scenario might create a gridlock in the US Congress that would be welcomed by the market as it will hinder the approval of new regulations.
- The GBP/USD offers bullish stance in daily chart. Cable stabilized above 20 and 50 SMAs, indicating bullish strength in short term. Meanwhile, the 20 SMA started turning north and continued developing above 50 SMA, suggests bulls not exhausted yet. On upside, The immediate resistance is 1.1600 with a break above it exposing to 1.1650.
- Technical readings in the daily chart support the bullish stances. RSI indicator stabilized around 56, while the Momentum indicator stabilized above the midline, suggesting upward potentials. On downside, the immediate support is 1.1430, unable to defend this level will resume the decline to 1.1290.

CDO TRADER
CDO TRADER, our cutting-edge trading platform, follows the technology from the forefront with new features added continuously. Moreover, CDO TRADER is now available for Android and iOS! So it allows you to trade on the go!
XAU/USD
- Gold price have bounced up from $1,665 on Tuesday’s early European session appreciating on the back of US dollar weakness in a risk-on session, It jumped above 1700 and hit multiday high 1717, bullish in the daily chart.
- There was no clear catalyst for the US Dollar’s collapse, although the positive tone of US equities and easing government bond yields put pressure on the greenback after Wall Street’s opening. The yield on the 2-year Treasury note touched an intraday low of 4.65% after peaking at a multi-year high of 4.80% on Friday. It later recovered to settle just below the 4.70% level.
- The results of the US mid-term elections would take a couple of days. They could have long-lasting effects on the American dollar, mainly if Democrats are not able to retain control of both houses. Republicans do not need much to seize control of Congress. If that’s the case, they may oppose President Joe Biden’s massive expenses, which would exacerbate the risk of an economic downturn. Equities will likely collapse, and it does not seem the dollar could benefit much from it.
- Gold price stabilized around 1712, up for the day and bullish in the daily chart. The gold price stabilized above 20 and 50 SMA, suggesting bullish strength. Meanwhile, the 20 SMA started turning north and heading towards longer ones, indicating bulls not exhausted yet. On upside, the immediate resistance is 1717, break above this level will open the gate to extend the advance to 1730 area.
- From a technical perspective, the RSI indicator hold above the midline and stabilized around 60, suggesting bullish strength. The Momentum indicator stabilized above the midline, suggests upward potentials. On downside, the immediate support is 1665, below this area may resume the decline to 1645.

MetaTrader 4
MT4 has user friendly interface that is providing simplicity and efficiency. The traders can perform trading strategies for different products like Forex and CFD. MetaTrader 4 has over 50 built-in indicators, also it’s the tool that predicts trends and defines the appropriate entry and exit points.

USD/JPY
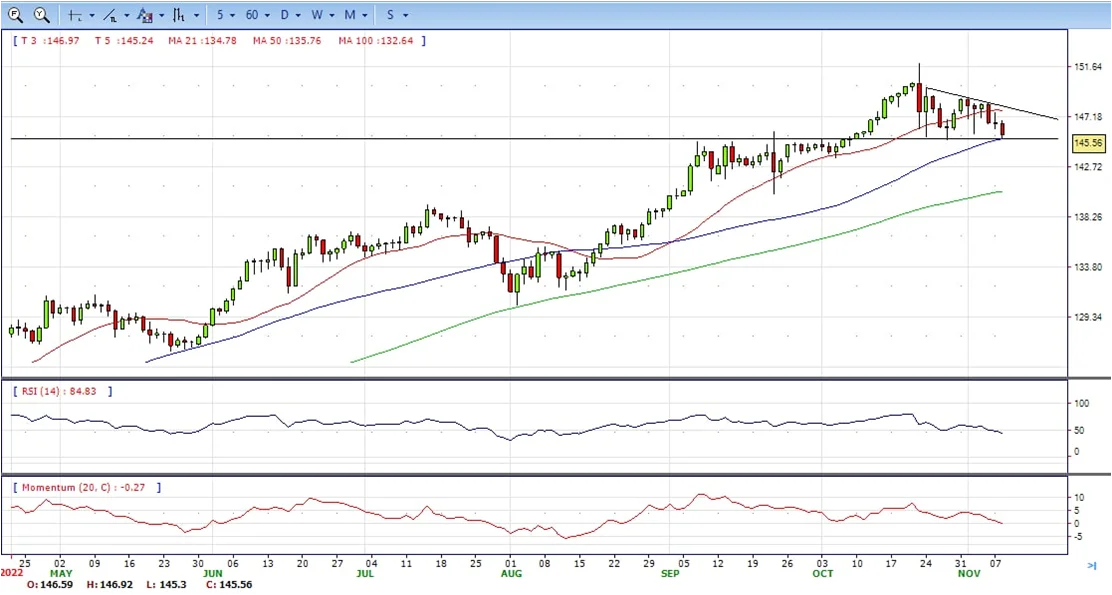
- The USDJPY accelerated the decline on Tuesday amid a broad-based USD decline and also amid a rally in Treasuries. The pair bottomed at 145.30, hitting the lowest intraday level since October 27. It is hovering near the lows, under pressure, and starting to look at the 145.00 critical support.
- It was a quiet session, with markets looking how US votes, when the greenback turned sharply lower with no particular trigger. The DXY turned negative and broke under 110.00. It is down for the third consecutive day, now looking at October lows. The US 10-year fell from above 4.20% to 4.15% while the US 2-year dropped from 4.71% top 4.67%, the lowest level since Friday.
- US mid-term elections are taking place with Republicans poised for a victory according to the latest polls that could give them full control of Congress. People are voting to elect one third of the Senate, all seats of the House of Representatives, and more than 30 governors. Biden’s administration agenda is at risk.
- The USD/JPY pair stabilized around 145.60, down for the day and neutral to bearish in the daily chart. The price still maintains the downward slope and stabilized below 20 SMA, suggests bearish strength in short term. Meanwhile, 20 SMA started turning south and heading towards longer ones, indicating bears not exhausted. Fail to defend 145.30 (50 SMA) will trigger another leg down. On upside, overcome 147.00 may encourage bulls to challenge 148.00, break above that level will open the gate to 149.00.
- Technical indicators suggest the neutral to bearish strength. RSI stabilized around 45, while the Momentum indicator continued developing near the midline, suggests directionless potentials. On downside, the immediate support is 145.30, break below this level will open the gate to 143.50 area.
DJI
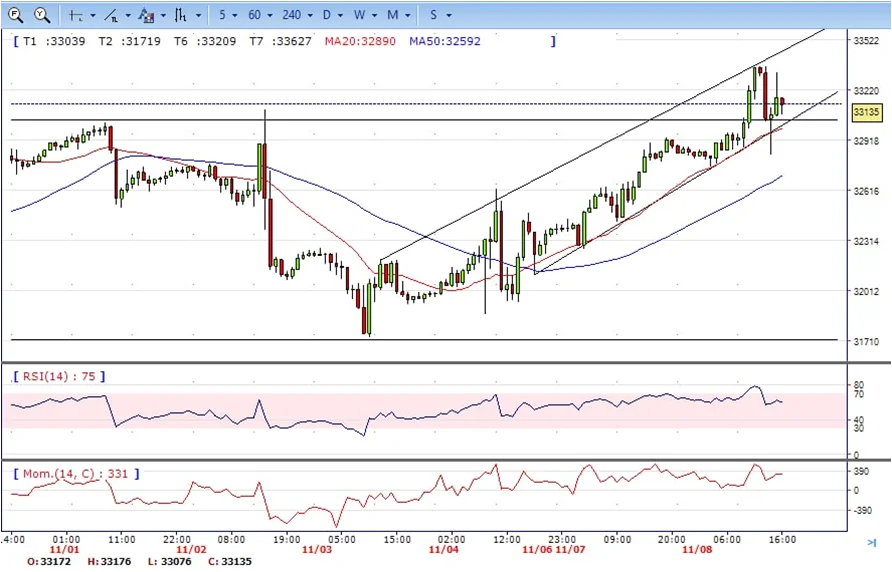
- DJI continued the advance, climbed from intraday low 32764 area to 33365 daily high. It trimmed some gains and ended Tuesday at around 33135, up for the day and bullish in the hourly chart. The price stabilized above all main SMAs, suggests bullish strength. Meanwhile, 20 SMA continued accelerating north and developing above longer ones, suggests bulls not exhausted yet. On upside, overcome 33365 may encourage bulls to challenge 33540, break above this level will open the gate to 33800.
- Technical indicators suggest the bullish strength. RSI stabilized around 59, while the Momentum indicator stabilized above the midline, suggests upward potentials. On downside, the immediate support is 33000, break below this level will open the gate for more decline to 32800 area.
BRENT
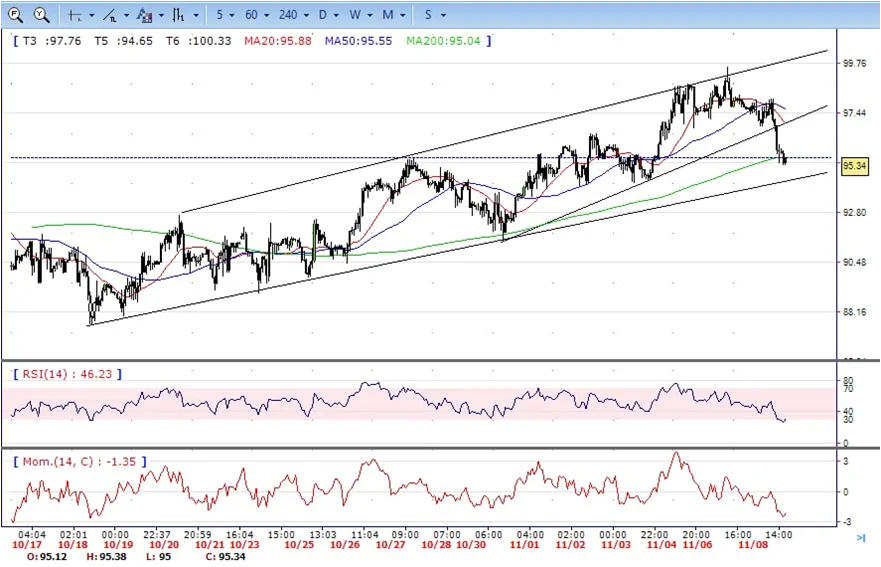
- Brent under the strong sell pressure, dropped from intraday high 98.100 area to intraday low 95.00, it hold near the bottom and ended Tuesday at around 95.35, down for the day and bearish in the hourly chart. The price stabilized below 20 and 50 SMA, suggests bearish strength in short term. Meanwhile, the 20 SMA continued accelerating south and developing below 50 SMA, indicating bears not exhausted yet. On upside, overcome 96.70 may encourage bulls to challenge 98.10, break above this level will open the gate to 99.60.
- Technical indicators suggest the bearish movement, hovering below the midline. RSI stabilized at around 30, while the Momentum indicator stabilized in negative territory, suggests downward potentials. On downside, the immediate support is 94.40, break below this level will open the gate for more decline to 93.00 area.
Contact Us
Please, fill the form to get an assistance.


