EUR/USD
- The EURUSD finished Friday’s session almost flat at around 0.9960s with minuscule gains of 0.02%, the Shared currency recovered some ground against the USD at the New York close, slightly above its opening price.
- Wall Street finished the day with solid gains. Even though the narrative of a possible Federal Reserve pivot circulates in the financial markets, US economic data, particularly inflation, could prove it wrong.
- The US Department of Commerce revealed that the US core PCE expenditure for September expanded by 0.5% MoM, in line with estimates, while the year-over-year reading increased by 5.1%, below expectations but above the previous month’s 4.9%, on Friday. Another report revealed by the US Labor Department reported that the Employment Cost Index (ECI) for Q3 increased by 1.2%, in line with Bloomberg’s estimates, and lower than the second quarter by 1.4%.
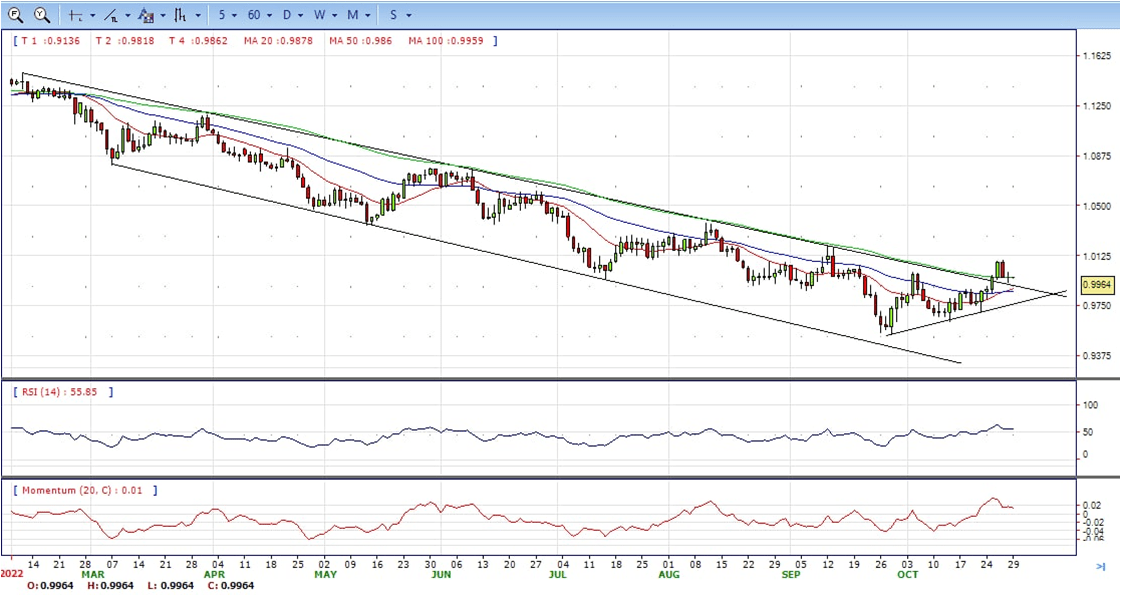
- The EUR/USD pair is trading near the 0.9965, unchanged for the day with the bullish stance in daily chart. The pair stabilized above all main SMAs and stayed firmly above the long-term bearish channel, indicates bullish strength. Meanwhile, the 20 SMA started turning north and heading towards longer ones, suggests bulls not exhausted yet. On upside, the immediate resistance is 1.0100, break above this level will extend the advance to 1.0200.
- Technical readings in the daily chart support the bullish stances. The RSI indicators hovering above the midlines and stabilized around 56. The Momentum indicator stabilized in the positive territory, indicating upward potentials. On downside, the immediate support is 0.9925 and below this level will open the gate to 0.9850.
Open A Demo
CDO has wide range of tools, professional and friendly support for clients to achieve their financial markets trading goals. Open a live account now to enjoy this experience with virtual deposit.
GBP/USD
- The pound bounced up right above 1.1500 earlier on Friday to regain lost ground during the European and US trading sessions and reach the 1.1600 resistance area. In a bigger picture, the pair remains trading in a range for the second consecutive day, consolidating gains after a two-day rally from levels below 1.1300 earlier this week.
- Market expectations that the Federal Reserve might start softening its monetary tightening pace over the next months are keeping USD bulls in check. Investors have already priced in a 0.75% hike in December, but the increasing rumors about the possibility of scaling down monetary tightening in December are curbing demand for the dollar.
- On the other hand, wage growth slowed down in the third quarter, according to data from the Labor Department, which suggests that inflation might have peaked or is close to doing so. Furthermore, the US Personal Consumption Expenditures remained flat at a 6.2% yearly pace in September, while the Core PCE, the Fed’s preferred inflation gauge increased below expectations.
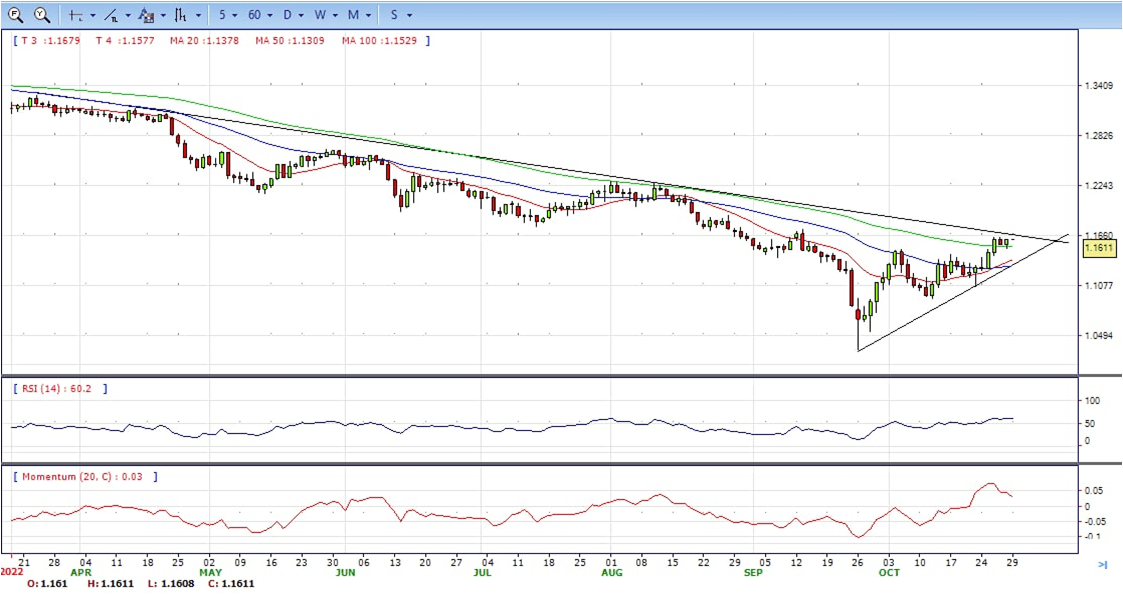
- The GBP/USD offers bullish stance in daily chart. Cable now is stabilizing above all main SMAs, indicating bullish strength in short term. Meanwhile, the 20 SMA started turning north and heading towards longer ones, suggests bulls not exhausted yet. On upside, The immediate resistance is 1.1700 with a break above it exposing to 1.1900.
- Technical readings in the daily chart support the bullish stances. RSI indicator stabilized around 60, while the Momentum indicator stabilized above the midline, suggesting upward potentials. On downside, the immediate support is 1.1500, unable to defend this level will resume the decline to 1.1350.

CDO TRADER
CDO TRADER, our cutting-edge trading platform, follows the technology from the forefront with new features added continuously. Moreover, CDO TRADER is now available for Android and iOS! So it allows you to trade on the go!
XAU/USD
- Gold price slides and extends its losses below $1650 due to stubbornly high US inflation reported namely the Core Personal Consumption Expenditures (PCE), the Federal Reserve’s favorite gauge of inflation, which increased more than estimates, bolstering the US Dollar.
- On Friday, the US Commerce Department revealed that September’s US inflation, as measured by the Core PCE, which strips volatile items like food and energy, jumped 0.5% MoM, higher than the previous reading, while annually based, escalated by 5.1%, above 4.9% forecasts by street’s analysts. In a separate report, the Employment Cost Index, an indicator used by the Fed in addressing inflation on wages, increased by 1.2% in the July-September period, as reported by the Department of Labor.
- Of late, additional US economic data was reported, with the University of Michigan (UoM) Consumer Sentiment unchanged at 59.9. Consumer’s inflation expectations for the 1-year horizon easied from 5.1% to 5%, and for a 5-years and beyond, were unchanged at 2.9%.
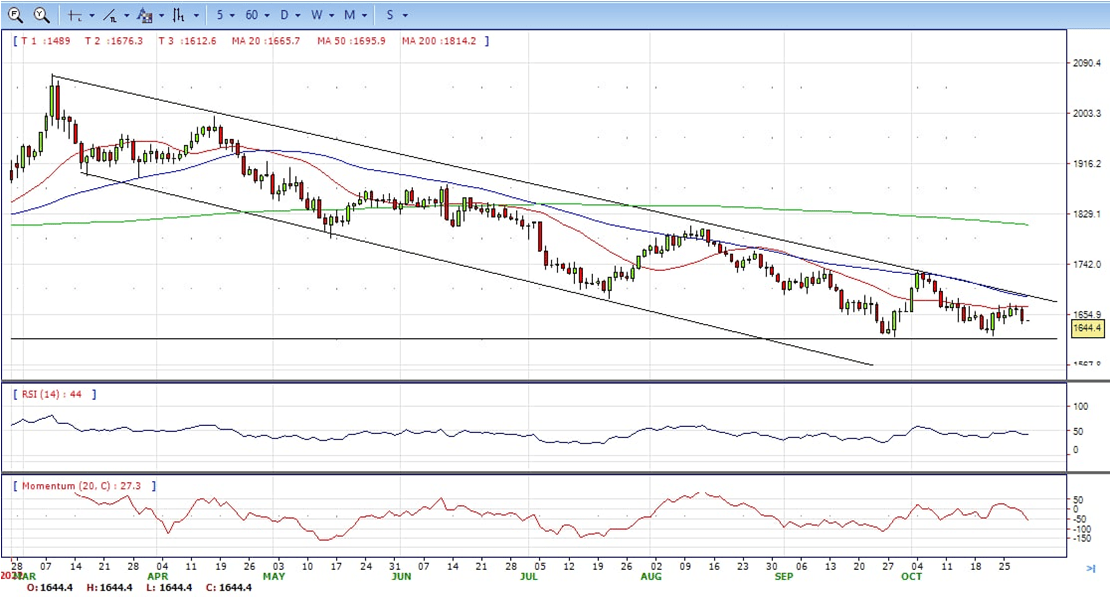
- Gold price stabilized around 1644, down for the day and bearish in the daily chart. The gold price stabilized below 20 and 50 SMA, suggesting bearish strength. Meanwhile, the 20 SMA continued developing below longer ones despite it started turning flat, indicating bears not exhausted yet. On upside, the immediate resistance is 1675, break above this level will open the gate to extend the advance to 1686 area.
- From a technical perspective, the RSI indicator hold below the midline and stabilized around 43, suggesting bearish strength. The Momentum indicator struggled below the midline, suggests downward potentials. On downside, the immediate support is 1638, below this area may resume the decline to 1614.
MetaTrader 4
MT4 has user friendly interface that is providing simplicity and efficiency. The traders can perform trading strategies for different products like Forex and CFD. MetaTrader 4 has over 50 built-in indicators, also it’s the tool that predicts trends and defines the appropriate entry and exit points.

USD/JPY
- The sharp greenback rally witnessed during Friday’s Asian and early European trading sessions, has lost steam after hitting 147.85. The pair, however, is consolidating gains above the 147.50, after a 0.8% daily appreciation.
- The greenback has lost bullish momentum in the early US trading session, following the release of a set of first-tier US macroeconomic indicators. US consumer spending increased at a 0.6% pace in September, according to data released by the Department of Commerce, which shows that the US economy remains in good health and paves the Fed’s path for another jumbo hike in December.
- Before that, the Japanese yen had pared some of the previous days’ gains, hammered by the dovish rhetoric of the Bank of Japan’s monetary policy decision. The BoJ has confirmed its accommodative policy, as widely expected, leaving its target for short-term rates at -0.1% and reaffirming their commitment to keeping the 10-year bond yield near 0%.
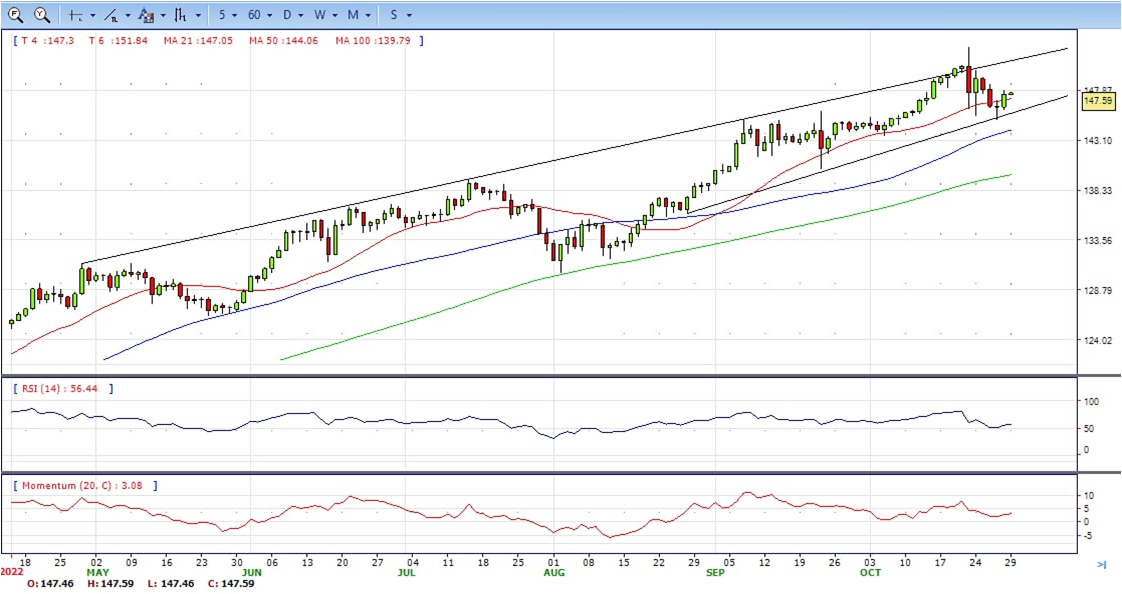
- The USD/JPY pair stabilized around 147.60, up for the day and bullish in the daily chart. The price still maintains the upward slope and stabilized above all main SMAs, suggests bullish strength in short term. Meanwhile, 20 SMA continued accelerating north and developing above longer ones, indicating bulls not exhausted in the long term. On upside, overcome 148.40 may encourage bulls to challenge 149.70, break above that level will open the gate to 151.00.
- Technical indicators suggest the bullish strength. RSI stabilized around 57, while the Momentum indicator continued developing above the midline, suggests upward potentials. On downside, the immediate support is 146.70, break below this level will open the gate to 145.00 area.
DJI
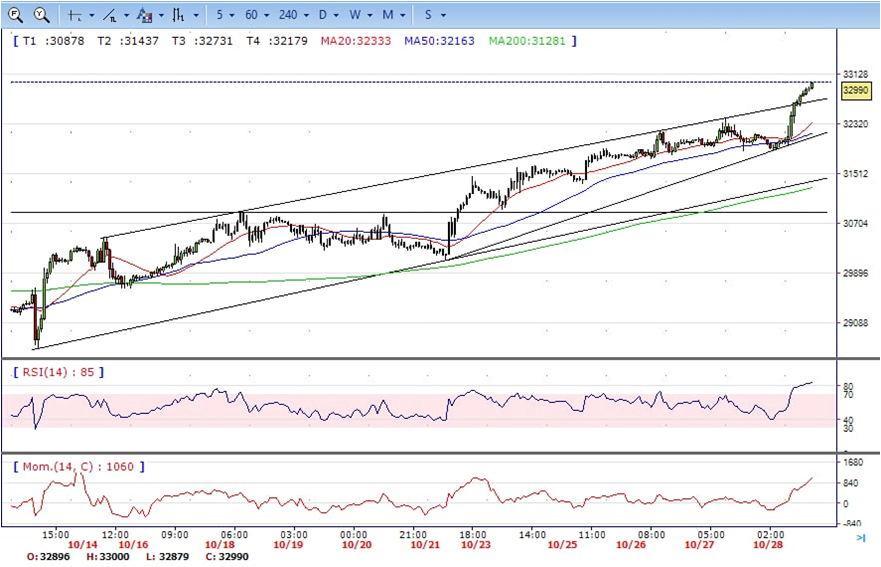
- DJI continued the advance, jumped from the intraday low 31860 area to 32924 daily high. It ended Friday near the top, up for the day and bullish in the hourly chart. It stabilized above 20 and 50 SMA, suggests bullish strength. Meanwhile, 20 SMA continued accelerating north and developing above longer one, suggests bulls not exhausted yet. On upside, overcome 33000 may encourage bulls to challenge 33300, break above this level will open the gate to 33530.
- Technical indicators suggest the bullish strength. RSI stabilized around 85, while the Momentum indicator stabilized above the midline, suggests upward potentials. On downside, the immediate support is 32600, break below this level will open the gate for more decline to 32330 area.
BRENT
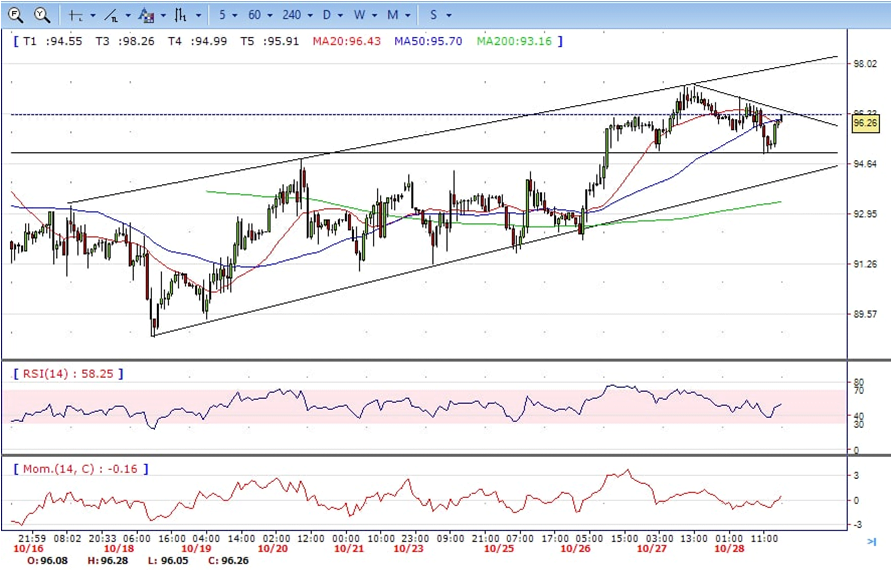
- Brent under the sell pressure , tumbled from intraday high 96.90 to intraday low 94.96, it recovered some losses and ended Friday at around 96.25, up for the day and bullish in the hourly chart. The price stabilized above 20 and 50 SMA, suggests bullish strength in short term. However, the 20 SMA continued accelerating south and developing below 50 SMA, indicating bears not exhausted yet. On upside, overcome 97.30 may encourage bulls to challenge 98.60, break above this level will open the gate to 100.00.
- Technical indicators suggest the bullish movement, hovering above the midline. RSI stabilized around 54, while the Momentum indicator stabilized in positive territory, suggests upward potentials. On downside, the immediate support is 95.00, break below this level will open the gate for more decline to 93.50 area.
Contact Us
Please, fill the form to get an assistance.


