31/05/2023 Daily Reports
- EUR/USD snaps five straight days of losses, rising some 0.30% in the North American session after a tranche of EU economic data showed that inflation in some countries of the bloc appears to ease. Meanwhile, consumer confidence advances in the US, capping the EUR/USD gains. At the time of writing, the EUR/USD is trading at 1.0729.
- Wall Street trades mixed, though tech stocks climb on AI’s frenzy. The Conference Board revealed that Consumer Confidence in May rose to 102.3, below April’s 103.7, but exceeded estimates of 99. Aside from this, the Eurozone economic agenda featured May inflation in Spain, with MoM figures at -0.1%, below estimates of 0.1% and well beneath the prior’s month reading of 0.6%. Annually based, inflation expanded by 3.2%, below forecasts of 3.5%.
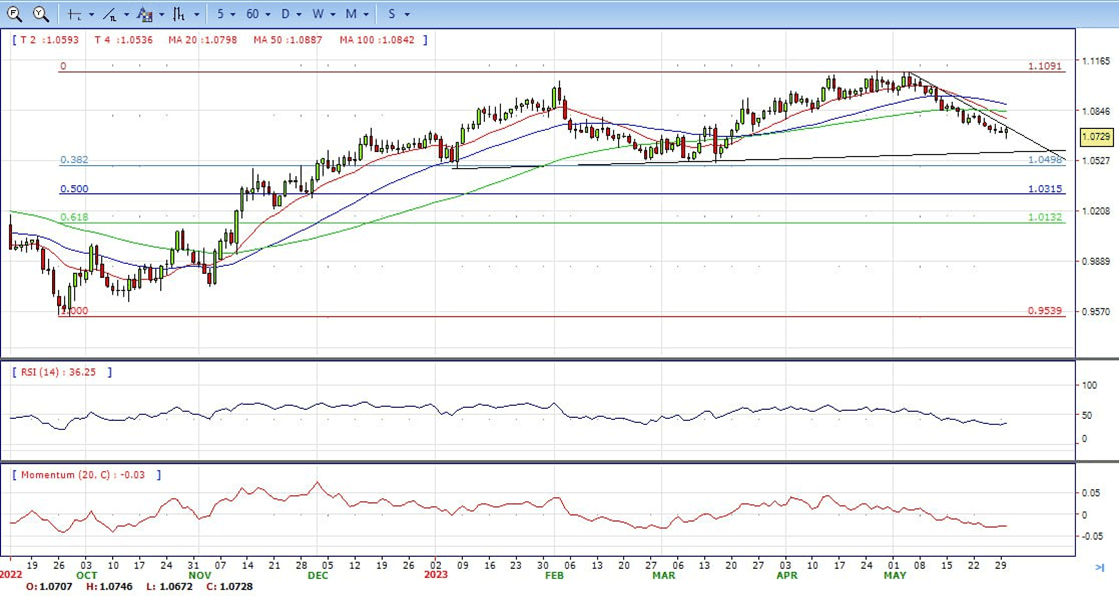
- The EUR/USD pair is trading near the 1.0729, slightly up for the day with bearish stance in daily chart. The pair stabilized below 20 and 50 SMA, indicates bearish strength. Meanwhile, the 20 SMA started turning south and heading towards 50 and 200 SMA, suggests bears not exhausted yet. On upside, the immediate resistance is 1.0760, break above this level will extend the advance to 1.0850.
- Technical readings in the daily chart support the bearish stance. The RSI indicator stabilizes around 35. The Momentum indicator holds below the midline, indicating bearish potentials. On downside, the immediate support is 1.0670 and below this level will open the gate to 1.0600.
- The GBP/USD pair attracts some dip-buying near the 1.2325 region on Tuesday and turns positive for the third straight day, though remains confined well within a familiar trading band held over the past week or so. The pair currently placed near the top end of its daily range, around the 1.2405 region and is supported by a combination of factors.
- Investors remain anxious over the possibility of further monetary policy tightening by the UK central bank, bolstered by stronger-than-expected consumer inflation figures released last week. This, in turn, is seen underpinning the British Pound and acting as a tailwind for the GBP/USD pair amid subdued US Dollar price action. In fact, the USD Index, which tracks the Greenback against a basket of currencies, enters a bullish consolidation phase following an early uptick to its highest level since mid-March.
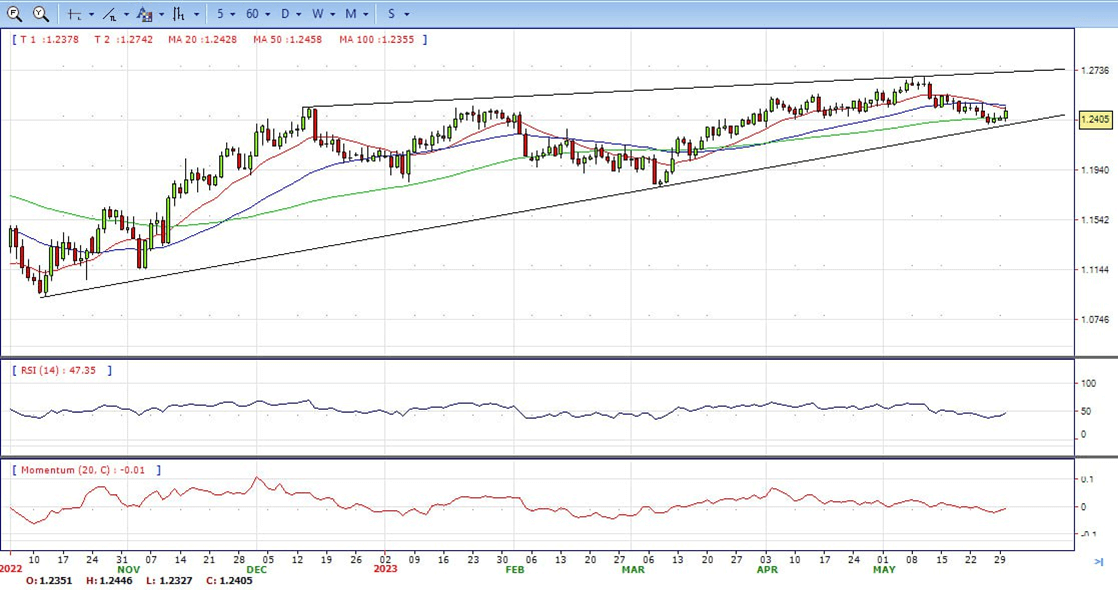
- The GBP/USD offers bearish stance in daily chart. Cable stabilizes below 20 and 50 SMA, indicating bearish strength in short term. Meanwhile, the 20 SMA started turning south and heading towards longer ones, suggests bears not exhausted yet. On upside, the immediate resistance is 1.2450 with a break above it exposing to 1.2550.
- Technical readings in the daily chart support the bearish stances. RSI indicator stabilizes around 47, while the Momentum indicator stabilizes below the midline, suggesting downward potentials. On downside, the immediate support is 1.2380, unable to defend this level will resume the decline to 1.2300.


- Gold price is rising considerably on Tuesday, supported by a decline in government bond yields. XAU/USD hit a fresh daily high at $1,963.5 before pulling back towards $1,959.
- US economic data will take centre stage, with the focus on employment figures. ADP will release its report on Thursday, and Nonfarm Payrolls are due on Friday. Bond yields are falling in Europe and the US, with the 10-year German bund yield standing at 2.37%, the lowest since May 18, and the 10-year Treasury yield at 3.73%, down 1% for the day.
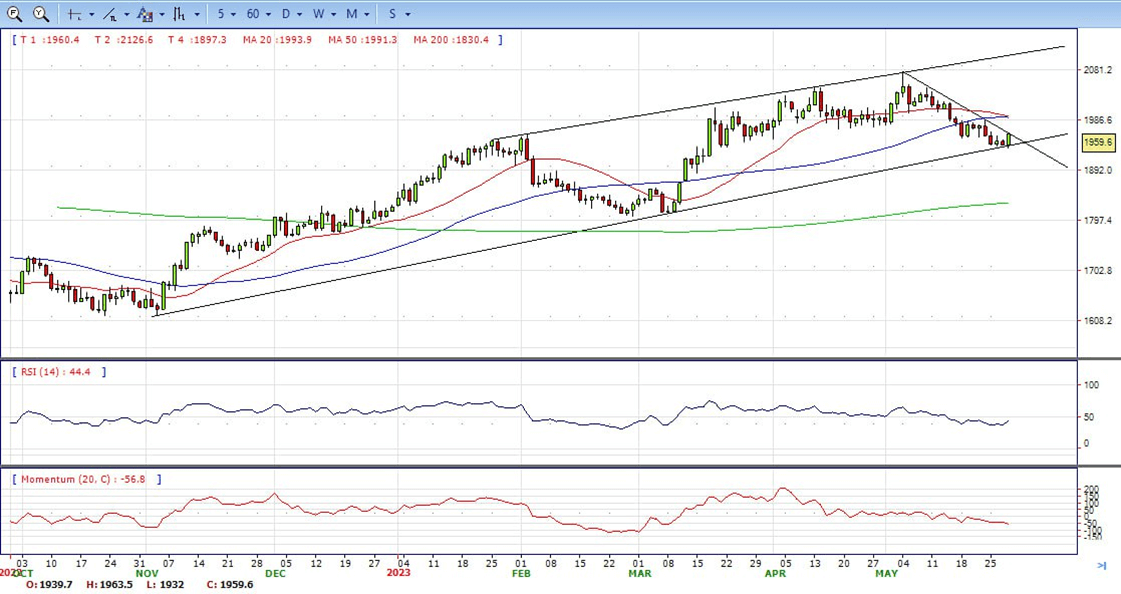
- Gold price stabilized around 1959, up for the day and bearish in the daily chart. The gold price stabilizes below 20 SMA, suggesting bearish strength in short term. However, the 20 SMA started turning flat but continued developing far above 50 and 200 SMA, indicates bulls not exhausted yet. On upside, the immediate resistance is 1965, break above this level will open the gate for more advance to 1985 area.
- From a technical perspective, the RSI indicator holds below the mid-line and stabilizes around 44, on a bearish strength. The Momentum indicator hold in negative territory, suggests downward potentials. On downside, the immediate support is 1932, below this area may resume the decline to 1900.


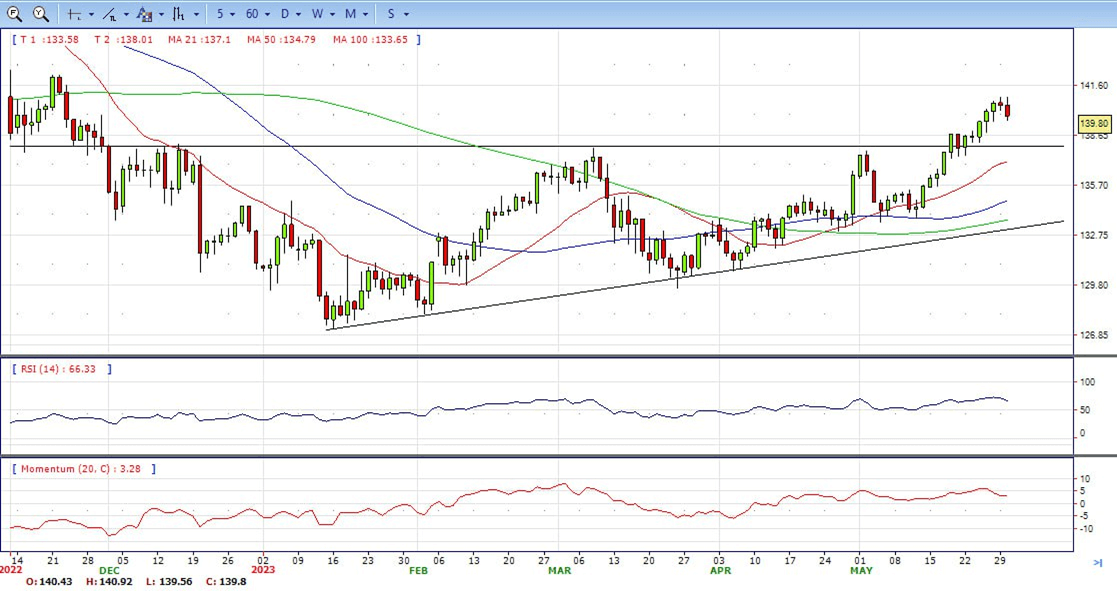
- USD/JPY dropped for two consecutive days after Japanese authorities expressed that currency market moves would be watched, following a meeting between the BoJ and Masato Kanda, vice finance minister for international affairs. After those remarks, the Japanese Yen strengthened. At the time of writing, the USD/JPY is trading at 139.80, losing 0.40%.
- In fact, the current market pricing indicates a greater chance of another 25 bps lift-off at the next FOMC monetary policy meeting in June. The bets were reaffirmed by the recent hawkish remarks by a slew of influential Fed officials and the US Core PCE Price Index released on Friday, which pointed to sticky inflation. This should act as a tailwind for the USD and supports prospects for the emergence of some dip-buying around the USD/JPY pair.
- The USD/JPY pair stabilized around 139.80, down for the day and bullish in the daily chart. The price stabilizes above 20 and 50 SMA, suggests bullish strength in short term. Meanwhile, 20 SMA continued accelerating north and developing above longer ones, indicating bulls not exhausted. On upside, overcome 141.00 may encourage bulls to challenge 142.30, break above that level will open the gate to 145.00.
- Technical indicators suggest the bullish strength. RSI stabilizes around 64, while the Momentum indicator stabilizes above the midline, suggests upward potentials. On downside, the immediate support is 138.80, break below this level will open the gate to 137.20 area.
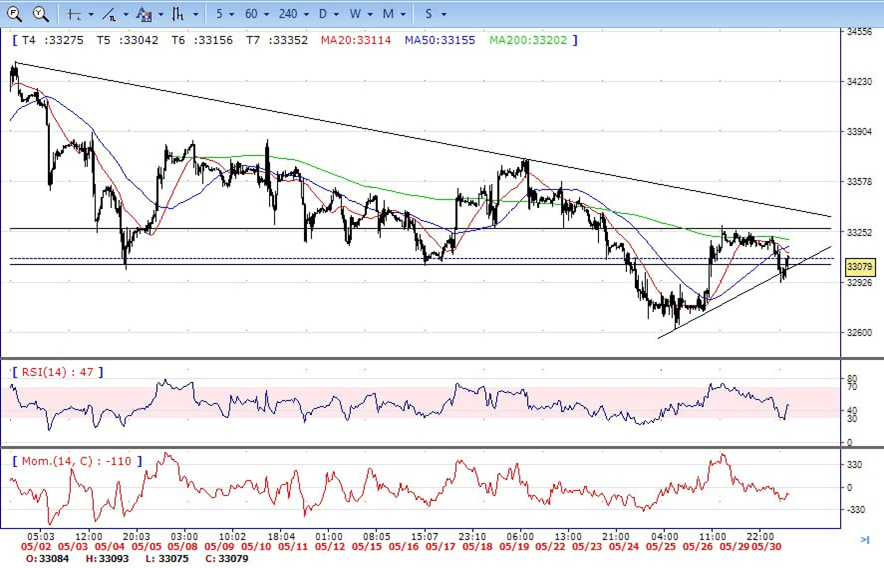
- DJI under the sell pressure on Tuesday, traded from intraday high 33220 area to low 32920level. It trimmed some losses and ended Tuesday around 33080, below 20 and 50 SMA, suggests bearish strength. Meanwhile, 20 SMA started turning south and heading towards longer ones, suggests bears not exhausted yet. On upside, overcome 33300 may encourage bulls to challenge 33550, break above that level will open the gate to 33730.
- Technical indicators suggest the bullish movement. RSI stabilizes around 46, while the Momentum indicator stabilizes below the midline, suggests downward potentials. On downside, the immediately support is 32900, break below this level will open the gate for more decline to 32600 area.
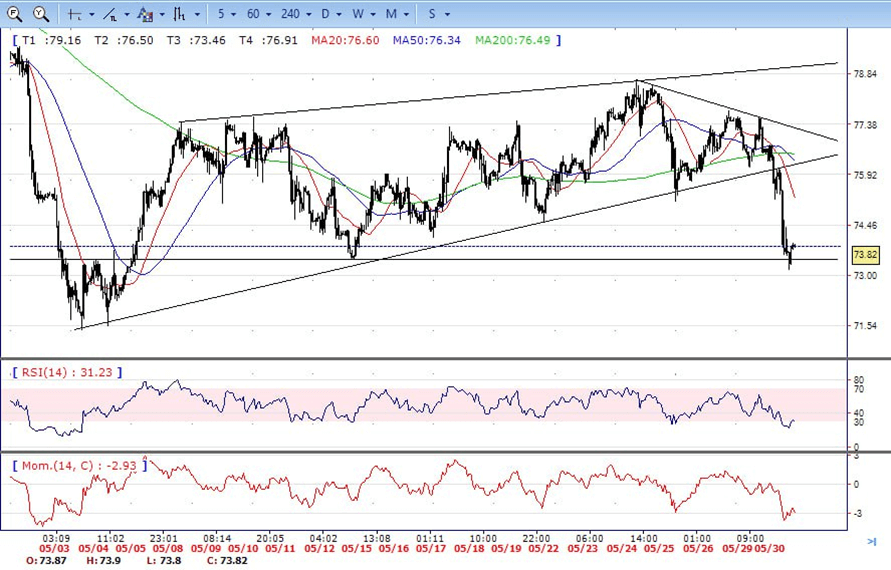
- Brent under the strong sell pressure on Tuesday, traded from intraday high 77.60 area to low 73.16 level. It recovered modestly and ended the day around 73.80, down for the day and stabilized below 20 and 50 SMA, indicates bearish sign in the hourly chart. Meanwhile, the 20 SMA continued accelerating south and developing below longer ones, indicates bears not exhausted yet. On upside, overcome 75.20 may encourage bulls to challenge 76.20, break above that level will open the gate to 77.60.
- Technical indicators also suggest bearish movement, hovering below the midline. RSI stabilizes at 31, while the Momentum indicator stabilizes in negative territory, suggests downward potentials. On downside, the immediately support is 73.00, break below this level will open the gate for more decline to 71.40 area.