30/12/2022 Daily Reports
- The Euro held to its gains vs. the USD as sentiment improved ahead of the last trading day of 2022. Data from the US showed a slight jump in unemployment claims, boosting the EUR/USD, while China’s Covid-19 relaxing restrictions keep investors nervous. At the time of writing, the EUR/USD is trading at 1.0670, still bullish in the daily chart.
- US economic data revealed by the Department of Labor featured Initial Jobless Claims for the week ended on December 24, which jumped to 225K, in line with expectations, and 9K above the previous week’s record. In the meantime, continuing claims rose to 1.7 million in the week that ended on December 17, the highest since early February.
- Aside from this, since authorities relaxed its zero-tolerance policy, the jump in Covid-19 cases in China is overwhelming the country’s healthcare system. Also, flights from China that landed in Italy triggered a reaction from Western countries, with some reimposing tests for people flying from China.
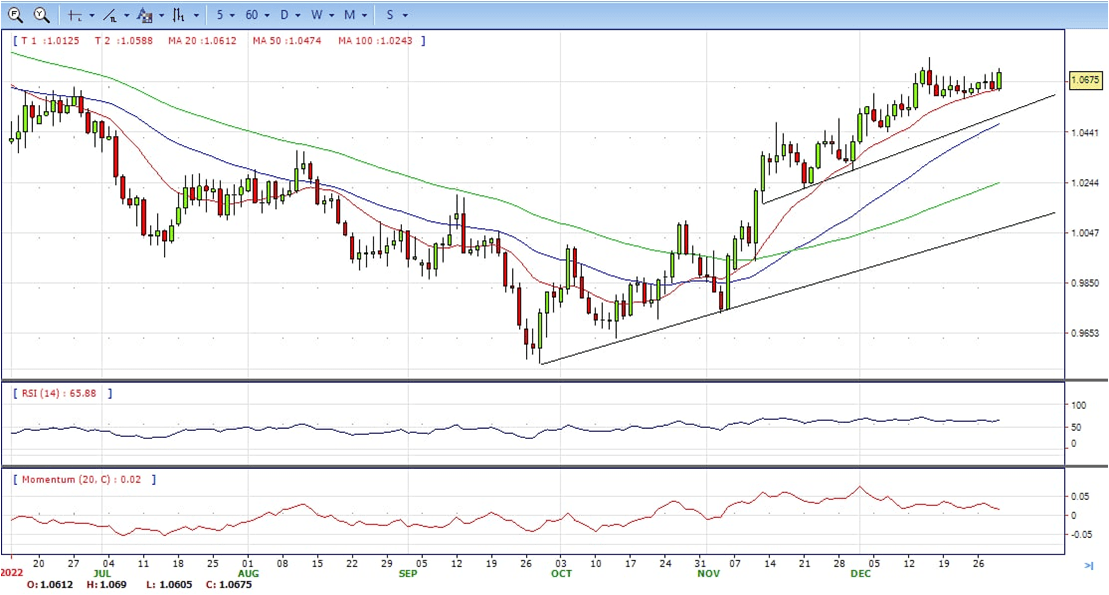
- The EUR/USD pair is trading near the 1.0670, up for the day with bullish stance in daily chart. The pair stabilized above 20 and 50 SMA, indicates bullish strength. Meanwhile, the 20 SMA continued accelerating north and developing far above longer ones, suggests bulls not exhausted yet. On upside, the immediate resistance is 1.0690, break above this level will extend the advance to 1.0740.
- Technical readings in the daily chart support the bullish stances. The RSI indicators hovering above the midline and stabilized around 65. The Momentum indicator stabilized above the midline, indicating upward potentials. On downside, the immediate support is 1.0570 and below this level will open the gate to 1.0500.
- The Pound Sterling remains sideways during the North American session after hitting a daily low of 1.2009 against the USD. Risk aversion spurred by factors linked to China’s learning to live with the coronavirus keeps investors uneasy. Meanwhile, the latest unemployment claims report shows the US labor market remains tight. At the time of writing, the GBP/USD is trading at 1.2065, neutral to bearish in the daily chart.
- The GBP/USD is driven by the US Dollar dynamics due to the lack of UK economic data. The US Dollar Index (DXY), a gauge that tracks the US Dollar value against a basket of six currencies, tumbles 0.36%, down to 104.093, weighed by falling US Treasury yields. The US 10-year benchmark note rate drops three bps, yielding 3.856%.
- On Friday, the UK economic docket is empty, while the US calendar will feature the Chicago PMI for December, estimated at 40.
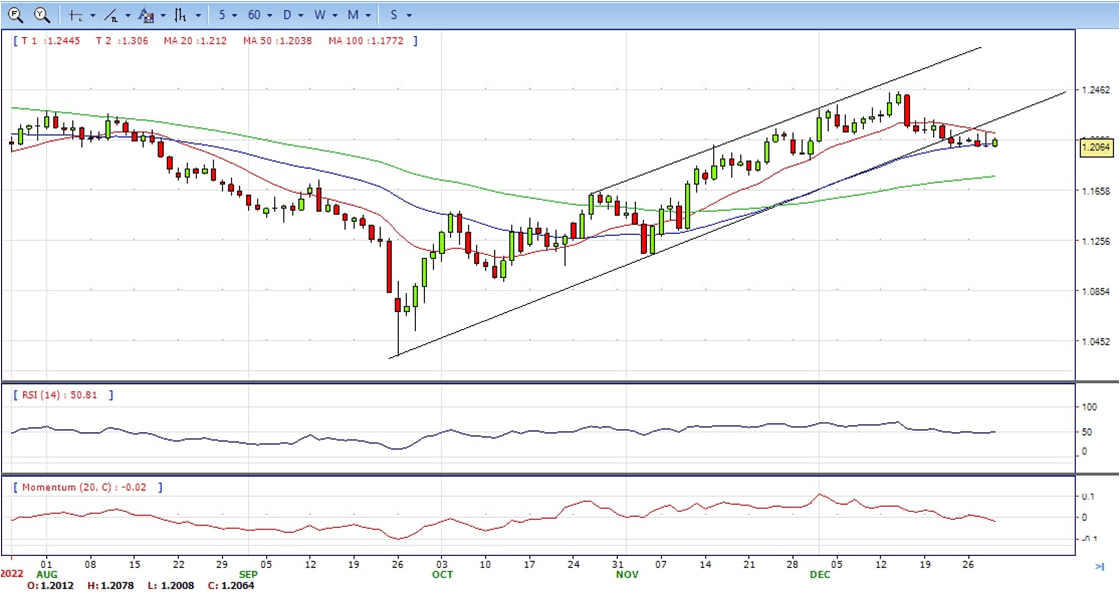
- The GBP/USD offers neutral to bearish stance in daily chart. Cable stabilized between 20 and 50 SMA, indicating neutral strength in short term. However, the 20 SMA started turning south and heading towards 50 SMA, suggests bears not exhausted yet. On upside, The immediate resistance is 1.2150 with a break above it exposing to 1.2250.
- Technical readings in the daily chart support the neutral to bearish stances. RSI indicator stabilized around 50, while the Momentum indicator stabilized below the midline, suggesting downward potentials. On downside, the immediate support is 1.1990, unable to defend this level will resume the decline to 1.1900.


- Gold Price advances after hitting a daily low of $1,803, gaining 0.83% during the North American session bolstered by falling US bond yields, which weakened the USD. Meanwhile, investors’ sentiment improved even though China relaxing Covid-19 policy keeps the health system pressured. At the time of writing, the XAU/USD is trading at $1,816, up by 0.70%, still bullish in the daily chart.
- Wall Street extends its gains on the penultimate trading day of the year. The US Department of Labor revealed Initial Jobless Claims for the week ended on December 24 jumped to 225K, in line with expectations, and 9K above the previous week’s record. Continuing claims rose to 1.7 million in the week that ended on December 17, the highest since early February.
- Additionally, US Treasury bond yields dropped, with the 10-year benchmark yield falling five bps to 3.83%. Consequently, the greenback weakened, as shown by the US Dollar Index, which tracks the US Dollar performance against a basket of peers, diving 0.54%, at 103.90.
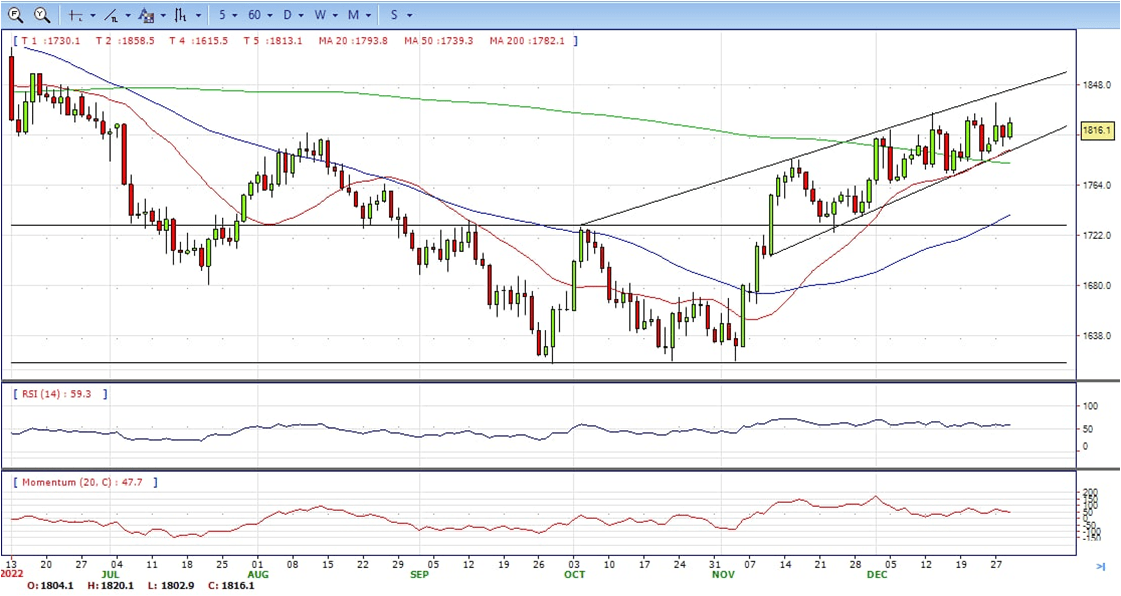
- Gold price stabilized around 1816, up for the day and bullish in the daily chart. The gold price still stabilized above 20 and 50 SMA, suggesting bullish strength in short term. Meanwhile, the 20 SMA continued accelerating north and developing above 50 SMA, indicating bulls not exhausted yet. On upside, the immediate resistance is 1838, break above this level will open the gate for more advance to 1858 area.
- From a technical perspective, the RSI indicator hold above the midline and stabilized around 58, suggesting bullish strength. The Momentum indicator stabilized above the midline, suggests upward potentials. On downside, the immediate support is 1784, below this area may resume the decline to 1765.


- The USD/JPY broke below the 133.45/50 zone after the beginning of the American session and tumbled to 132.90, a two-day low. The pair remains under pressure, hovering around 133.00, down 1% so far for the day, still bearish in the daily chart.
- The decline took place amid a weaker US Dollar across the board hit by an improvement in risk sentiment. US bond yields remained steady. The Dow Jones was rising by more than 300 points while the Nasdaq was adding 2.45%.
- US economic data showed Initial Jobless Claims rose to 225K during the week ended December 24, in line with expectations while Continuing Claims rose to 1.71 million, the highest level since February. The numbers did not have an impact. Price action remains subdue.
- The USD/JPY pair stabilized around 133.00, down for the day and bearish in the daily chart. The price maintains the downward slope and develops below all main SMAs, suggests bearish strength in short term. Meanwhile, 20 SMA continued accelerating south and developing below longer ones, indicating bears not exhausted. On upside, overcome 133.40 may encourage bulls to challenge 134.50, break above that level will open the gate to 135.70.
- Technical indicators suggest the bearish strength. RSI stabilized around 40, while the Momentum indicator continued developing below the midline, suggests downward potentials. On downside, the immediate support is 132.50, break below this level will open the gate to 131.50 area.
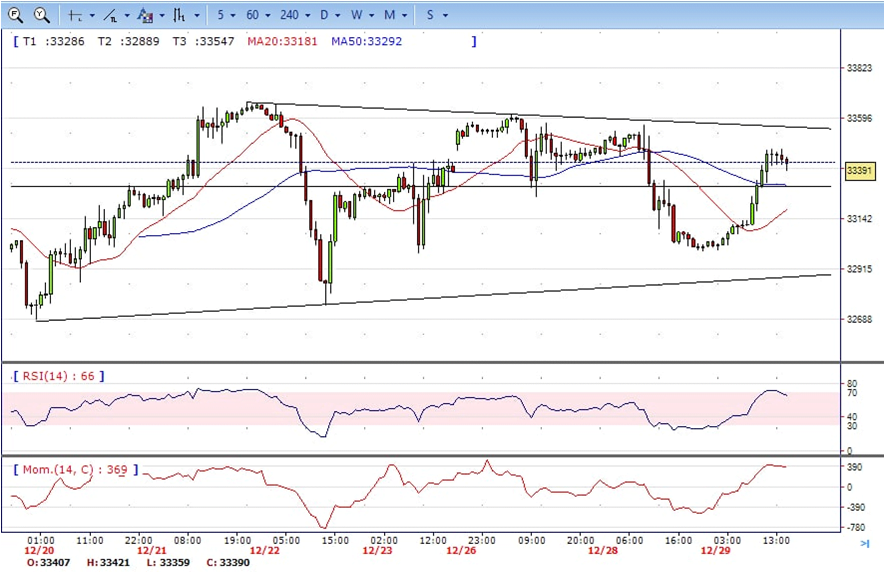
- DJI continued the advance from intraday low 33000 area to high 33460 area, then retreated modestly and ended Thursday at around 33390, up for the day and bullish in the daily chart. The price stabilize above 20 and 50 SMA, suggest bullish strength in short term. Meanwhile, 20 SMA continued accelerating north and heading towards 50 SMA, suggest bears not exhausted yet. On upside, overcome 33460 may encourage bulls to challenge 33570, break above this level will open the gate to 34000.
- Technical indicators suggest the bullish strength. RSI stabilize at around 62, while the Momentum indicator stabilize in positive territory, suggest upward potentials. On downside, the immediate support is 33300, break below this level will open the gate for more decline to 33000 area.
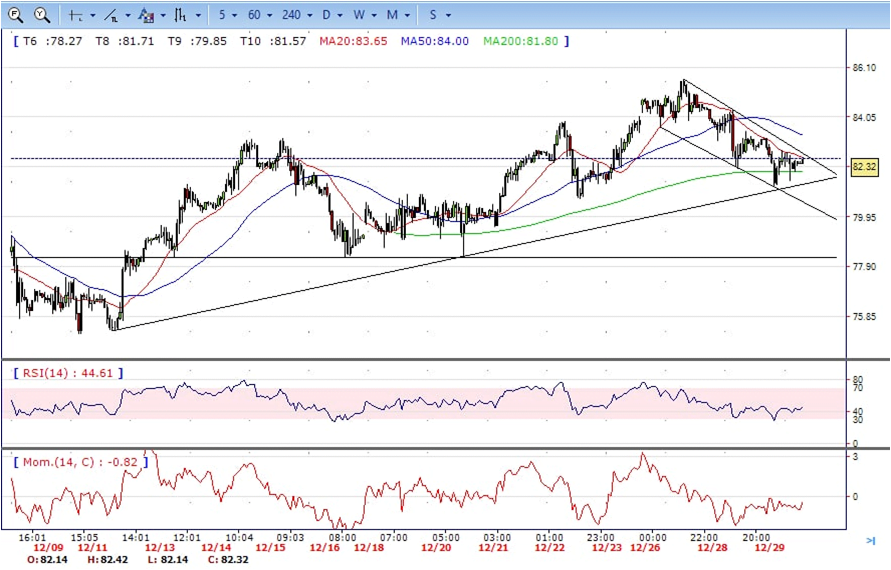
Brent still under the sell pressure, retreated from intraday high 83.20 area to low 81.24. It bounced from there and recovered some losses, ended Thursday at around 82.30, down for the day and bearish in the hourly chart. The price stabilize below 20 SMA and 50 SMA, suggests bearish strength in short term. Meanwhile, the 20 SMA continue accelerating south and developing below 50 SMA, indicating bears not exhausted yet. On upside, overcome 82.70 may encourage bulls to challenge 83.50, break above this level will open the gate to 84.30.
Technical indicators suggest the bearish movement, hovering below the midline. RSI stabilize at around 46, while the Momentum indicator stabilize in negative territory, suggest downward potentials. On downside, the immediate support is 81.20, break below this level will open the gate for more decline to 80.60 area.