EUR/USD
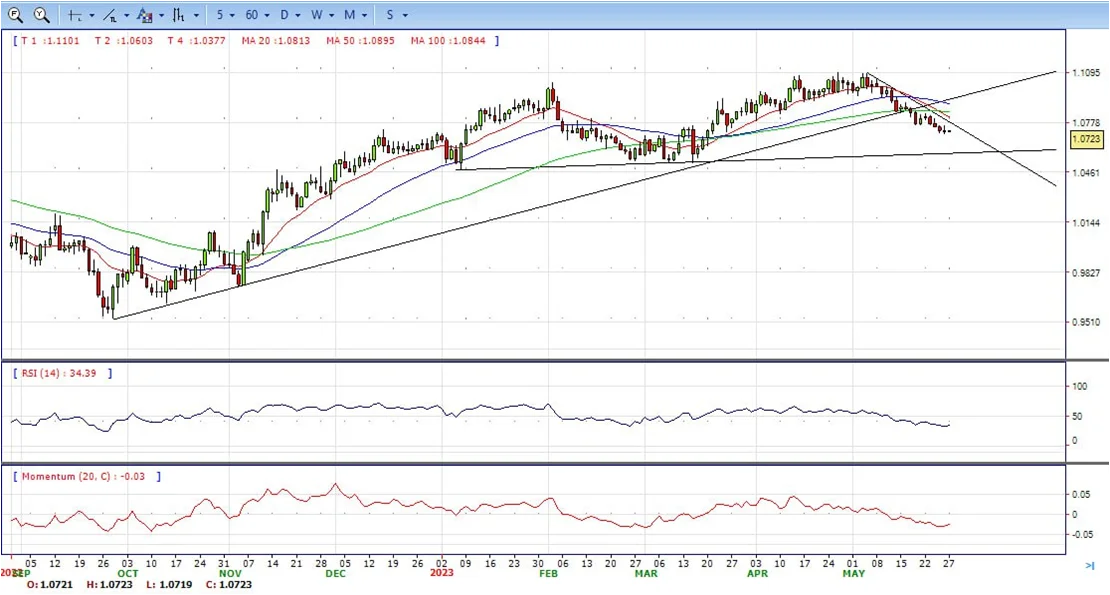
- EUR/USD hit a 9-week low of 1.0701 on the US Dollar´s strength as expectations increased that the US Federal Reserve will deliver another rate hike. The pair bounced from there modestly and ended the day around 1.0723, flat for the day.
- Inflation in the US, as measured by the change in PCE Price Index, rose to 4.4% on a yearly basis in April from 4.2% in March, the US Bureau of Economic Analysis reported on Friday. This reading came in higher than the market expectation of 3.9%. With the initial reaction, the US Dollar Index staged a rebound from session lows and was last seen losing 0.1% on the day at 104.10. Meanwhile, the benchmark 10-year US Treasury bond yield gained traction after these data and climbed to its highest level in over two months above 3.8%.
- The EUR/USD pair is trading near the 1.0723, unchanged for the day with bearish stance in daily chart. The pair stabilized below 20 and 50 SMA, indicates bearish strength. Meanwhile, the 20 SMA started turning south and heading towards 50 and 200 SMA, suggests bears not exhausted yet. On upside, the immediate resistance is 1.0760, break above this level will extend the advance to 1.0850.
- Technical readings in the daily chart support the bearish stance. The RSI indicator stabilizes around 35. The Momentum indicator holds below the midline, indicating bearish potentials. On downside, the immediate support is 1.0700 and below this level will open the gate to 1.0630.
Open A Demo
CDO has wide range of tools, professional and friendly support for clients to achieve their financial markets trading goals. Open a live account now to enjoy this experience with virtual deposit.
GBP/USD
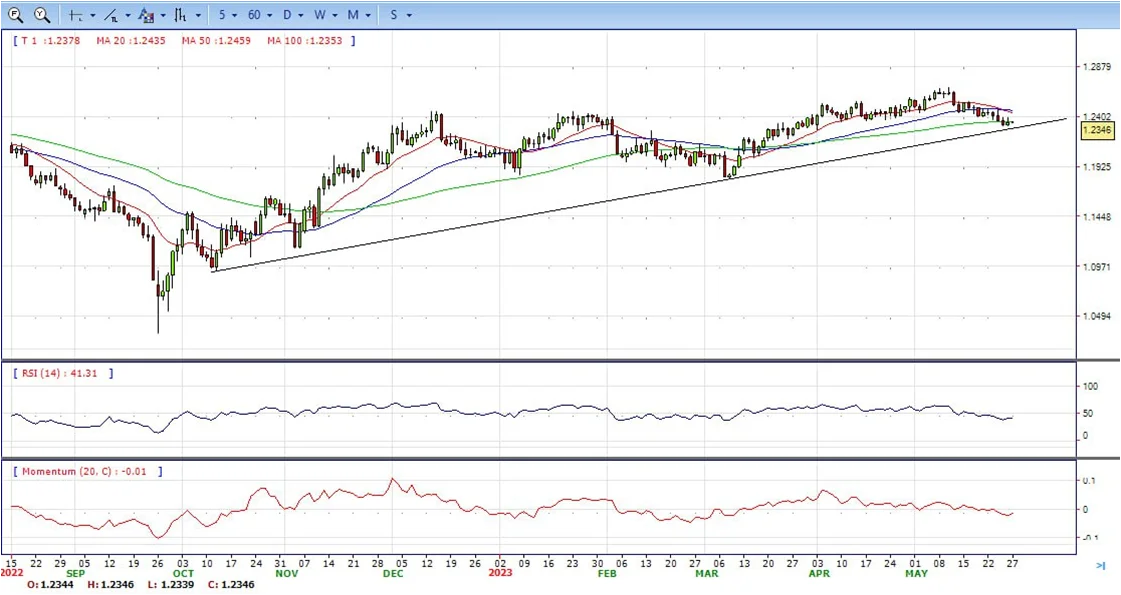
- GBP/USD regained some composure past the mid-North American session and bounced off the weekly lows, clinging above the 1.2300 figure amidst a week that witnessed solid US and UK data. Therefore, the GBP/USD stays positive in the day, gains 0.19%, and trades around 1.2340s.
- US equities continue to run the AI frenzy underpinned by NVIDIA and Maxwell Technologies. The latest tranche of US economic data, with the Fed’s preferred gauge for inflation, the Core PCE rising to 4.7% YoY in April, and headline PCE hitting 4.4% YoY, has increased the odds for additional tightening by the Federal Reserve, with both figures exceeding estimates and previous data. Odds for a 25 bps increase at the June meeting stand at 65.4%, higher than the 17.4% a week before solid data from the US derailed the Fed’s plan to keep rates unchanged.
- The GBP/USD offers bearish stance in daily chart. Cable stabilizes below 20 and 50 SMA, indicating bearish strength in short term. Meanwhile, the 20 SMA started turning south and heading towards longer ones, suggests bears not exhausted yet. On upside, the immediate resistance is 1.2390 with a break above it exposing to 1.2480.
- Technical readings in the daily chart support the bearish stances. RSI indicator stabilizes around 42, while the Momentum indicator stabilizes below the midline, suggesting downward potentials. On downside, the immediate support is 1.2300, unable to defend this level will resume the decline to 1.2200.

CDO TRADER
CDO TRADER, our cutting-edge trading platform, follows the technology from the forefront with new features added continuously. Moreover, CDO TRADER is now available for Android and iOS! So it allows you to trade on the go!
XAU/USD
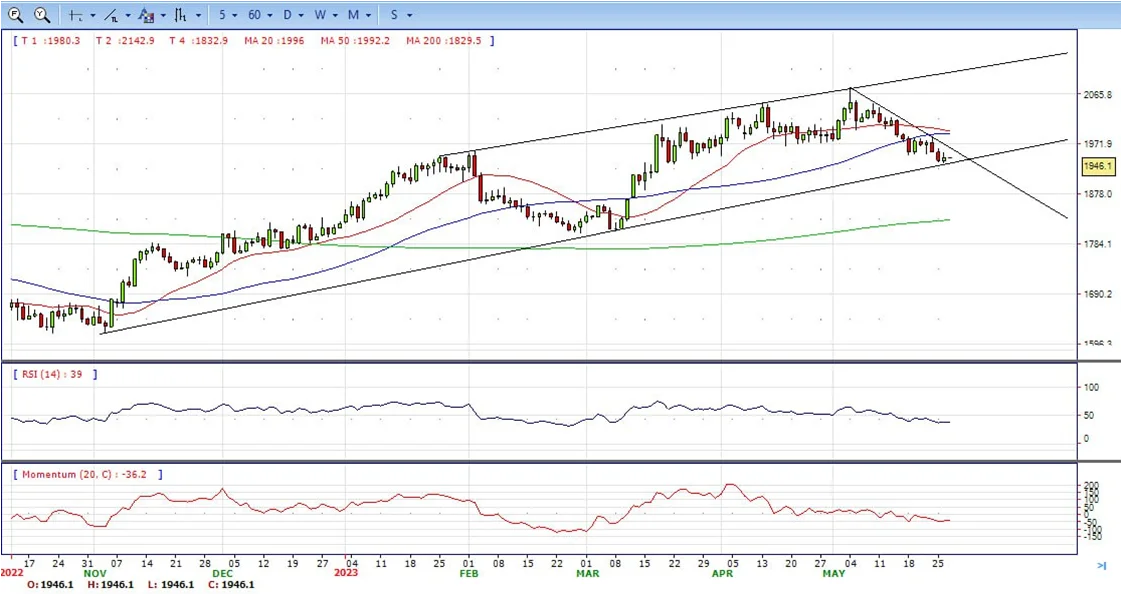
- Gold price recovers some ground but remains shy of reclaiming the $1950 figure after solid economic data in the US suggests the Fed could opt to hike again in June. Consequently, US Treasury bond yields are rising, while the US Dollar hits new two-month highs. The XAU/USD is trading at $1946, up for the day.
- Wall Street registered solid gains, even though the Federal Reserve’s preferred gauge for inflation, the Core PCE, which strips volatile items like food and energy, exceeded estimates of 4.6% and rose by 4.7% YoY in April. Following suit, headline inflation climbed from 4.2% to 4.4% YoY after the Fed released its May meeting minutes, which showed the US central bank’s openness to pause its tightening-cycle.
- Gold price stabilized around 1946, up for the day and bearish in the daily chart. The gold price stabilizes below 20 SMA, suggesting bearish strength in short term. However, the 20 SMA started turning flat but continued developing far above 50 and 200 SMA, indicates bulls not exhausted yet. On upside, the immediate resistance is 1965, break above this level will open the gate for more advance to 1985 area.
- From a technical perspective, the RSI indicator holds below the mid-line and stabilizes around 38, on a bearish strength. The Momentum indicator hold in negative territory, suggests downward potentials. On downside, the immediate support is 1935, below this area may resume the decline to 1900.
MetaTrader 4
MT4 has user friendly interface that is providing simplicity and efficiency. The traders can perform trading strategies for different products like Forex and CFD. MetaTrader 4 has over 50 built-in indicators, also it’s the tool that predicts trends and defines the appropriate entry and exit points.

USD/JPY
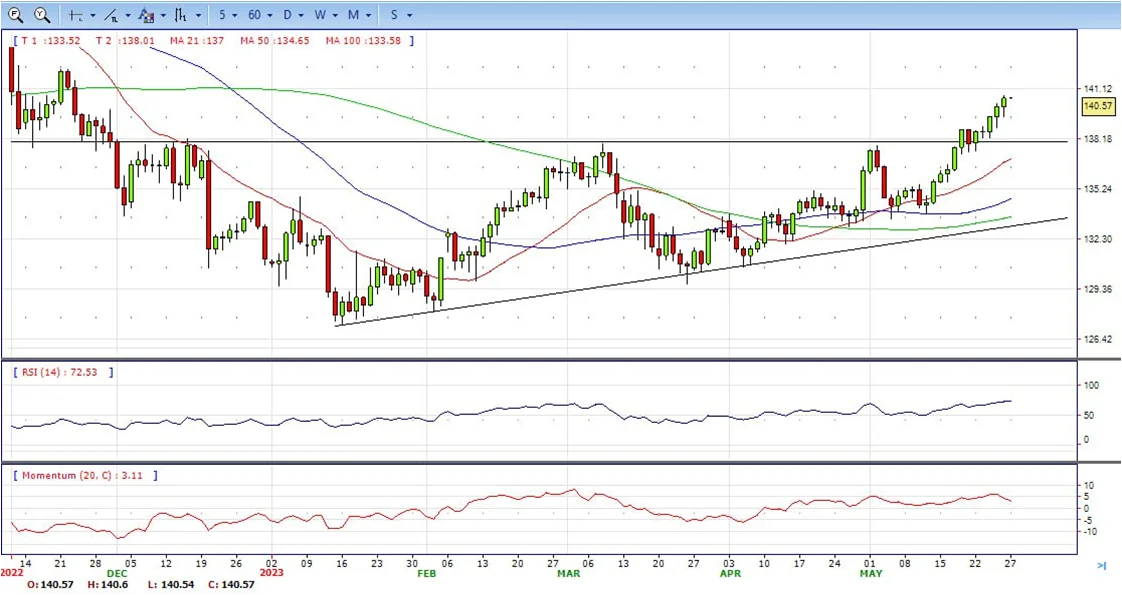
- USD/JPY rallied sharply past the 140.00 figure on Friday late in US session, after traveling towards its daily low of 139.49, before making a U-turn. Solid economic data from the US bolstered the odds for another rate hike by the Fed, as shown by the market reaction. US Treasury bond yields rose before reversing their course, while the US Dollar weakened. At the time of writing, the USD/JPY is trading at 140.57.
- The US Dollar reverses a part of its modest intraday profit-taking slide after the US Bureau of Economic Analysis reported that the headline PCE Price Index rose 0.4% in April as compared to 0.1% in the previous month. Adding to this, the yearly rate accelerated to 4.4% against expectations for a fall to 3.9% from 4.2% in March. Additional details revealed that the Core PCE Price Index – the Fed’s preferred inflation gauge – edged higher to 4.7% from 4.6%, beating consensus estimates.
- The USD/JPY pair stabilized around 140.60, up for the day and bullish in the daily chart. The price stabilizes above 20 and 50 SMA, suggests bullish strength in short term. Meanwhile, 20 SMA continued accelerating north and developing above longer ones, indicating bulls not exhausted. On upside, overcome 141.00 may encourage bulls to challenge 142.30, break above that level will open the gate to 145.00.
- Technical indicators suggest the bullish strength. RSI stabilizes around 72, while the Momentum indicator stabilizes above the midline, suggests upward potentials. On downside, the immediate support is 138.80, break below this level will open the gate to 137.20 area.
DJI
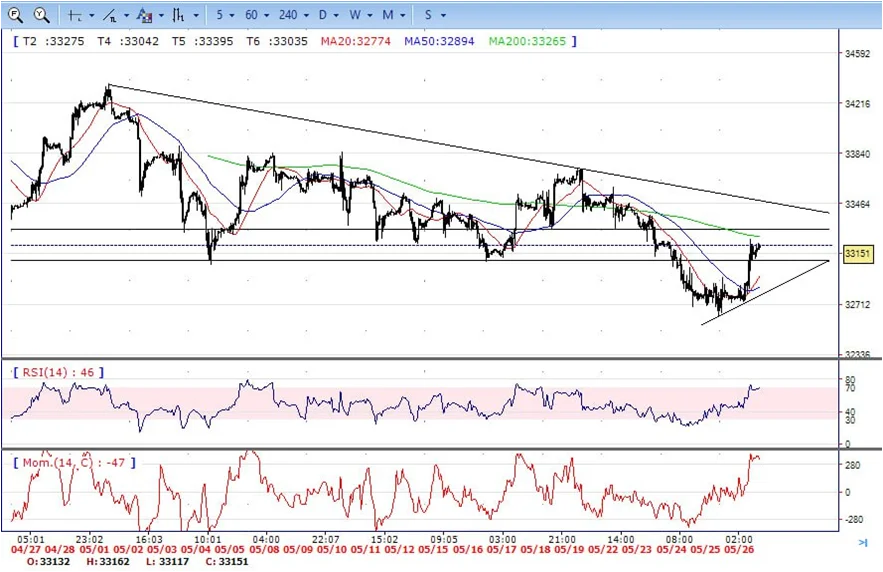
- DJI jumped to high as optimistic about the debt limit talking, traded from intraday low 32730 area to high 33200 level. It retreated modestly and ended Friday around 33150, above 20 and 50 SMA, suggests bullish strength. Meanwhile, 20 SMA started turning north and heading towards longer ones, suggests bulls not exhausted yet. On upside, overcome 33300 may encourage bulls to challenge 33550, break above that level will open the gate to 33730.
- Technical indicators suggest the bullish movement. RSI stabilizes around 69, while the Momentum indicator stabilizes above the midline, suggests upward potentials. On downside, the immediately support is 33000, break below this level will open the gate for more decline to 32600 area.
BRENT
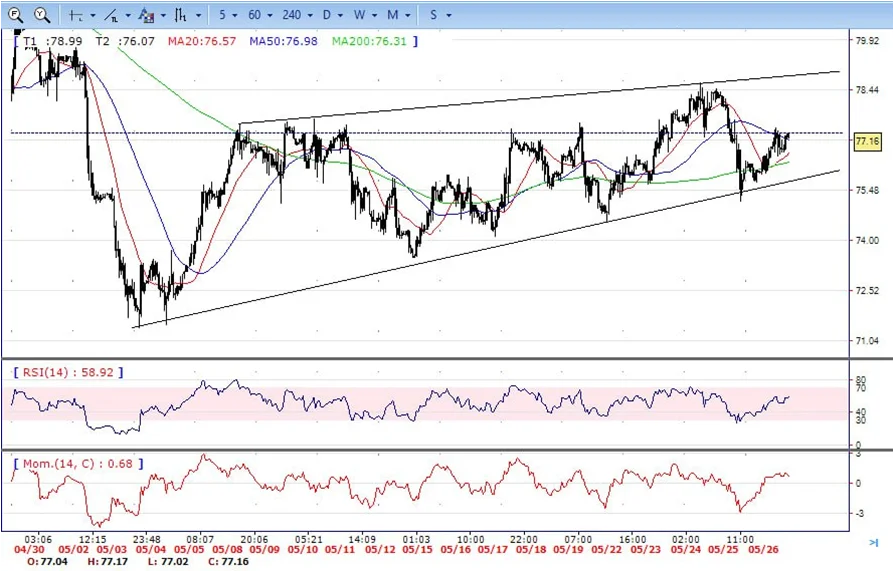
- Brent consolidated with gains on Friday, traded from intraday low 75.70 area to high 77.30 level. It retreated modestly and ended the day around 77.15, up for the day and above 20 and 50 SMA, indicates bullish sign in the hourly chart. Meanwhile, the 20 SMA started turning north and heading towards longer ones, indicates bulls not exhausted yet. On upside, overcome 78.50 may encourage bulls to challenge 79.70, break above that level will open the gate to 80.60.
- Technical indicators also suggest bullish movement, hovering below the midline. RSI stabilizes at 59, while the Momentum indicator stabilizes in positive territory, suggests upward potentials. On downside, the immediately support is 76.30, break below this level will open the gate for more decline to 75.00 area.
Contact Us
Please, fill the form to get an assistance.


