EUR/USD
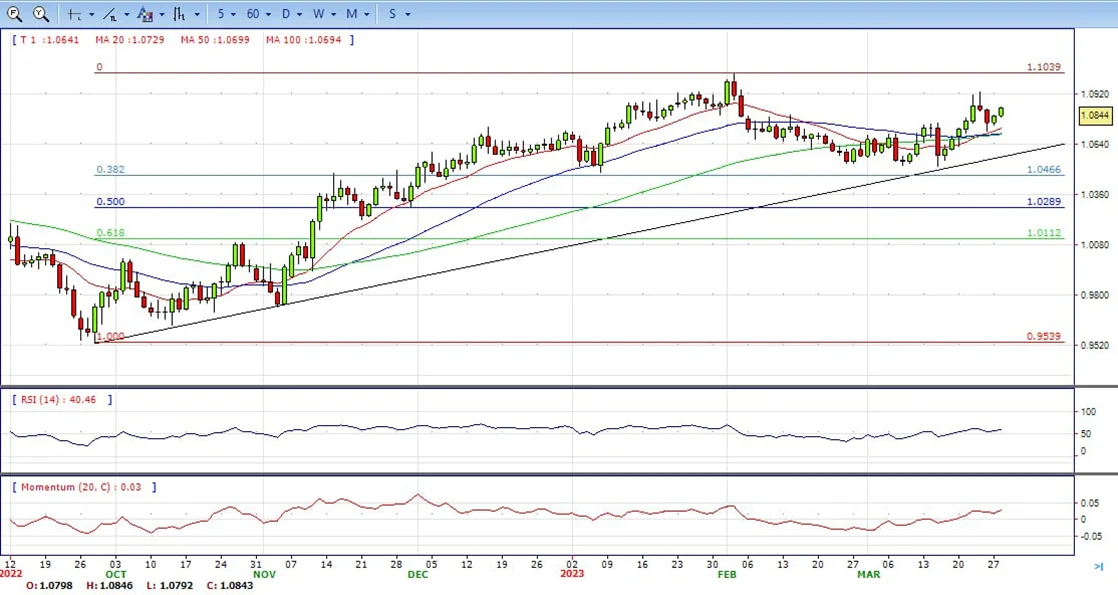
- EUR/USD climbed to a five-day high at 1.0846 as euro zone government bond yields rose on Tuesday and after a deal backed by the US regulator for First Citizens Bancshares to buy up Silicon Valley Bank helped alleviate concerns in the banking sector. At the time of writing, EUR/USD is trading at 1.0844 and is 0.4% higher having rallied from the day´s low of 1.0795.
- Last week, the Federal Reserve’s Federal Open Market Committee raised interest rates by 25 basis points, as expected, but took a cautious stance due to the banking sector crisis at hand. Nonetheless, Fed Chair Jerome Powell kept the door open for further rate rises if necessary which stalled the drop in the US Dollar. The US Dollar fell against a basket of currencies for a second straight day on Tuesday with the DXY, which measures the currency against six rivals, falling to a low of 102.41, not far now from the seven-week low of 101.91 hit last Thursday.
- The EUR/USD pair is trading near the 1.0844, up for the day with bullish stance in daily chart. The pair stabilized above 20 and 50 SMA, indicates bullish strength. Meanwhile, the 20 SMA continued accelerating north and heading towards 50 and 200 SMA, suggests bulls not exhausted yet. On upside, the immediate resistance is 1.0850, break above this level will extend the advance to 1.0930.
- Technical readings in the daily chart support the bullish stance. The RSI indicator stabilizes around 59. The Momentum indicator holds above the midline, indicating bullish potentials. On downside, the immediate support is 1.0800 and below this level will open the gate to 1.0700.
Open A Demo
CDO has wide range of tools, professional and friendly support for clients to achieve their financial markets trading goals. Open a live account now to enjoy this experience with virtual deposit.
GBP/USD
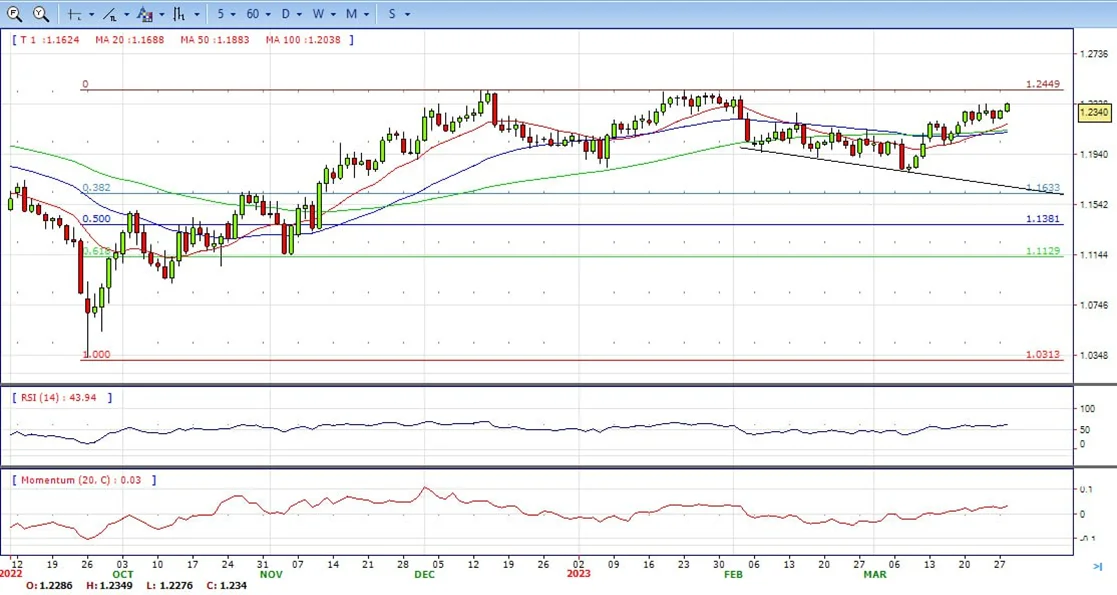
- The GBP/USD pair builds on the previous day’s positive move and gains some follow-through traction for the second successive day on Tuesday. The momentum pushes spot prices to the 1.2345 region, making a new monthly peak for the pair and is sponsored by the prevalent selling bias surrounding the US Dollar.
- Against the backdrop of the Federal Reserve’s less hawkish outlook, receding fears of a full-blown banking crisis turn out to be a key factor weighing on the safe-haven Greenback and lending support to the GBP/USD pair. It is worth recalling that the Fed last week toned down its aggressive approach to reining in inflation and signalled that a pause to interest rate hikes was on the horizon. Furthermore, the takeover of Silicon Valley Bank by First Citizens Bank & Trust Company helped calm market nerves about the contagion risk and reverse the recent negative sentiment.
- The GBP/USD offers bullish stance in daily chart. Cable stabilizes above 20 and 50 SMA, indicating bullish strength in short term. Meanwhile, the 20 SMA continued accelerating north and heading towards longer ones, suggests bulls not exhausted yet. On upside, the immediate resistance is 1.2350 with a break above it exposing to 1.2450.
- Technical readings in the daily chart support the bullish stances. RSI indicator stabilizes around 61, while the Momentum indicator stabilizes above the midline, suggesting upward potentials. On downside, the immediate support is 1.2280, unable to defend this level will resume the decline to 1.2170.

CDO TRADER
CDO TRADER, our cutting-edge trading platform, follows the technology from the forefront with new features added continuously. Moreover, CDO TRADER is now available for Android and iOS! So it allows you to trade on the go!
XAU/USD
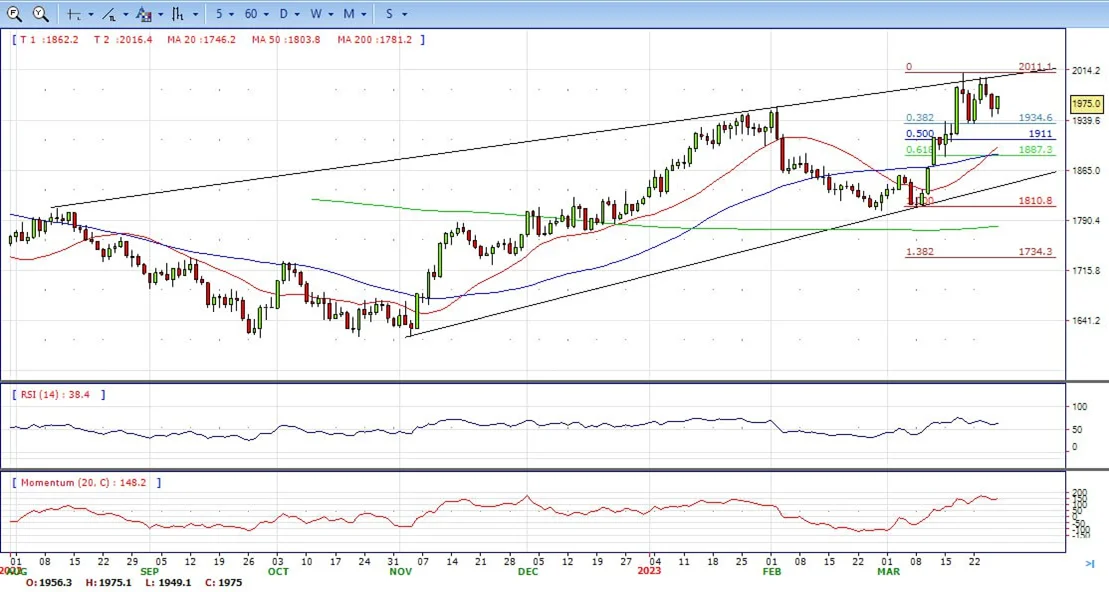
- Gold price has settled above $1,970 in as Tuesday finally brings some stability to the markets. The bright metal extended its retracement on Monday on another volatile day, dipping to $1,944 before closing at $1,974, gaining nearly 1% on the day. It was the seven consecutive days where Gold price range moved near 1%, either up or down.
- Things look calmer now, as central bankers’ speeches were a non-event, and the CB Consumer Confidence in the United States showed modest gains, improving to 104.2 in March from 103.4 in February. Andrew Bailey, Governor of the Bank of England, testified before the Treasury Select Committee in the British Parliament and downplayed the effects of the recent banking stress in the United Kingdom.
- Gold price stabilized around 1974, up for the day and bullish in the daily chart. The gold price still stabilizes above all main SMAs, suggesting bullish strength in short term. Meanwhile, the 20 continued accelerating north and continued developing far above 200 SMA, indicates bulls not exhausted yet. On upside, the immediate resistance is 1980, break above this level will open the gate for more advance to 2010 area.
- From a technical perspective, the RSI indicator holds above the mid-line and stabilizes around 62, on a bullish strength. The Momentum indicator hold in the positive territory, suggests upward potentials. On downside, the immediate support is 1935, below this area may resume the decline to 1919.
MetaTrader 4
MT4 has user friendly interface that is providing simplicity and efficiency. The traders can perform trading strategies for different products like Forex and CFD. MetaTrader 4 has over 50 built-in indicators, also it’s the tool that predicts trends and defines the appropriate entry and exit points.

USD/JPY
- The USD/JPY pair comes under some renewed selling pressure on Tuesday and reverses a major part of the previous day’s goodish recovery gains. Spot prices, however, manage to recover a few pips from the daily low and climb back to the 130.80 mark during the late US session.
- The daily advance in spot comes in contrast to another positive session in US yields across the curve, which manage to add to gains recorded at the beginning of the week, while the JGB 10-year yield remain within a consolidative phase below the 0.40% level. No data releases in Japan on Tuesday left the attention to the US data releases, where the preliminary Goods Trade deficit is seen at $91.63B in January, the House Price Index gauged by the FHFA rose 0.2% MoM in January and the Consumer Confidence measured by the Conference Board surpassed expectations at 104.2 for the current month.
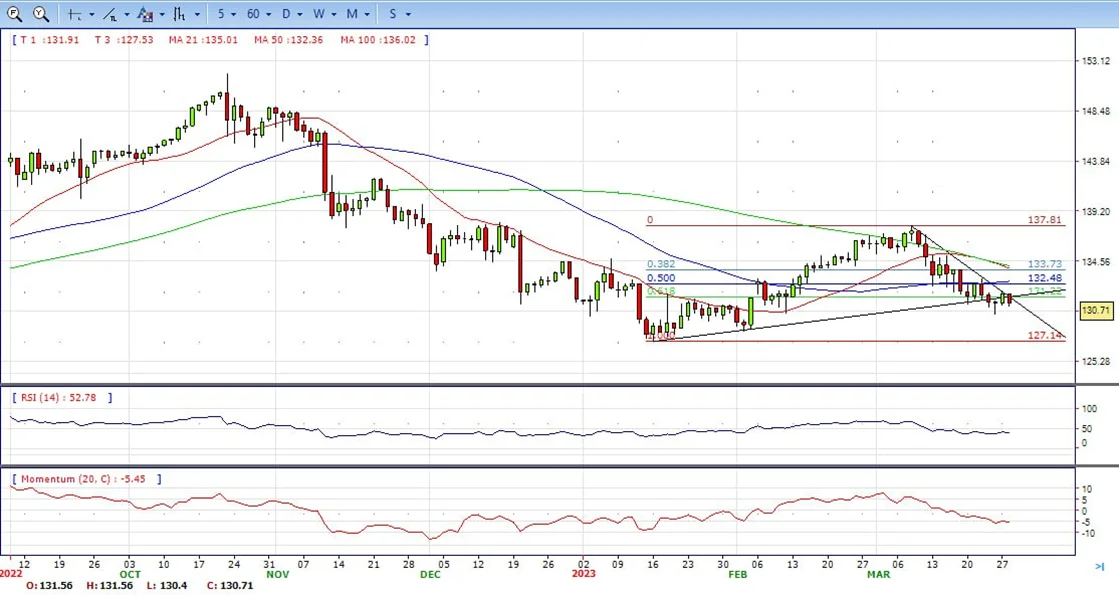
- The USD/JPY pair stabilized around 130.70, down for the day and bearish in the daily chart. The price still stabilizes below 20 and 50 SMA, suggests bearish strength in short term. Meanwhile, 20 SMA continued accelerating south and heading towards longer ones, indicating bears not exhausted. On upside, overcome 131.80 may encourage bulls to challenge 133.00, break above that level will open the gate to 133.80.
- Technical indicators suggest the bearish strength. RSI stabilizes around 40, while the Momentum indicator stabilizes below the midline, suggests downward potentials. On downside, the immediate support is 130.40, break below this level will open the gate to 129.60 area.
DJI
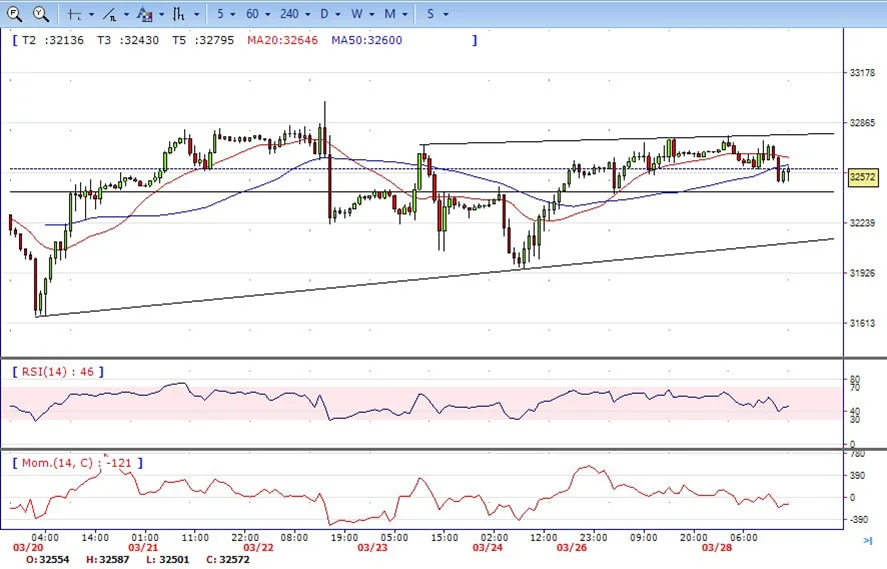
- DJI consolidated in the familiar range, trades between intraday high 32782 area to intraday low 32485. It ended Tuesday around 32620, modestly down for the day and indicates bearish sign in the hourly chart. Right now market is standing below 20 and 50 SMA, suggests bearish strength. Meanwhile, 20 SMA started turning south and heading towards longer ones, suggests bears not exhausted yet. On upside, overcome 32790 may encourage bulls to challenge 33000, break above that level will open the gate to 33270.
- Technical indicators suggest the bearish movement. RSI stabilizes around 49, while the Momentum indicator stabilizes below the midline, suggests downward potentials. On downside, the immediately support is 32400, break below this level will open the gate for more decline to 31950 area.
BRENT
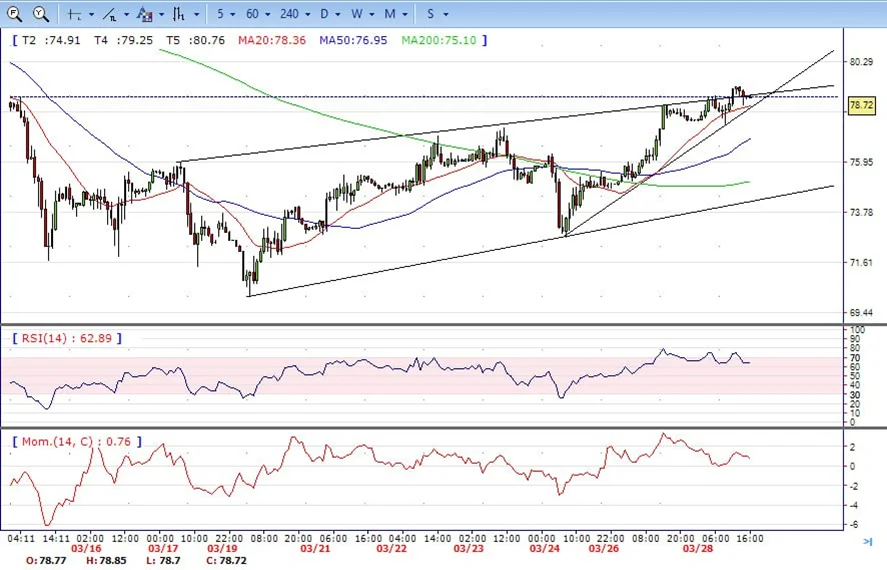
- Brent continued the advance, climbed from intraday low 77.54 area to intraday high 79.20. It holds near the top and ended Tuesday around 78.70, up for the day and indicates bullish sign in the hourly chart. Meanwhile, the 20 and 50 SMA continued accelerating north and trading far below longer ones, indicates bears not exhausted yet. On upside, overcome 79.20 may encourage bulls to challenge 80.50, break above that level will open the gate to 82.00.
- Technical indicators also suggest bullish movement, hovering above the midline. RSI stabilizes at 64, while the Momentum indicator stabilizes in positive territory, suggests upward potentials. On downside, the immediately support is 77.50, break below this level will open the gate for more decline to 76.00 area.
Contact Us
Please, fill the form to get an assistance.


