EUR/USD
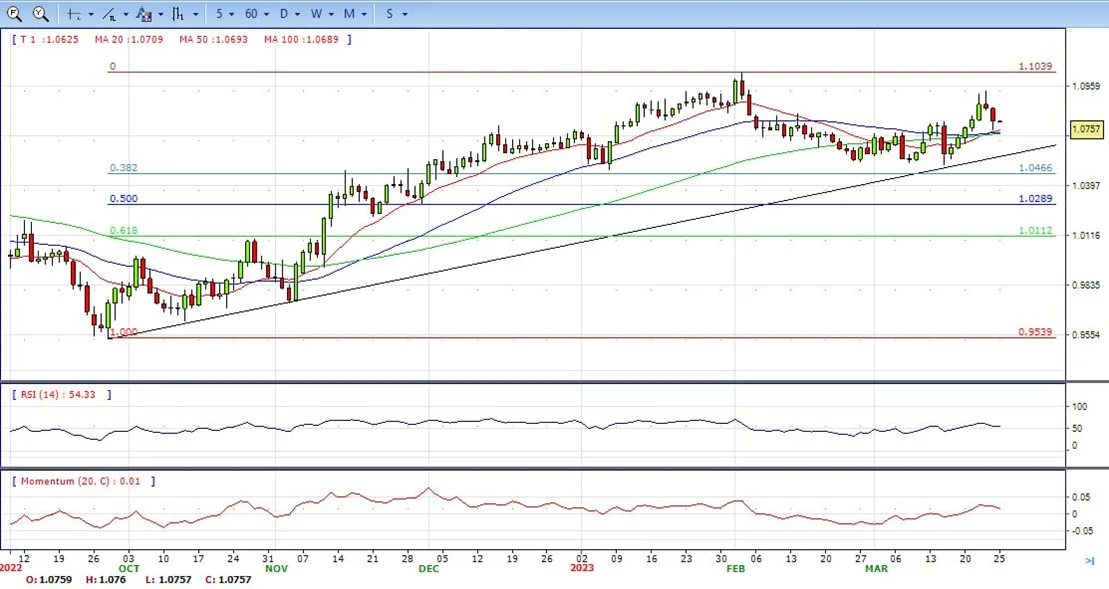
- As the New York session finished, EUR/USD fell 0.64% or 69 pips. A risk-on impulse did not help the Euro, which, pressured by a banking crisis threatening to spread to the Eurozone, weakened the shared currency. At the time of writing, the EUR/USD is trading at 1.0760.
- Despite experiencing another turbulence, the US equities market is poised to finish the week positively. Deutsche Bank’s stock experienced a sharp decline due to concerns over the possibility of default, reflected in a 220 basis point increase in Credit Default Swaps. Although this harmed Wall Street at the beginning of the session, investors appeared to dismiss these fears and instead speculated that the Fed would lower interest rates in 2023.
- The EUR/USD pair is trading near the 1.0760, down for the day with bullish stance in daily chart. The pair stabilized above 20 and 50 SMA, indicates bullish strength. Meanwhile, the 20 SMA started turning north and heading towards 50 and 200 SMA, suggests bulls not exhausted yet. On upside, the immediate resistance is 1.0800, break above this level will extend the advance to 1.0930.
- Technical readings in the daily chart support the bullish stance. The RSI indicator stabilizes around 55. The Momentum indicator holds above the midline, indicating bullish potentials. On downside, the immediate support is 1.0700 and below this level will open the gate to 1.0630.
Open A Demo
CDO has wide range of tools, professional and friendly support for clients to achieve their financial markets trading goals. Open a live account now to enjoy this experience with virtual deposit.
GBP/USD
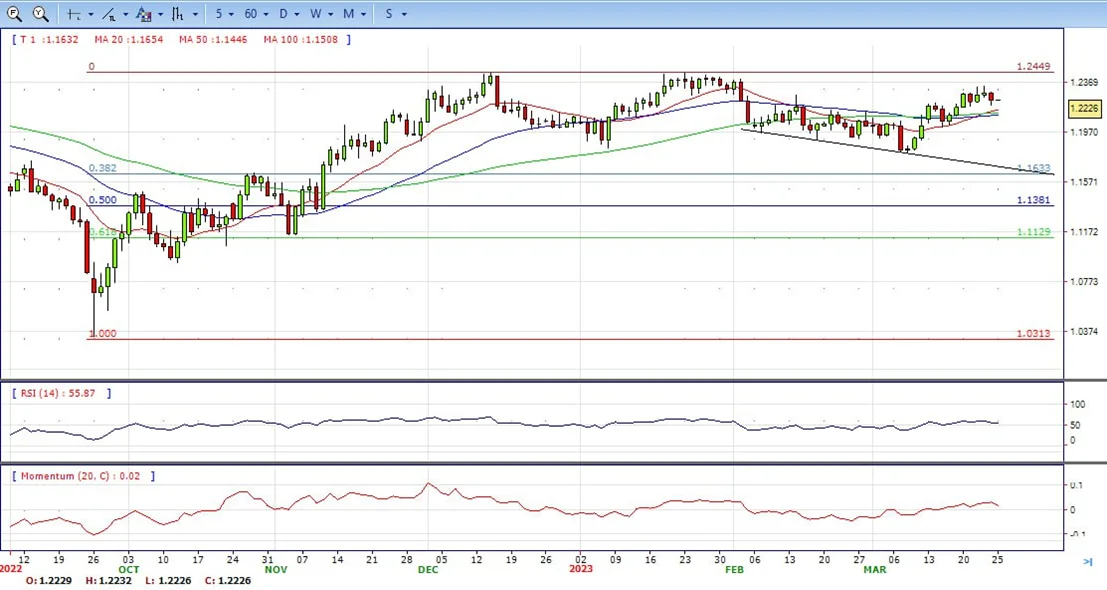
- GBP/USD finished the week on a lower note after it reached 1.234, the high of the week, but retreated as sentiment dampened. On Friday, the GBP/USD is trading at 1.2228, retracing 0.47% at the time of typing.
- On the data front, the US economic calendar featured the S&P Global PMI improved in March, exceeding expectations and the prior’s month data. The Manufacturing Index stood in the contractionary territory. At the same time, Durable Good Orders plunged by 1% but improved compared to the last month’s reading. The UK economic docket featured Retail Sales, which beat estimates on an annual and monthly basis, while the S&P Global PMIs were worse than foreseen. The Manufacturing PMI failed to improve, while the Services and Composite PMIs, ticked slightly down.
- The GBP/USD offers bullish stance in daily chart. Cable stabilizes above 20 and 50 SMA, indicating bullish strength in short term. Meanwhile, the 20 SMA started turning north and heading towards longer ones, suggests bulls not exhausted yet. On upside, the immediate resistance is 1.2340 with a break above it exposing to 1.2450.
- Technical readings in the daily chart support the bullish stances. RSI indicator stabilizes around 55, while the Momentum indicator stabilizes above the midline, suggesting upward potentials. On downside, the immediate support is 1.2170, unable to defend this level will resume the decline to 1.2010.

CDO TRADER
CDO TRADER, our cutting-edge trading platform, follows the technology from the forefront with new features added continuously. Moreover, CDO TRADER is now available for Android and iOS! So it allows you to trade on the go!
XAU/USD
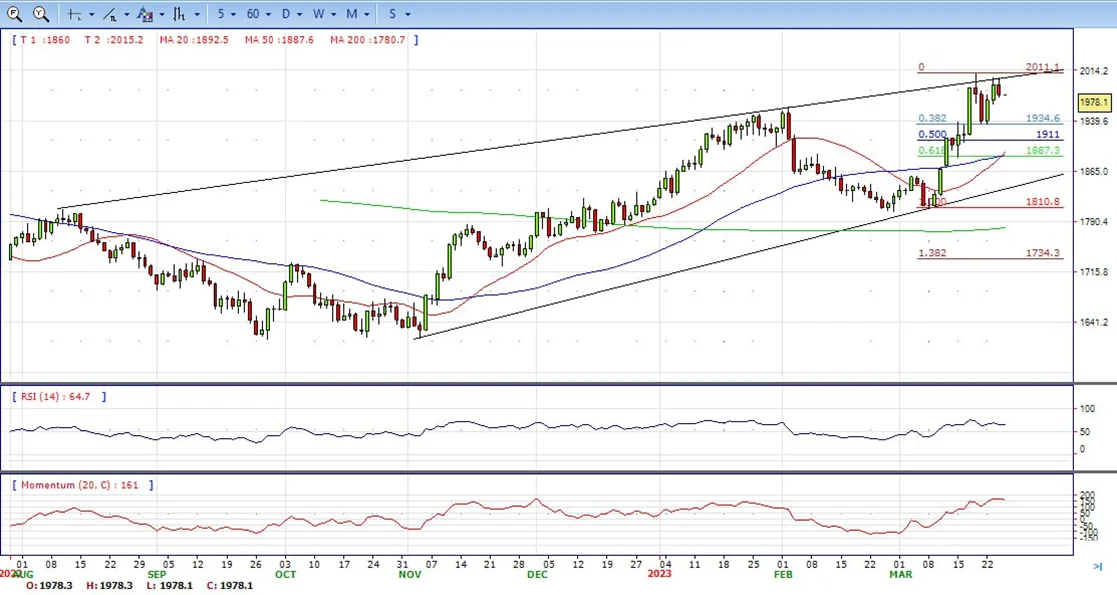
- Gold price renews its intraday low around $1,975 during the first loss-making day in three amid the end of the US session. In doing so, the XAU/USD traces downbeat US Treasury bond yields amid a sluggish end of an active week.
- The Dollar Index has recovered from new monthly lows set on Thursday in the 101.90s, when it formed a bullish hammer candlestick on the daily chart, suggestive of a reversal after March’s sharp decline. The strong bullish confirmation so far displayed on Friday has started to become a negative factor for XAU/USD. Wall Street finished the week with modest gains, and the VIX dropped sharply. Still, regional bank stocks remain under pressure and with the potential to damage confidence significantly. During the weekend, market participants will stay alert on potential banking news. Also, US Treasury Secretary Janet Yellen could be preparing some surprises.
- Gold price stabilized around 1978, down for the day and bullish in the daily chart. The gold price still stabilizes above all main SMAs, suggesting bullish strength in short term. Meanwhile, the 20 continued accelerating north and continued developing far above 200 SMA, indicates bulls not exhausted yet. On upside, the immediate resistance is 2010, break above this level will open the gate for more advance to 2040 area.
- From a technical perspective, the RSI indicator holds above the mid-line and stabilizes around 65, on a bullish strength. The Momentum indicator hold in the positive territory, suggests upward potentials. On downside, the immediate support is 1964, below this area may resume the decline to 1934.
MetaTrader 4
MT4 has user friendly interface that is providing simplicity and efficiency. The traders can perform trading strategies for different products like Forex and CFD. MetaTrader 4 has over 50 built-in indicators, also it’s the tool that predicts trends and defines the appropriate entry and exit points.

USD/JPY
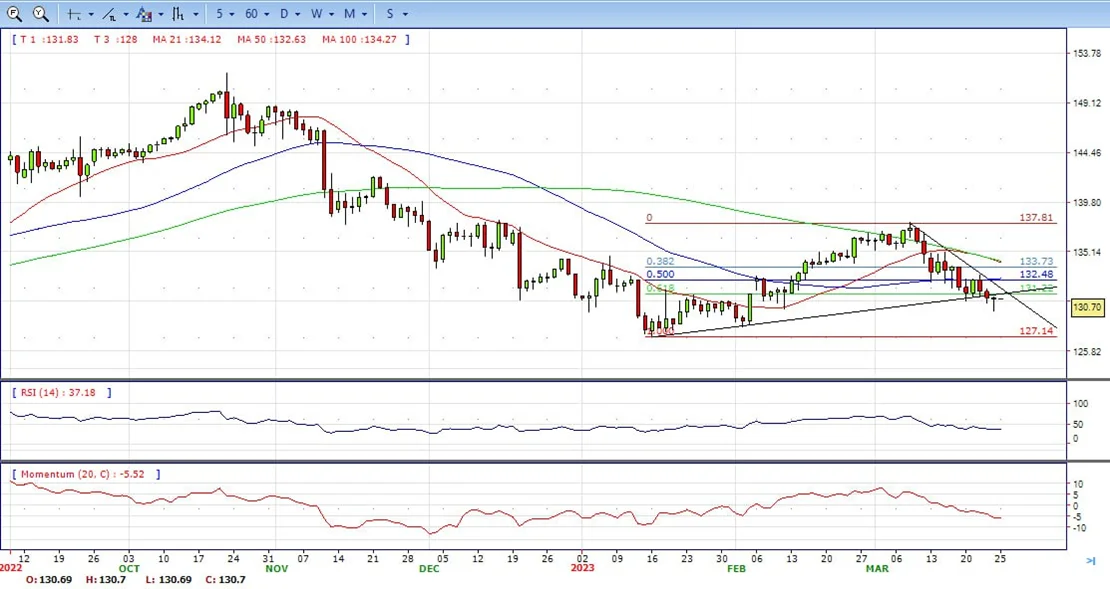
- The USD/JPY pair remains under heavy selling pressure for the third successive day and touches its lowest level since February 03, around the 129.65 region on Friday. Spot prices, however, trim a part of the intraday losses and trade near 130.70 level near the end of North American session, still down nearly 0.30% for the day.
- The Japanese Yen draws support from data showing that an important gauge of Japan’s consumer prices rose at its fastest pace since 1982 in February. Apart from this, a fresh wave of the global risk-aversion trade, amid lingering concerns about a full-blown banking crisis and looming recession risks, provides an additional boost to the safe-haven JPY and drags the USD/JPY pair lower.
- The USD/JPY pair stabilized around 130.70, unchanged for the day and bearish in the daily chart. The price still stabilizes below 20 and 50 SMA, suggests bearish strength in short term. Meanwhile, 20 SMA started turning north and heading towards longer ones, indicating bears not exhausted. On upside, overcome 131.70 may encourage bulls to challenge 133.00, break above that level will open the gate to 133.80.
- Technical indicators suggest the bearish strength. RSI stabilizes around 37, while the Momentum indicator stabilizes below the midline, suggests downward potentials. On downside, the immediate support is 129.60, break below this level will open the gate to 128.00 area.
DJI
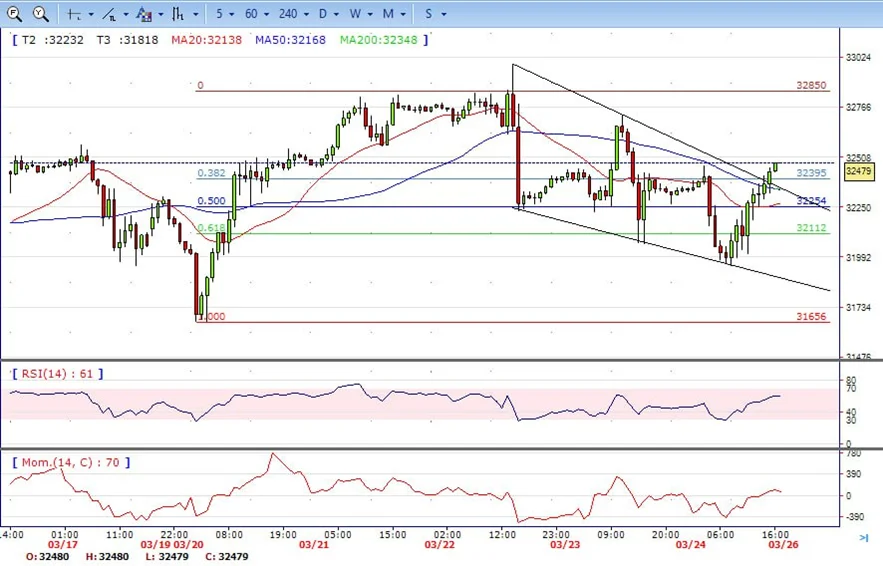
- DJI under the strong sell pressure on the first half of the day, tumbled to intraday low 31945 area. However, it made a U-turn there and surged to intraday low 32480. It holds at the top to ended the week, up for the day and indicates bullish sign in the hourly chart. Right now market is standing above 20 and 50 SMA, suggests bullish strength. Meanwhile, 20 SMA started turning north and heading towards longer ones, suggests bulls not exhausted yet. On upside, overcome 32500 may encourage bulls to challenge 32720, break above that level will open the gate to 33000.
- Technical indicators suggest the bullish movement. RSI stabilizes around 60, while the Momentum indicator stabilizes above the midline, suggests upward potentials. On downside, the immediately support is 31950, break below this level will open the gate for more decline to 31650 area.
BRENT
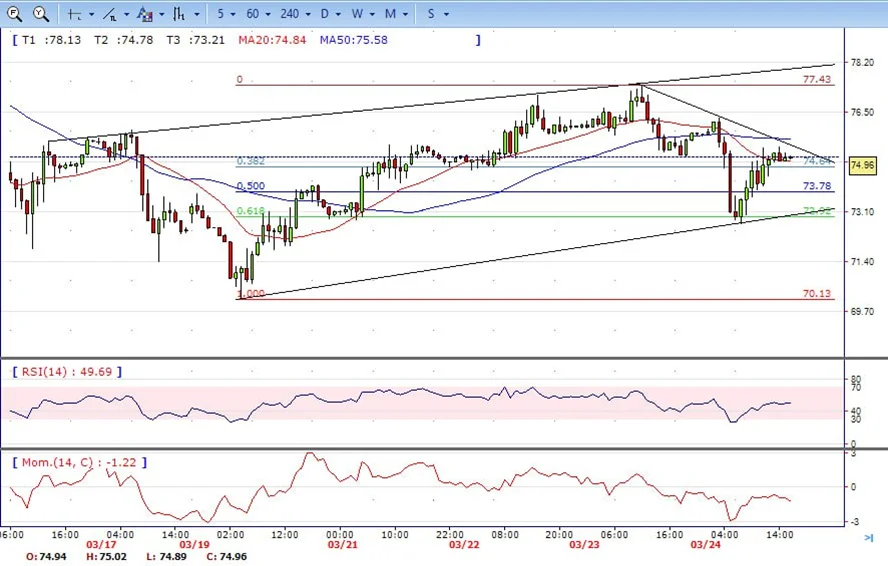
- Brent climbed to intraday high 76.31 on the first half of the day. However, it failed to hold the gains and turned its direction to downside, ended the day around 74.96, down for the day and indicates bearish sign in the hourly chart. Meanwhile, the 20 and 50 SMA continued developing south and trading far below longer ones, indicate bears not exhausted yet. On upside, overcome 76.30 may encourage bulls to challenge 77.40, break above that level will open the gate to 78.70.
- Technical indicators also suggest bearish movement, hovering below the midline. RSI stabilizes at 49, while the Momentum indicator stabilizes in negative territory, suggests downward potentials. On downside, the immediately support is 72.70, break below this level will open the gate for more decline to 71.70 area.
Contact Us
Please, fill the form to get an assistance.


