27/02/2023 Daily Reports
- The downside pressure picks up extra impulse and forces EUR/USD to print new monthly lows in the 1.0545/40 band at the end of the week.
- The selling momentum in EUR/USD gathers extra traction on the back of the unabated advance in the greenback, which lifts the USD Index to fresh highs past the 105.00 barrier after US inflation figures tracked by the PCE came on the strong side in January.
- Indeed, the pair loses further ground after the US headline PCE rose 5.4% in the year to January (from 5.3%) and the Core PCE gained 4.7% from a year earlier, both prints surpassing initial estimates. Further data saw Personal Income expand 0.6% MoM also in January and Persona Spending increase 1.8% vs. the previous month. Later in the session, New Home Sales and the final Michigan Consumer Sentiment print will close the weekly docket across the pond.
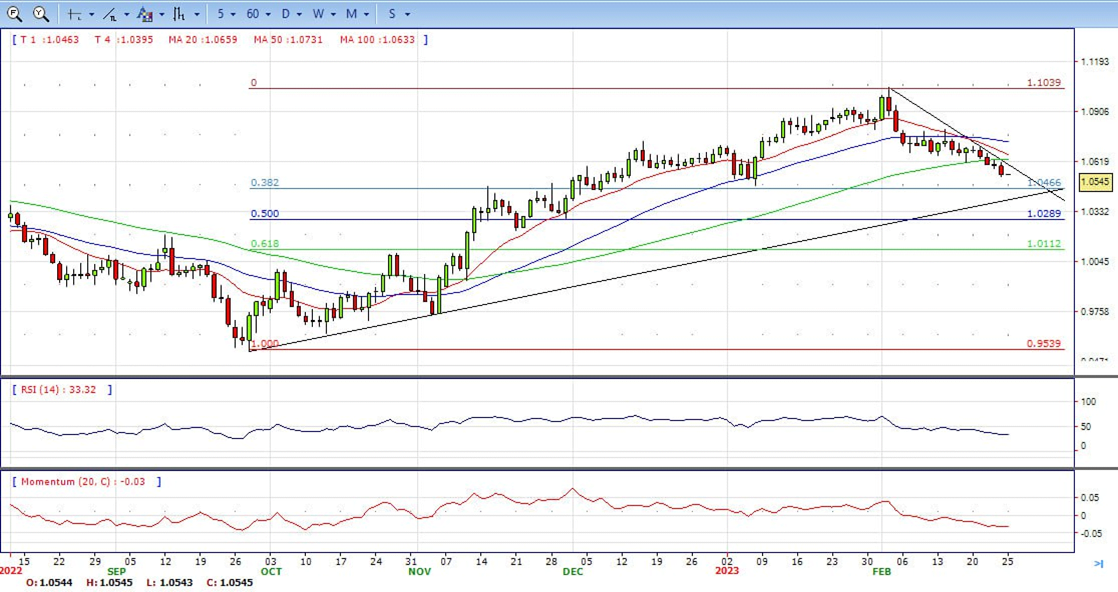
- The EUR/USD pair is trading near the 1.0545, down for the day with bearish stance in daily chart. The pair still stabilized below 20 and 50 SMA, indicates bearish strength. Meanwhile, the 20 SMA started turning south and heading towards longer ones, suggests bears not exhausted yet. On upside, the immediate resistance is 1.0630, break above this level will extend the advance to 1.0700.
- Technical readings in the daily chart support the bearish stance. The RSI indicator stabilizes around 34. The Momentum indicator holds below the midline, indicating downward potentials. On downside, the immediate support is 1.0540 and below this level will open the gate to 1.0470.
- The GBP/USD dropped further on Friday following the release of US economic data and bottomed at 1.1927, the lowest level in a week, and slightly above the monthly low.
- The pound is consolidating weekly losses amid a stronger US Dollar and higher US yields. US activity and inflation figures above consensus favoured expectations of higher for longer interest rates. As a consequence, the 2-year Treasury yield jumped to the highest since November at 4.79% and the 10-year moved toward 4%.
- The dollar on Friday accelerated to the upside also boosted by a deterioration in market sentiment. The GBP/USD broke decisively below 1.2000. It is hovering around 1.1940/50, down almost a hundred pips for the level it had a week ago.
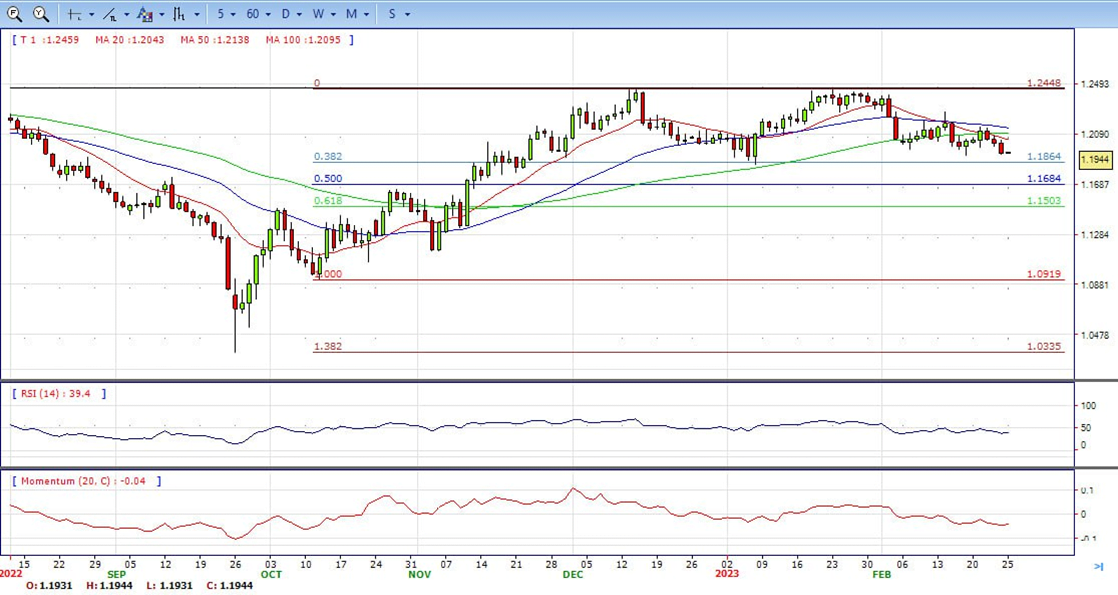
- The GBP/USD offers bearish stance in daily chart. Cable stabilizes below 20 and 50 SMA, indicating bearish strength in short term. Meanwhile, the 20 SMA continued accelerating south and heading towards longer ones, suggests bears not exhausted yet. On upside, The immediate resistance is 1.2050 with a break above it exposing to 1.2150.
- Technical readings in the daily chart support the neutral to bearish stances. RSI indicator stabilizes around 40, while the Momentum indicator stabilizes below the midline, suggesting downward potentials. On downside, the immediate support is 1.1910, unable to defend this level will resume the decline to 1.1840.


- Gold prices dropped further after the beginning of the American session amid a stronger US Dollar and higher Treasury bond yields following data that showed the core PCE rose at the highest rate in six months, above expectations.
- The downside extended following the January Personal Income and Spending. The numbers came in above expectations. Market participants looked into inflation numbers. The Federal Reserve’s preferred inflation gauge, the core PCE rose by 0.6%, to an annual rate of 4.7%, up from the 4.6% of December and against expectations of a decline.
- The Dollar gained momentum after the economic numbers, US yields soared and equity prices tumbled. The context added pressure to gold that is fighting to hold above $1,810. The 2-year Treasury yield is at 4.79%, the highest since November and the 10-year is at 3.93%.
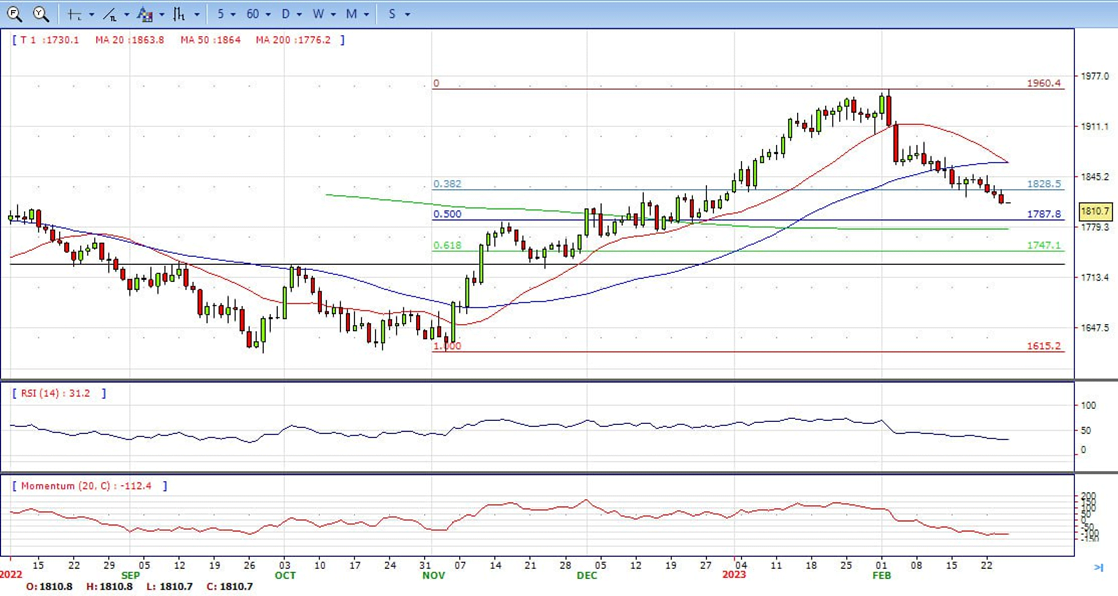
- Gold price stabilized around 1810, down for the day and bearish in the daily chart. The gold price stabilized below 20 and 50 SMA, suggesting bearish strength in short term. Meanwhile, the 20 SMA continued accelerating south and heading towards longer ones, indicating bears not exhausted yet. On upside, the immediate resistance is 1830, break above this level will open the gate for more advance to 1860 area.
- From a technical perspective, the RSI indicator holds below the mid-line and stabilizes around 32, on a bearish strength. The Momentum indicator hold below the midline, suggests downward potentials. On downside, the immediate support is 1800, below this area may resume the decline to 1788.


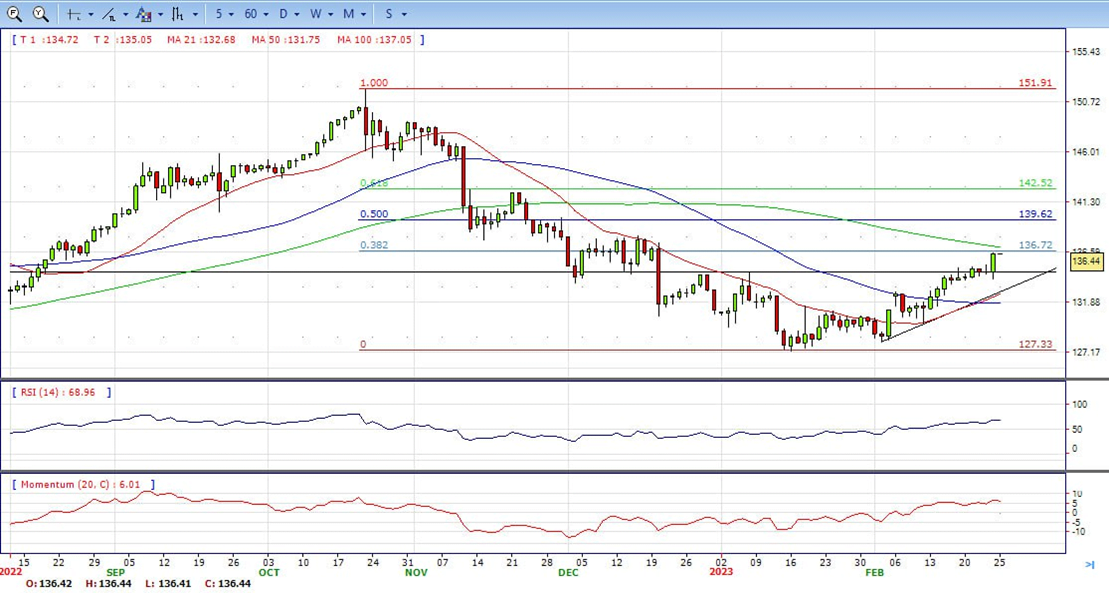
- After having spent the European trading hours near 135.00, USD/JPY gathered bullish momentum in the early American session on Friday and reached its highest level since December 20 at 136.46. As of writing, the pair was trading at 136.40, where it was up 1.2% on a daily basis.
- Earlier in the day, incoming Bank of Japan Governor Kazuo Ueda said that a weak Japanese Yen would support exports, inbound tourism and some service sectors. Ueda added that they would need to normalize the monetary policy if inflation makes headway toward 2%. Since the data from Japan revealed that the National Core CPI edged higher to 4.2% on a yearly basis in January from 4% in December, these comments failed to help the Yen gather strength.
- In the second half of the day, the US Bureau of Economic Analysis reported that the annual Personal Consumption Expenditures (PCE) Price Index rose to 5.4% in January from 5.3% in December (revised from 5%). Additionally, the Core PCE Price Index, the Fed’s preferred gauge of inflation, rose 0.6% on a monthly basis and lifted the annual rate to 4.7% from 4.6%.
- The USD/JPY pair stabilized around 136.40, unchanged for the day and bullish in the daily chart. The stabilizes above 20 and 50 SMA, suggests bullish strength in short term. Meanwhile, 20 SMA continued accelerating north and heading towards longer ones, indicating bulls not exhausted. On upside, overcome 136.70 may encourage bulls to challenge 138.20, break above that level will open the gate to 139.60.
- Technical indicators suggest the bullish strength. RSI stabilizes around 68, while the Momentum indicator stabilizes in the positive territory, suggests upward potentials. On downside, the immediate support is 135.20, break below this level will open the gate to 134.00 area.
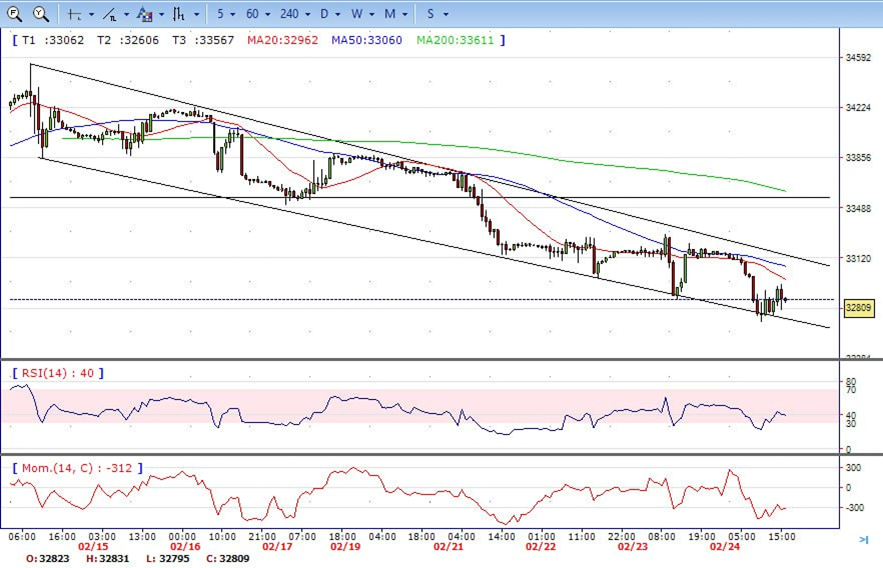
- DJI continued under the sell pressure on the last hour of the day, retreated to low 32650 area. It recovered modestly and ended Friday around 32800, down for the day and indicates bearish sign in the hourly chart. Right now market is standing below 20 and 50 SMA, maintains the downward slope, suggests bearish strength. Meanwhile, 20 and 50 SMA continued accelerating south and developing far below 200 SMA, suggests bears not exhausted yet. On upside, overcome 33000 may encourage bulls to challenge 33270, break above that level will open the gate to 33550.
- Technical indicators suggest the bearish movement. RSI stabilizes around 41, while the Momentum indicator stabilizes below the midline, suggests downward potentials. On downside, the immediately support is 32650, break below this level will open the gate for more decline to 32400 area.
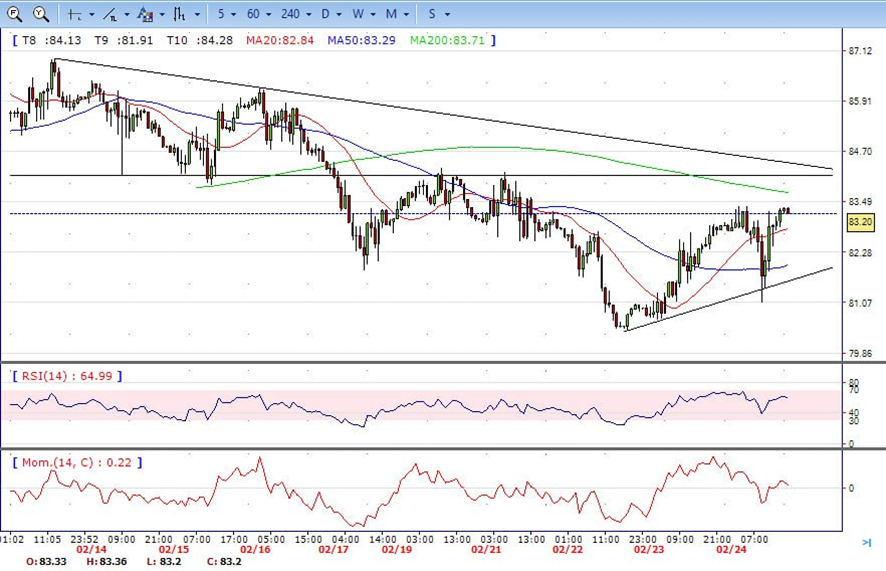
- The Brent tumbled to intraday low 81.10 area on the first half of the day. It then reversed the direction and recovered all the losses, ended Friday around 83.20. The price currently stabilizes above 20 and 50 SMA, suggests bullish strength in the hourly chart. Meanwhile, the 20 SMA started turning north and continued developing above longer ones, indicates bulls not exhausted yet. On upside, overcome 83.40 may encourage bulls to challenge 84.30, break above that level will open the gate to 85.70.
- Technical indicators also suggest bullish movement, hovering above the midline. RSI climbs to 58, while the Momentum indicator stabilizes in positive territory, suggests downward potentials. On downside, the immediately support is 81.70, break below this level will open the gate for more decline to 80.40 area.