26/10/2022 Daily Reports
- The EUR/USD advances sharply due to a soft US Dollar blamed on the Fed’s pivot narrative surrounding the financial markets. Also, solid US corporate earnings keep investors’ mood positive, despite the ongoing global economic slowdown. At the time of writing, the EUR/USD is trading at 0.9966 after hitting a three-week high at around 0.9976, still bullish in the daily chart.
- US equities remain trading in the green, supported by earnings. Meanwhile, US economic indicators continue to paint a gloomy picture for the economy, as conditions in the housing market continue to dampen, albeit Fed officials prepare to slow down the pace of tightening. According to St. Louis Fed President James Bullard, discussions of “where the Fed should go and then become data-dependent” will be held at the November meeting.
- In the meantime, early in the US session, housing data reported that prices cooled down, reflecting the impact of higher borrowing costs, given that the Fed had tightened 300 bps during the year. The S&P CoreLogic Case Shiller Price Index for August increased by 13%, less than July’s 15.6%, while the Federal Housing Finance Agency showed that home prices in August rose by 11.9% YoY, lower than the previous month’s 13.9%.
- The EUR/USD pair is trading near the 0.9966, up for the day with the bullish stance in daily chart. The pair stabilized above 20 and 50 SMA, indicates bullish strength. Meanwhile, the 20 SMA started turning north and heading towards longer ones, suggests bulls not exhausted yet. On upside, the immediate resistance is 1.0000, break above this level will extend the advance to 1.0070.
- Technical readings in the daily chart support the neutral to bullish stances. The RSI indicators hovering above the midlines and stabilized around 59. The Momentum indicator stabilized in the positive territory, indicating upward potentials. On downside, the immediate support is 0.9800 and below this level will open the gate to 0.9700.

- The pound has surged from levels right above 1.1300 on Tuesday’s early US market session, rallying all the way to 1.1500 where it seems to have found some resistance. The pair appreciates about 1.70% on the day to erase previous losses and test its highest levels in more than one month.
- The victory of Rishi Sunak in the Tory race and his pledge to restore economic stability are bringing back confidence to the markets, terrified with his predecessor’s economic plan. The re-appointment of Jeremy Hunt as chancellor of the exchequer has increased hopes that the next cabinet will be more market-friendly, which is acting as a tailwind for the British pound.
- On the other end, the weaker-than-expected US housing prices and consumer confidence data on Tuesday, coupled with the downbeat S&P PMIs released on Monday are increasing concerns about the negative impact on the economy of the Federal Reserve’s radical tightening pace. These latest figures are offering further reasons for the Central Bank to take its foot off the pedal over the coming months.
- The GBP/USD offers bullish stance in daily chart. Cable now is stabilizing above 20 and 50 SMA, indicating bullish strength in short term. Meanwhile, the 20 SMA started turning north and heading towards longer ones, suggests bulls not exhausted yet. On upside, The immediate resistance is 1.1500 with a break above it exposing to 1.1600.
- Technical readings in the daily chart support the bullish stances. RSI indicator stabilized around 56, while the Momentum indicator stabilized above the midline, suggesting upward potentials. On downside, the immediate support is 1.1300, unable to defend this level will resume the decline to 1.1050.


- Gold price advances steadily during the North American session, though it remains capped below the 20 SMA, despite falling US Treasury yields underpinning the yellow metal prices, as gold recovers after hitting a daily low of $1638.40. At the time of writing, the XAU/USD is trading at $1653 a troy ounce, above its opening price by 0.24%.
- The sentiment is upbeat, as shown by global equities trading in the green. As previously mentioned, market players are positioning for a possible Fed pivot, while economic data in the US continues to show further deterioration in the country, which, coupled with high inflation and lower bond yields, boosted gold prices.
- On Tuesday, US economic data flashed that the housing market, as shown by housing prices cooling down due to higher mortgage rates, which climbed to almost 7%, as the Fed embarked on a tightening cycle trying to tame inflation. Further data revealed by the Conference Board (CB), reported that Consumer Confidence dropped from 107.8 to 102.%, less than estimates of 105.9, decreasing for the second consecutive month, according to the survey.
- Gold price stabilized around 1650, down for the day and bearish in the daily chart. The gold price stabilized below 20 and 50 SMA, suggesting bearish strength. Meanwhile, the 20 SMA continued developing far below longer ones despite it started turning flat, indicating bears not exhausted yet. On upside, the immediate resistance is 1670, break above this level will open the gate to extend the advance to 1685 area.
- From a technical perspective, the RSI indicator hold below the midline and stabilized around 44, suggesting bearish strength. The Momentum indicator struggled above the midline, suggests upward potentials. On downside, the immediate support is 1614, below this area may resume the decline to 1600.


- The greenback dropped sharply across the board on Tuesday and the USD/JPY retreated from levels right below 149.00 to session lows at 147.50, where the pair has found buyers to attempt to regain the 148.00 level.
- The US dollar plunged in the early US session on Tuesday following downbeat US housing prices and consumer confidence readings. These figures and the disappointing S&P PMI index released on Monday have revived fears that the Federal Reserve might be damaging growth with its radical monetary tightening plan.
- Investor’s hopes that the Fed might be open to slowing down its rate hike path over the next months have boosted risk appetite. US stock markets extended gains after a mixed opening, while Treasury yields retreated, weighing on the USD.
- The USD/JPY pair stabilized around 148.00, down for the day and bullish in the daily chart. The price still maintains the upward slope and stabilized above all main SMAs, suggests bullish strength. Meanwhile, 20 SMA continued accelerating north and developing above longer ones, indicating bulls not exhausted in the long term. On upside, overcome 149.70 may encourage bulls to challenge 152.00, break above that level will open the gate to 153.00.
- Technical indicators suggest the bullish strength. RSI stabilized around 59, while the Momentum indicator continued developing above the midline, suggests upward potentials. On downside, the immediate support is 145.30, break below this level will open the gate to 144.00 area.

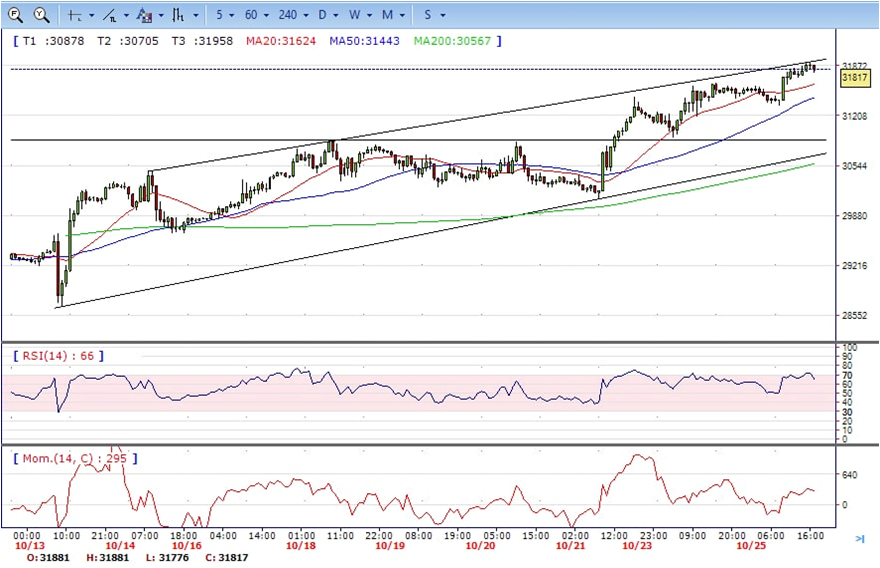
- DJI continued the advance, jumped from the intraday low 31350 area to 31914 daily high. It retreated modestly and ended Monday at around 31800, up for the day and bullish in the hourly chart. It stabilized above all main SMAs, suggests bullish strength. Meanwhile, 20 SMA continued accelerating north and developing above longer one, suggests bulls not exhausted yet. On upside, overcome 31900 may encourage bulls to challenge 32200, break above this level will open the gate to 32700.
- Technical indicators suggest the bullish strength. RSI stabilized around 64, while the Momentum indicator stabilized above the midline, suggests upward potentials. On downside, the immediate support is 31600, break below this level will open the gate for more decline to 31350 area.
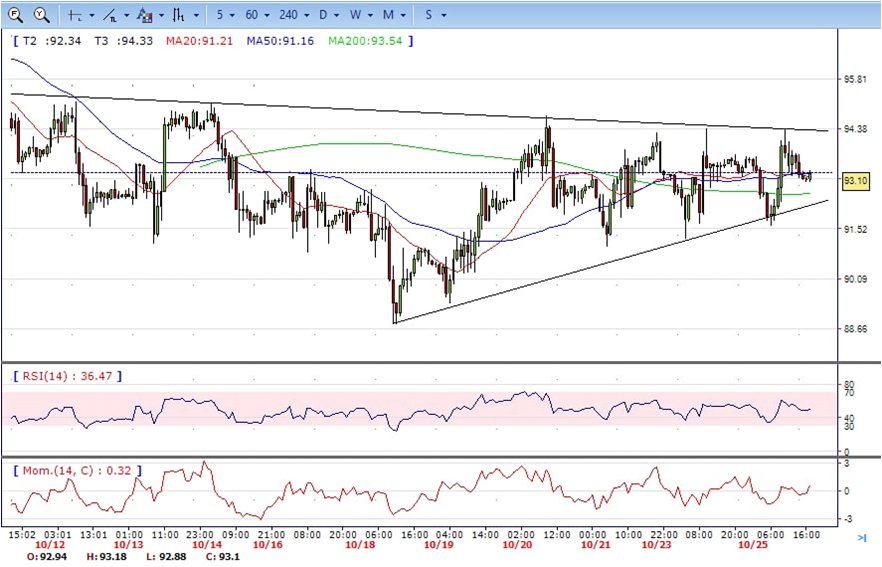
- Brent still consolidated in the familiar range , jumped from intraday low 91.60 to intraday high 94.40, it trimmed some gains and ended Tuesday at around 93.10, unchanged for the day and neutral in the hourly chart. The price stabilized around 20 and 50 SMA, suggests neutral strength in short term. Meanwhile, the 20 SMA continued developing above longer ones despite it started turning flat, indicating bulls not exhausted yet. On upside, overcome 94.50 may encourage bulls to challenge 96.50, break above this level will open the gate to 98.60.
- Technical indicators suggest the bullish movement, hovering above the midline. RSI stabilized around 50, while the Momentum indicator stabilized in positive territory, suggests upward potentials. On downside, the immediate support is 91.00, break below this level will open the gate for more decline to 90.00 area.