26/09/2022 Daily Reports
- The EUR/USD nosedives below the 0.9800 figure, extending its losses below the 0.9700 figure, triggered by traders’ worries that Fed’s aggression would tip the US economy into a recession, while the UK announced a plan aimed to lift stimulate the economy. It ended the week around 0.9685, bearish in the daily chart.
- On Wednesday, the US Fed lifted the Federal funds rate (FFR) by 75 bps and emphasized that it will “keep at it” to tame inflation. In the same meeting, Fed officials estimated that the FFR would likely end at 4.4%, meaning that 125 bps of rate hikes are pending.
- Data-wise, the US S&P Global PMIs for September flashed that the US economy is in contractionary territory but showed some improvement. The Manufacturing PMI expanded by 51.8, above forecasts, while the Services and Composite indices improved but fell short of expansionary territory.
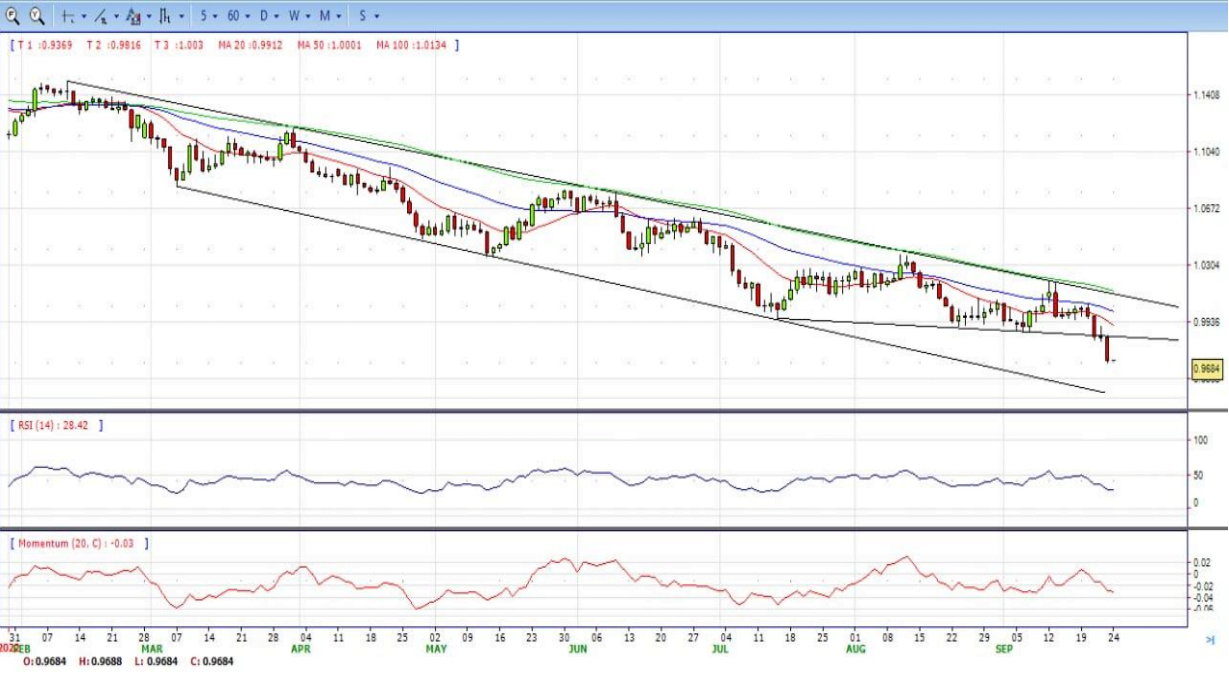
- The EUR/USD pair is trading near the 0.9685, down for the day with the neutral to bearish stance in daily chart. The pair stabilized below 20 and 50 SMA, indicates bearish strength in short term. Meanwhile, 20 SMA started turning flat but continued developing below longer ones, suggests bears not exhausted yet. On upside, the immediate resistance is 0.9900, break above this level will extend the advance to 1.0000.
- Technical readings in the daily chart support the bearish stances. The RSI indicators hovering below the midlines and stabilized around 28, shows bearish strength. The Momentum indicator stabilized below the midline, indicating downward potentials. On downside, the immediate support is 0.9600 and below this level will open the gate to 0.9500.
- GBP/USD came under heavy bearish pressure and lost more than 350 pips on the day. It tended the week around 1.0850, down for the day and still bearish in the daily chart.
- Earlier in the day, the data from the UK revealed that the business activity in the private sector continued to contract in early September with the preliminary Composite PMI dropping to 48.4 from 49.6 in August. This reading came in below the market expectation of 49.
- In addition to dismal UK data, the intense flight to safety provides a boost to the dollar and further weighs on the pair. US stock index futures were last seen losing between 1.3% and 1.6% on the day, suggesting that safe-haven flows are likely to continue to dominate the financial markets.
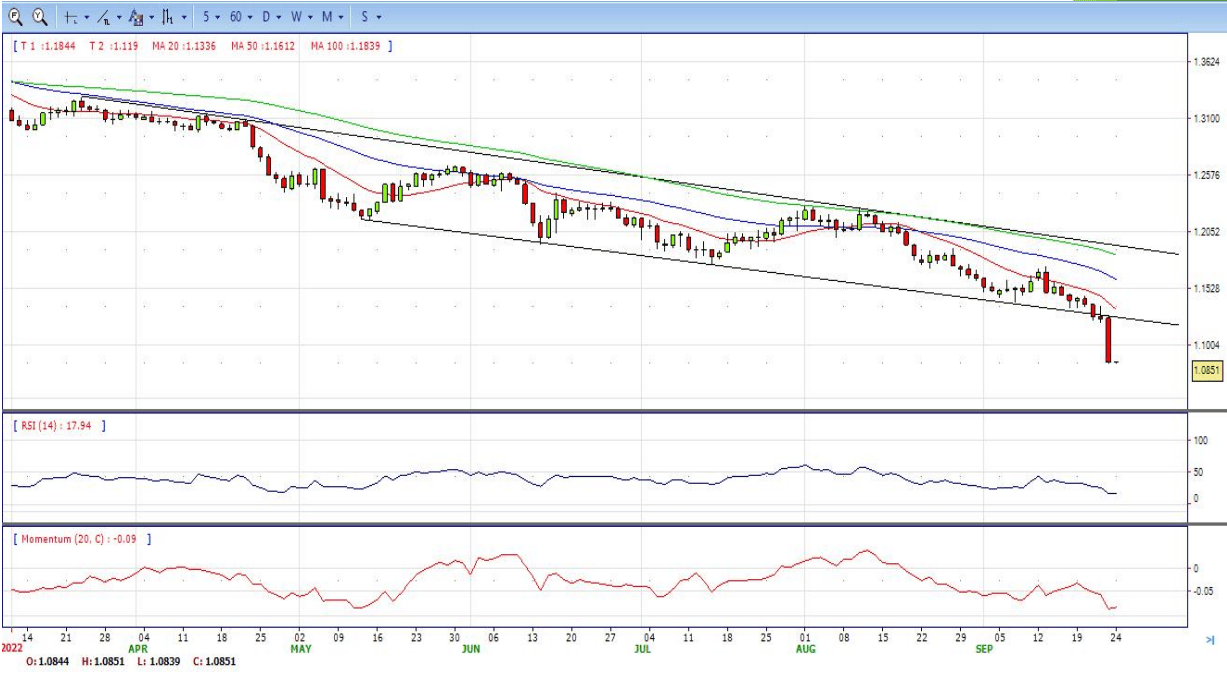
- The GBP/USD offers bearish stance in daily chart, it maintains the downward slope and now is stabilized below all main SMAs, indicating bearish strength. Meanwhile, the 20 SMA continued accelerating south and developing far below longer ones, suggesting bears not exhausted yet. On upside, the immediate resistance is 1.0950 with a break above it exposing to 1.1100.
- Technical readings in the daily chart support the bearish stances. RSI indicator stabilized around 17, while the Momentum indicator stabilized below the midline, suggesting downward potentials. On downside, the immediate support is 1.0800, unable to defend this level will resume the decline to 1.0700.

- Gold drops to its lowest level since April 2020, around the $1,641 area on Friday and confirms a fresh breakdown below a one-week-old trading range. It ended the week around $1,643, still bearish in the daily chart.
- The relentless US dollar buying remains unabated on the last day of the week amid expectations for a more aggressive policy tightening by the Fed. In fact, the USD Index, which measures the greenback’s performance against a basket of currencies, hits a fresh 20-year peak and is seen driving flows away from the dollar-denominated gold.
- The US central bank earlier this week signalled that it will hike interest rates at a faster pace to combat stubbornly high inflation. A number of other major central banks also delivered rate increases this week, which continues to lift government bond yields. This exerts additional downward pressure on the non-yielding gold.
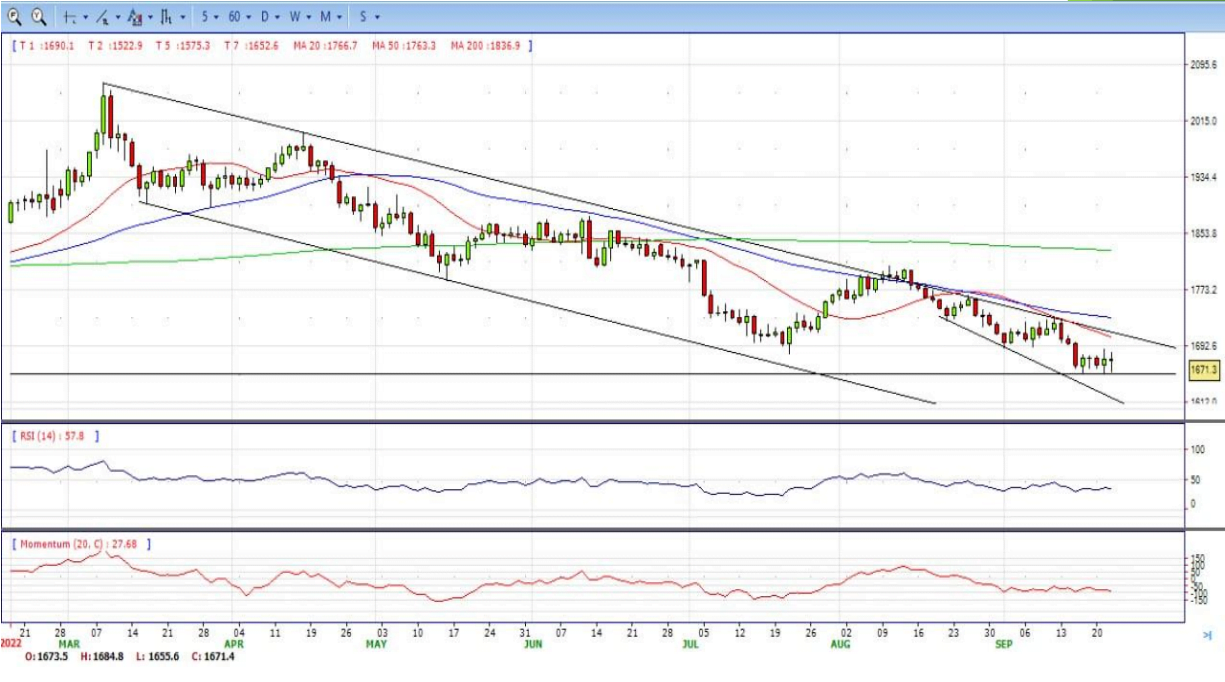
- Gold price stabilized around 1643, down for the day and bearish in the daily chart. The gold price stabilized below all main SMAs, suggesting bearish strength in short term. Meanwhile, the 20 SMA continued accelerating south and developing below longer ones, indicating bears not exhausted yet. On upside, the immediate resistance is 1688, break above this level will open the gate to extend the advance to 1735 area.
- From a technical perspective, the RSI indicator holds below the midline and stabilized around 30, suggesting bearish strength. The Momentum indicator struggled below the midline, suggests bearish potentials. On downside, the immediate support is 1640, below this area may resume the decline to 1610 level.


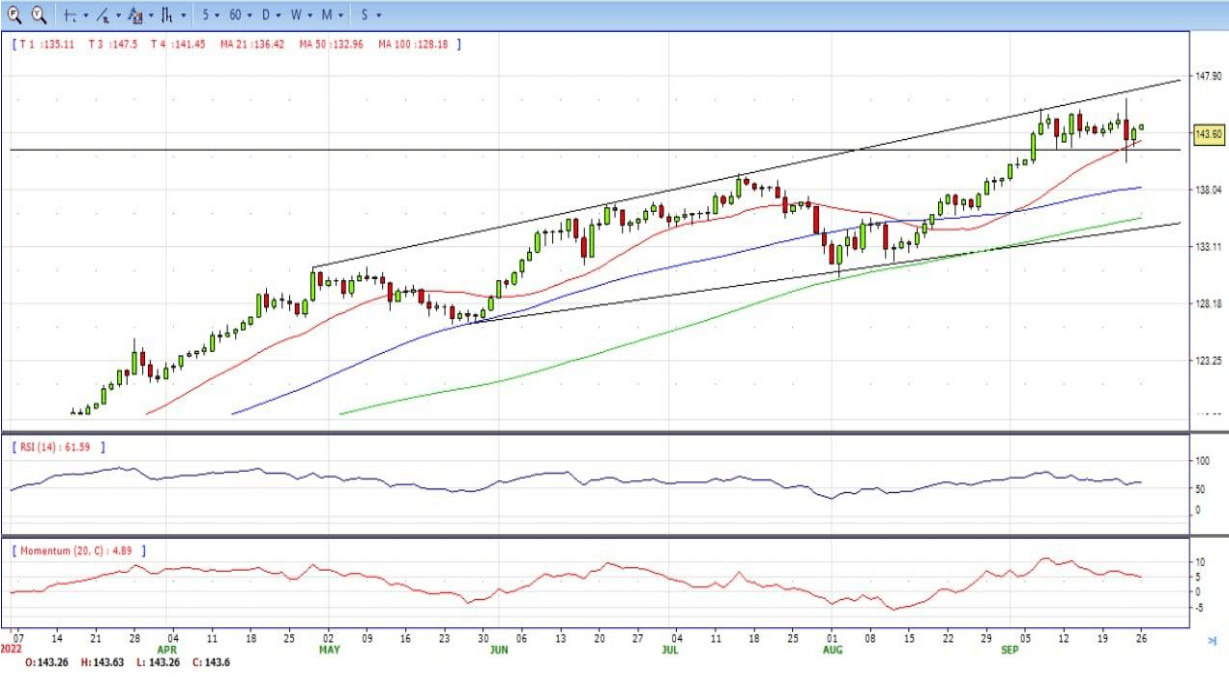
- The USD/JPY is rising on Friday amid tensions across financial markets. The pair found support above 142.50 and it is testing daily highs near the 143.30 area at the end of the week, still bullish in the daily chart.
- Usually, when markets drop sharply the yen is the best performer, but this is not the case on Friday. The dollar is the best performer. It confirmed gains following the better-than-expected PMI S&P Global numbers for September. The DXY is approaching 113.00, up 1.30%, while EUR/USD and GBP/USD trade at fresh cycle lows.
- The USD/JPY is about to end the week with a modest gain and far from the top. The intervention from Japanese authorities to boost the yen explains the move away from the recent multi-year highs. The key driver in the rally continues to be the divergence in monetary policy between the Bank of Japan and the Federal Reserve. The BoJ kept its accommodative policy unchanged on Thursday, while the Fed raised interest rates by 75 basis points.
- The USD/JPY pair stabilized around 143.30, up for the day and bullish in the daily chart. The price still maintains the upward slope and stabilized above all main SMAs, suggests bullish strength. Meanwhile, 20 SMA continued accelerating north and developing above longer ones, indicating bulls not exhausted in the long term. On upside, overcome 143.40 may encourage bulls to challenge 145.00, break above that level will open the gate to 146.00.
- Technical indicators suggest the bullish strength. RSI stabilized around 61, while the Momentum indicator continued developing above the midline, suggests upward potentials. On downside, the immediate support is 141.50, break below this level will open the gate to 140.30 area.


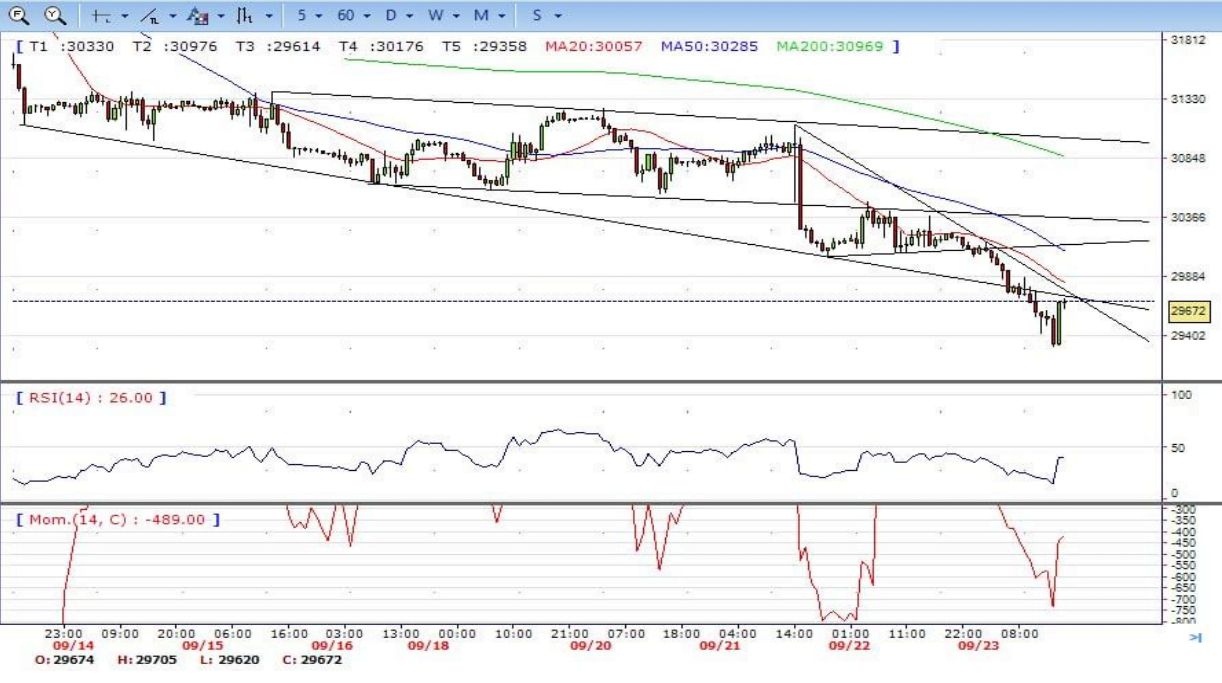
- DJI still under the sell pressure, It tumbled to intraday low 29314 area, lost more than 800 pips. It then trimmed some losses and ended the week around 29670, still bearish in the hourly chart. It stabilized below 20 and 50 SMA, suggests bearish strength. Meanwhile, the 20 SMA continued accelerating south and developing below longer ones, suggesting bears not exhausted yet. On upside, overcome 29780 may encourage bulls to challenge 30050, break above that level will open the gate to 30250.
- Technical indicators suggest the bearish strength, developing below the midline. RSI stabilized around 40, while the Momentum indicator stabilized in negative territory, suggests downward potentials. On downside, the immediate support is 29300, break below this level will open the gate for more decline to 29000 area.
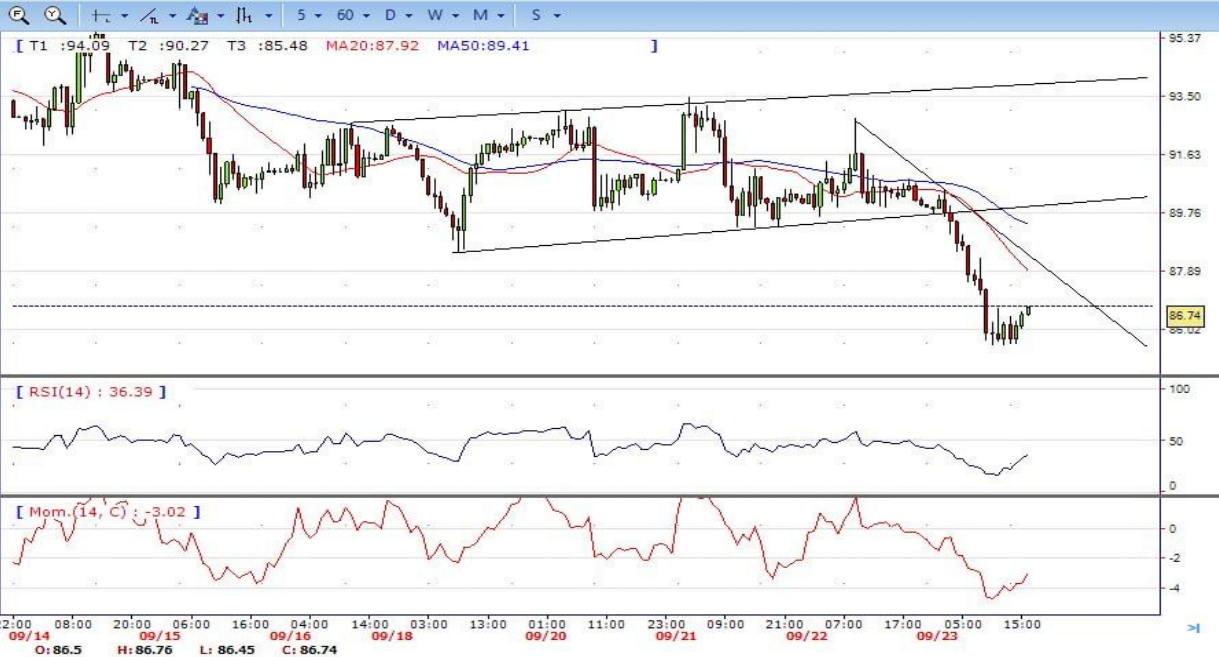
- Brent under the strong sell pressure, tumbled to intraday low 85.50 area. It recovered some losses and ended Friday around 86.75, bearish in the hourly chart. The price stabilized below 20 and 50 SMAs, suggests bearish strength in short term. Meanwhile, the 20 SMA continued accelerating south and developing below longer ones, indicating bears not exhausted yet. On upside, overcome 88.35 may encourage bulls to challenge 90.00, break above this level will open the gate to 91.00.
- Technical indicators suggest the bearish movement, hovering below the midline. RSI stabilized around 36, while the Momentum indicator continued developing below the midline, suggests downward potentials. On downside, the immediate support is 85.50, break below this level will open the gate for more decline to 84.00 area.