

26/06/2023 Daily Reports
- The Euro (EUR) and other assets with risk associations remain on the defensive, although EUR/USD manages to regain some balance and seems to have set sail to the 1.0900 region near the close in Wall Street on Friday.
- The Euro’s decline was intensified by disappointing figures from the advanced Manufacturing and Services PMIs in France, Germany and the broader Euroland for June. These poor results reignited concerns about a possible recession in the region. On the other hand, the US Dollar gained strength as the USD Index reached new highs just above the 103.00 mark. This was supported by the prevailing bearish sentiment in the risk-linked galaxy and the consistent hawkish stance of Federal Reserve officials, including Chief Jerome Powell.
- The EUR/USD pair is trading near the 1.0895, down for the day with bullish stance in daily chart. The pair stabilized above all main SMAs, indicates bullish strength. Meanwhile, the 20 SMA continued accelerating north and heading towards 50 and 200 SMA, suggests bulls not exhausted yet. On upside, the immediate resistance is 1.1010, break above this level will extend the advance to 1.1100.
- Technical readings in the daily chart support the bullish stance. The RSI indicator stabilizes around 53. The Momentum indicator holds above the midline, indicating upward potentials. On downside, the immediate support is 1.0840 and below this level will open the gate to 1.0800.

- GBP/USD extended its losses in the late New York session, dropping around 0.30% meanders at around 1.2700, amid growing recession woes in the UK as data showed business activity deceleration. That, alongside an aggressive 50 bps rate hike by the BoE as a response to stubborn inflation, weighed on the Pound Sterling. At the time of writing, the GBP/USD exchanges hands at 1.2714.
- Wall Street is set to finish the week with losses. Risk aversion surfaced as readings of business activity across Europe and the US, although remaining at expansionary territory, it slowed down, spurring recessionary fears. The US S&P Global Manufacturing PMI plunged to 46.3, below the prior month’s data, while the Services and Composite PMI expanded by 54.1 and 53, but both numbers were below the forecasts.
- The GBP/USD offers bullish stance in daily chart. Cable stabilizes above 20 and 50 SMA, indicating bullish strength in short term. Meanwhile, the 20 and 50 SMA started turning flat but continued developing above longer ones, suggests bulls not exhausted yet. On upside, the immediate resistance is 1.2850 with a break above it exposing to 1.3000.
- Technical readings in the daily chart support the bullish stances. RSI indicator stabilizes around 60, while the Momentum indicator stabilizes above the midline, suggesting upward potentials. On downside, the immediate support is 1.2680, unable to defend this level will resume the decline to 1.2550.


- Gold price recovers some ground after falling to new three-month lows of $1910 overnight, while US bond yields retreat after printing weekly highs, spurred by central bank tightening. Global data revealed the economic slowdown, sparking recessionary fears. The XAU/USD is trading at $1920, gains 0.3%.
- Investor’s sentiment shifted sour, as shown by global equities printing losses. Data delivered worldwide, but particularly in the US, showed that business and manufacturing activity is deteriorating, as reported by June’s S&P Global Manufacturing, Services, and Composite PMIs. In the meantime, the inversion of the US 2s-10s yield curve fell as much as ten bps, signalling that market participants are pricing in a recession in the United States. That dampened the market sentiment on Wall Street, as the three major US equity indices dropped between 0.64% and 1.13%.
- Gold price stabilized around 1920, up for the day and bearish in the daily chart. The gold price stabilizes below 20 SMA, suggesting bearish strength in short term. Meanwhile, the 20 SMA continued accelerating south and developing below 50 SMA, indicates bears not exhausted yet. On upside, the immediate resistance is 1938, break above this level will open the gate for more advance to 1960 area.
- From a technical perspective, the RSI indicator holds below the midline and stabilizes around 39, on a bearish strength. While the Momentum indicator also stabilized in the negative territory, suggests downward potentials. On downside, the immediate support is 1900, below this area may resume the decline to 1885.


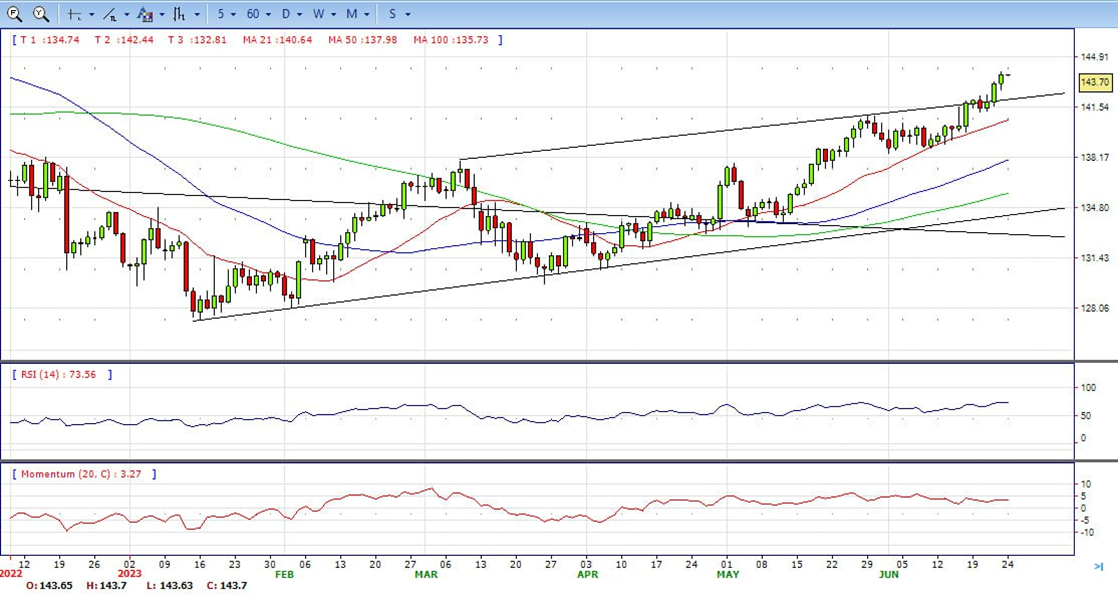
- The USD/JPY pair surged to a multi-month high, reaching its highest level since November 2022, near 143.90. This significant jump came in the wake of the US Manufacturing PMI for June, which plummeted to a five-month low and fuelled a negative market sentiment. This, coupled with disappointing Japanese inflation figures, exerted downward pressure on the JPY.
- According to a recent S&P Global report, the US PMIs for June delivered a mixed performance. The Manufacturing PMI fell to a five-month low of 46.3, missing expectations of 48.3. On a positive note, the Services PMI slightly exceeded market expectations, registering 54.1 compared to the anticipated 54. Additionally, the Global Composite PMI came in lower than expected at 53 instead of the projected 54.4.
- The USD/JPY pair stabilized around 143.70, up for the day and bullish in the daily chart. The price stabilizes above 20 and 50 SMA, suggests bullish strength in short term. Meanwhile, 20 SMA continued accelerating north and developing above longer ones, indicating bulls not exhausted. On upside, overcome 144.00 may encourage bulls to challenge 145.50, break above that level will open the gate to 147.00.
- Technical indicators suggest the bullish strength. RSI stabilizes around 73, while the Momentum indicator stabilizes above the midline, suggests upward potentials. On downside, the immediate support is 142.60, break below this level will open the gate to 141.20 area.
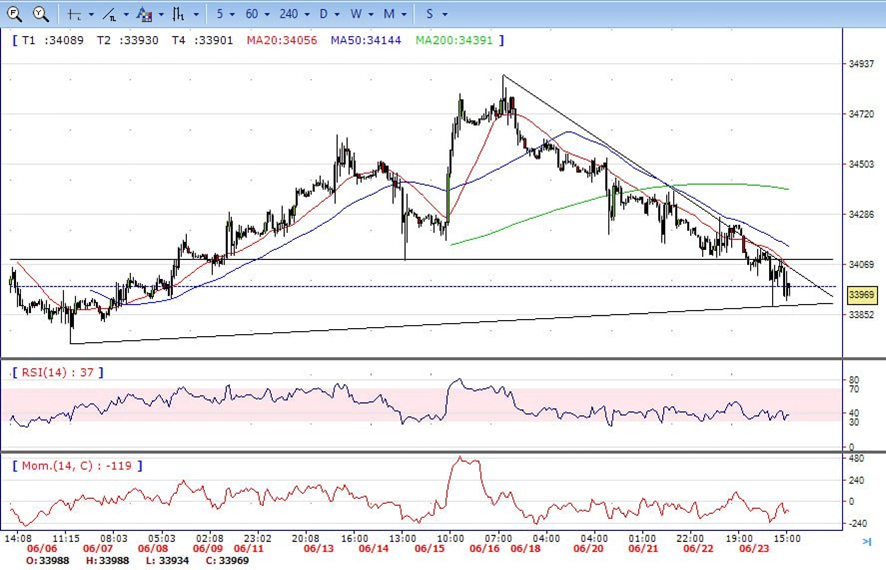
- DJI continued under the sell pressure on Friday, declined from intraday high 34240 level to low 33890, then trimmed some losses and ended the day around 33970, below 50 and 200 SMA, suggests bearish strength. Meanwhile, 20 SMA continued accelerating south and developing below longer ones, suggests bears not exhausted yet. On upside, overcome 34400 may encourage bulls to challenge 34620, break above that level will open the gate to 34900.
- Technical indicators suggest the bearish movement. RSI stabilizes around 37, while the Momentum indicator stabilizes below the midline, suggests downward potentials. On downside, the immediately support is 33890, break below this level will open the gate for more decline to 33730 area.
- Brent under the strong sell pressure on the first half of the day, tumbled from intraday high 74.25 to intraday low 72.12. It then bounced from here and trimmed all the losses, end the day around 74.30, modestly up for the day and stabilized above 20 SMA, indicates bullish sign in the hourly chart. However, the 20 SMA started turning flat but continued developing far below longer ones, indicates bears not exhausted yet. On upside, overcome 74.50 may encourage bulls to challenge 75.40, break above that level will open the gate to 77.25.
- Technical indicators suggest bullish movement, hovering above the midline. RSI stabilizes at 55, while the Momentum indicator stabilizes above the midline, suggests upward potentials. On downside, the immediately support is 73.60, break below this level will open the gate for more decline to 72.10 area.


