

25/11/2022 Daily Reports
- EUR/USD was last up 0.1% at 1.0405, and has stuck to a range of between 1.0381 and 1.0448 while US markets are closed on Thursday for Thanksgiving and liquidity will likely be thinner than usual until Asia and Frankfurt crossover on Friday.
- The euro held onto gains after the minutes of the European Central Bank’s October meeting showed policymakers feared that inflation may be getting entrenched. This leaves the divergence between the Federal Reserve and the ECB thinner and may favour an upside bias for the euro for the medium term. In this regard, The U. Dollar has extended losses on Thursday after the minutes from the Federal Reserve’s November meeting supported the view that the Fed will start to relax the pace of rate hikes into smaller increments, starting as soon as the next meeting in mid-December.
- The dollar index DXY, which measures the greenback against six major peers, was down 0.2% at 105.87, after sliding 1.1% on Wednesday. As Reuters noted, ”the Fed has taken interest rates to levels not seen since 2008 but slightly cooler-than-expected US consumer price data has stoked expectations of a more moderate pace of hikes.” Consequently, the US Dollar index slide 5.2% in November, putting it on track for its worst monthly performance in 12 years.
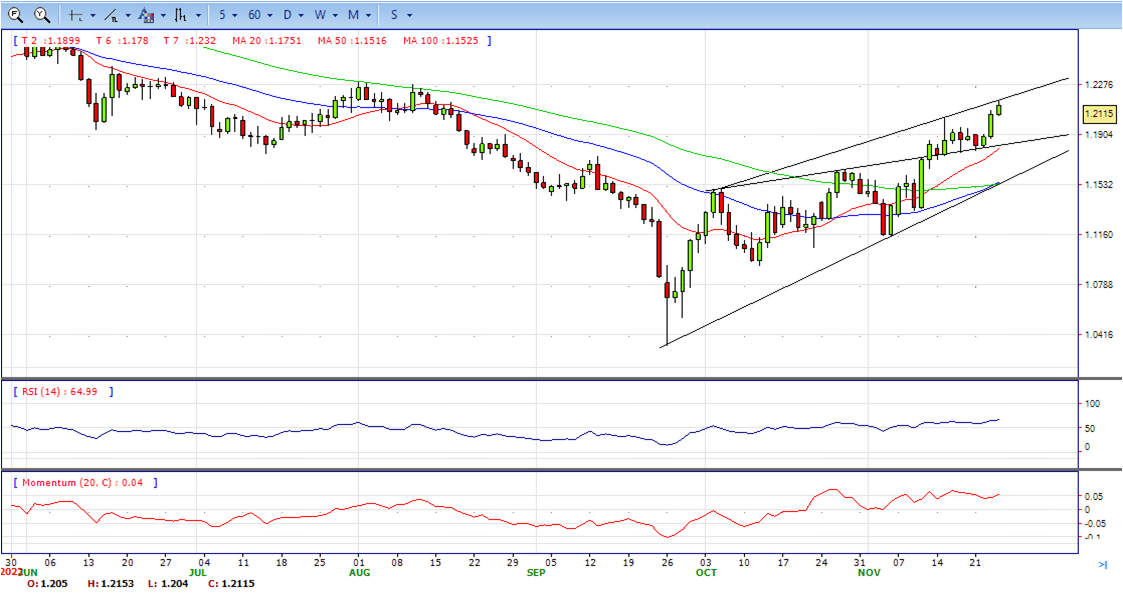
- The EUR/USD pair is trading near the 1.0400, up for the day with bullish stance in daily chart. The pair stabilized above 20 and 50 SMA, indicates bullish strength. Meanwhile, the 20 SMA continued accelerating north and developing above longer ones, suggests bulls not exhausted yet. On upside, the immediate resistance is 1.0480, break above this level will extend the advance to 1.0600.
- Technical readings in the daily chart support the bullish stances. The RSI indicators hovering above the midline and stabilized around 65. The Momentum indicator stabilized above the midline, indicating upward potentials. On downside, the immediate support is 1.0300 and below this level will open the gate to 1.0200.

- The GBP/USD rose further during the American session and hit at 1.2152, the highest level since mid-August. It is up rising for the third consecutive day. While the Pound holds to recent gains, the US Dollar is under pressure.
- The US Dollar continues to slide following the FOMC minutes released on Wednesday. Expectations that the US central bank might slow the pace of rate hikes after four 75 basis points hikes weighed on the Greenback and boosted Treasuries. The Fed will likely continue to raise rates as inflation remains elevated and far from the target.
- On Thursday, price action is limited on Thanksgiving Day. Wall Street is closed and Friday will see a shortened session.
- The GBP/USD offers bullish stance in daily chart. Cable still stabilized above all main SMAs, indicating bullish strength in short term. Meanwhile, the 20 SMA continued accelerating north and developing above longer ones, suggests bulls not exhausted yet. On upside, The immediate resistance is 1.2150 with a break above it exposing to 1.2300.
- Technical readings in the daily chart support the bullish stances. RSI indicator stabilized around 67, while the Momentum indicator stabilized above the midline, suggesting upward potentials. On downside, the immediate support is 1.2020, unable to defend this level will resume the decline to 1.1900.


- Gold Price advanced steadily on Thursday amidst thin liquidity conditions courtesy due to the observance of the Thanksgiving holiday in the United States (US), with Wall Street and the bond market closed. Factors like Federal Reserve (Fed) policymakers agreeing to moderate interest-rate increases and a risk-on mood keep the US Dollar (USD) on the defensive. Therefore, XAU/USD is trading at $1756 a troy ounce at the time of writing.
- On Wednesday, the Federal Reserve revealed its latest minutes, which showed that officials are ready to begin hiking rates on smaller sizes after lifting the Federal Funds rate (FFR) by 75 bps four times in 2022. Even though the minutes are slightly dovish, investors should know that Federal Reserve officials are uncertain how high rates will end, with most policymakers expressing that 5% could be the peak for some participants.
- On Wednesday, the Federal Reserve revealed its latest minutes, which showed that officials are ready to begin hiking rates on smaller sizes after lifting the Federal Funds rate (FFR) by 75 bps four times in 2022. Even though the minutes are slightly dovish, investors should know that Federal Reserve officials are uncertain how high rates will end, with most policymakers expressing that 5% could be the peak for some participants.
- Gold price stabilized around 1756, up for the day and bullish in the daily chart. The gold price still stabilized above 20 and 50 SMA, suggesting bullish strength. Meanwhile, the 20 SMA continued accelerating north and developing above longer ones, indicating bulls not exhausted yet. On upside, the immediate resistance is 1787, break above this level will open the gate to extend the advance to 1800 area.
- From a technical perspective, the RSI indicator hold above the midline and stabilized around 64, suggesting bullish strength. The Momentum indicator stabilized above the midline, suggests upward potentials. On downside, the immediate support is 1730, below this area may resume the decline to 1700.


- The USD/JPY is hovering around 138.15/20, holding a bearish tone on the back of a weaker Dollar but also amid a stronger Japanese yen. The pair bottomed at 138.04, the lowest since November 15, before bouncing modestly to the upside.
- The US Dollar has been under pressure since Wednesday. The FOMC minutes added to the negative tone. Expectations that the Fed might slow the pace of interest rate hikes as soon as the next meeting, December 13/14 weighed on the Dollar and boosted Treasuries. The US 10-year yield fell to as low as 3.68% approaching the monthly low. The DXY is falling by 0.35%, trading at 105.75, headed toward the lowest daily close since mid-August.
- The decline in bond yields boosted the Japanese yen across the board. The currency is among the top performers on a quiet session. Wall Street is closed due to a holyday in the US. No economic data is due in the US for the rest of the week. In Japan, on Friday, the Tokio Consumer Price Index will be released. It will be a shortened session in Wall Street that will resume normal activity on Monday.
- The USD/JPY pair stabilized around 138.50, down for the day and bearish in the daily chart. The price still maintains the downward slope and develops below all main SMAs, suggests bearish strength in short term. Meanwhile, 20 SMA continued accelerating south and heading towards longer ones, indicating bears not exhausted. On upside, overcome 140.00 may encourage bulls to challenge 141.00, break above that level will open the gate to 141.60.
- Technical indicators suggest the bearish strength. RSI stabilized around 34, while the Momentum indicator continued developing below the midline, suggests downward potentials. On downside, the immediate support is 137.60, break below this level will open the gate to 136.00 area.

- DJI consolidates in the very tight range due to US holiday, trades between 34220 to 34300 range and ends Thursday at around 34250, unchanged for the day and bullish in the hourly chart. The price stabilized above all main SMAs, suggests bullish strength. Meanwhile, 20 continued accelerating north and developing above longer ones, suggests bulls not exhausted yet. On upside, overcome 34330 may encourage bulls to challenge 34600, break above this level will open the gate to 34800.
- Technical indicators suggest the bullish strength. RSI stabilized around 54, while the Momentum indicator stabilized above the midline, suggests upward potentials. On downside, the immediate support is 34000, break below this level will open the gate for more decline to 33800 area.

- Brent consolidated in the tight range due to US holiday, trades between intraday high 85.50 to intraday low 83.90 area. It ended thursday at around 85.20, unchanged for the day and bearish in the hourly chart. The price stabilized below 50 SMA and struggled near 20 SMA, suggests bearish strength in short term. Meanwhile, the 20 SMA continued developing far below 50 SMA despite it started turning flat, indicating bearish bias. On upside, overcome 86.00 may encourage bulls to challenge 88.00, break above this level will open the gate to 90.00.
- Technical indicators suggest the bearish movement, hovering below the midline. RSI stabilized at around 47, while the Momentum indicator stabilized below the midline, suggests downward potentials. On downside, the immediate support is 83.90, break below this level will open the gate for more decline to 82.40 area.


