25/05/2023 Daily Reports
- EUR/USD is mixed on the Federal Open Market Committee minutes that show the board members agreed that inflation risks are still unacceptably high but officials also generally agreed that the extent of further hikes are less certain. EUR/USD was testing 1.0750 and the lows of the day on the knee-jerk but has since turned up into the 1.0760s at the end of the day.
- Fed staffs in Fed continue to forecast mild recession starting later this year, followed by a modestly-paced recovery. Participants generally agreed that the extent to which further interest rate hikes may be appropriate had become less certain. They agreed that inflation was unacceptably high, and are declining slower than they had expected. Overall, the Fed minutes show officials split on support for more hikes. As such, the market is directionless.
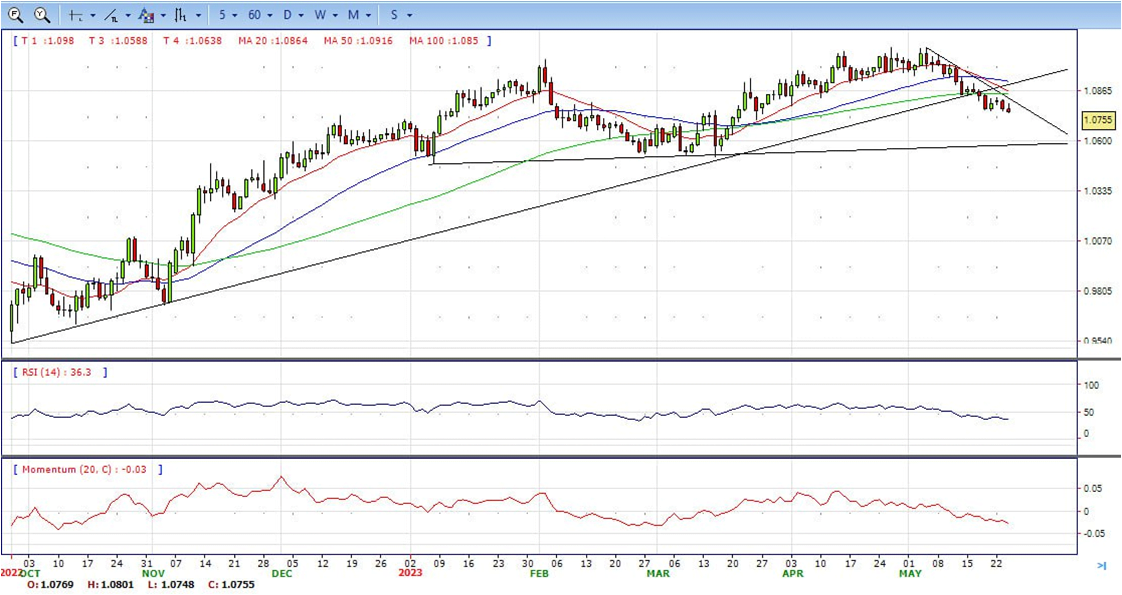
- The EUR/USD pair is trading near the 1.0755, down for the day with bearish stance in daily chart. The pair stabilized below 20 and 50 SMA, indicates bearish strength. Meanwhile, the 20 SMA started turning south and heading towards 50 and 200 SMA, suggests bears not exhausted yet. On upside, the immediate resistance is 1.0850, break above this level will extend the advance to 1.0900.
- Technical readings in the daily chart support the bearish stance. The RSI indicator stabilizes around 36. The Momentum indicator holds below the midline, indicating bearish potentials. On downside, the immediate support is 1.0710 and below this level will open the gate to 1.0630.
- GBP/USD is down some 0.28% ahead of the Federal Open Market Committee minutes that come out at the top of the hour. The pair has sunk from a high of 1.2469 and has reached a low of 1.2357 so far.
- The minutes could be a catalyst for a move higher in the US Dollar reflecting a hawkish bias at the Fed. There will also be a number of Fed speakers in the coming days that could tilt the bias further in favour of the US Dollar bulls. On the other hand, there are a number of variables, including the debt ceiling debacle and the recent slew of less bad UK economic data which led to an upgrade of the BoE’s UK GDP and inflation forecasts at its May policy meeting could keep the pair underpinned.
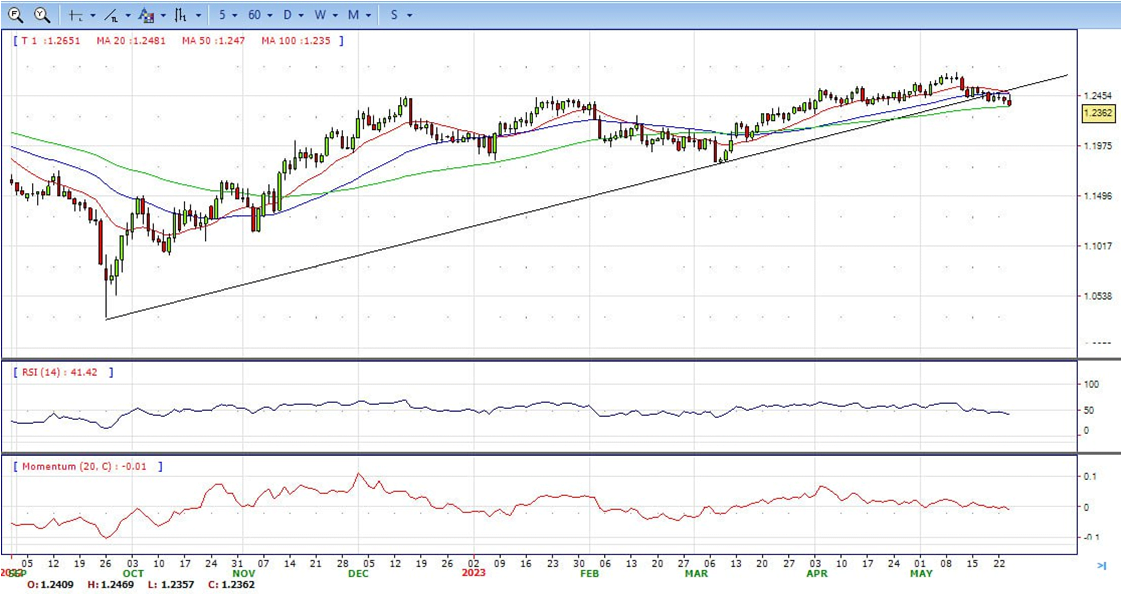
- The GBP/USD offers bearish stance in daily chart. Cable stabilizes below 20 and 50 SMA, indicating bearish strength in short term. Meanwhile, the 20 SMA started turning south and heading towards longer ones, suggests bears not exhausted yet. On upside, the immediate resistance is 1.2470 with a break above it exposing to 1.2550.
- Technical readings in the daily chart support the bearish stances. RSI indicator stabilizes around 42, while the Momentum indicator stabilizes below the midline, suggesting downward potentials. On downside, the immediate support is 1.2350, unable to defend this level will resume the decline to 1.2270.


- Gold price faces solid resistance at $1976, retraces some of its earlier gains after hitting a daily high of $1985. Talks between the US Congress and the White House failed to provide any relief; hence market participants are triggering toward safe-haven assets, not being Gold one of them. At the time of writing, XAU/USD is trading at $1960, down by 0.77%.
- Wall Street continues to print losses as sentiment remains dented by the political uncertainty in the United States. Several reports on Tuesday updated that talks between President Biden and US House Speaker McCarthy did not make much progress. Divisions are seen in spending cuts proposed by the Republicans, while the White House is pushing for more taxes as part of the agreement. In the meantime, the US Dollar Index, advance 0.25%, up at 103.776, above its 200-day Exponential Moving Average (EMA) for the first time since March 15, 2023.
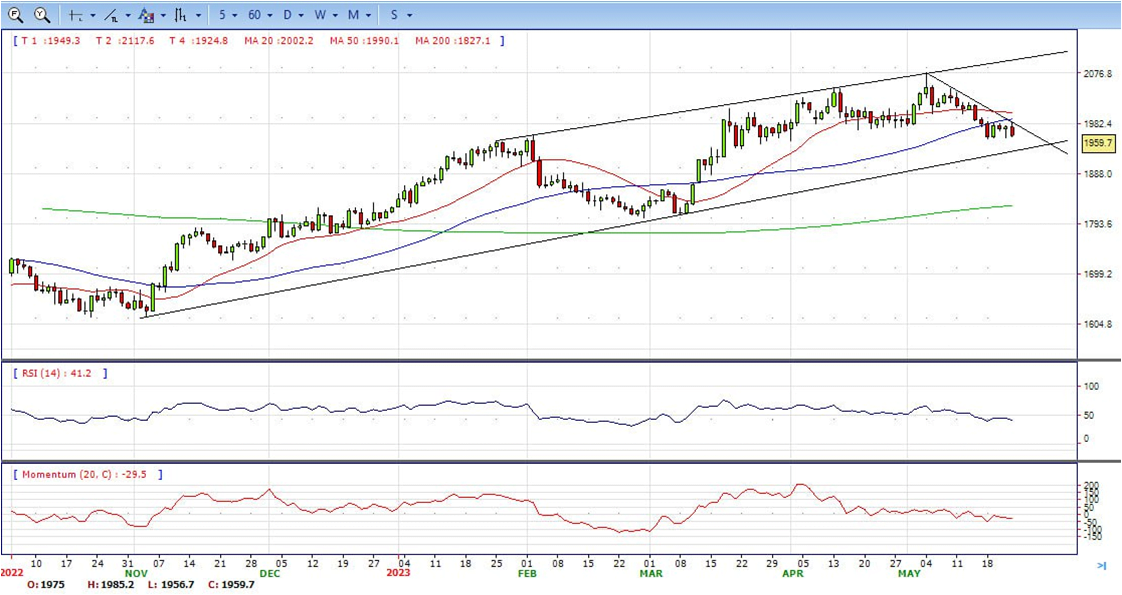
- Gold price stabilized around 1960, down for the day and bearish in the daily chart. The gold price stabilizes below 20 SMA, suggesting bearish strength in short term. However, the 20 SMA started turning flat but continued developing far above 50 and 200 SMA, indicates bulls not exhausted yet. On upside, the immediate resistance is 1993, break above this level will open the gate for more advance to 2022 area.
- From a technical perspective, the RSI indicator holds below the mid-line and stabilizes around 41, on a bearish strength. The Momentum indicator hold in negative territory, suggests downward potentials. On downside, the immediate support is 1950, below this area may resume the decline to 1935.


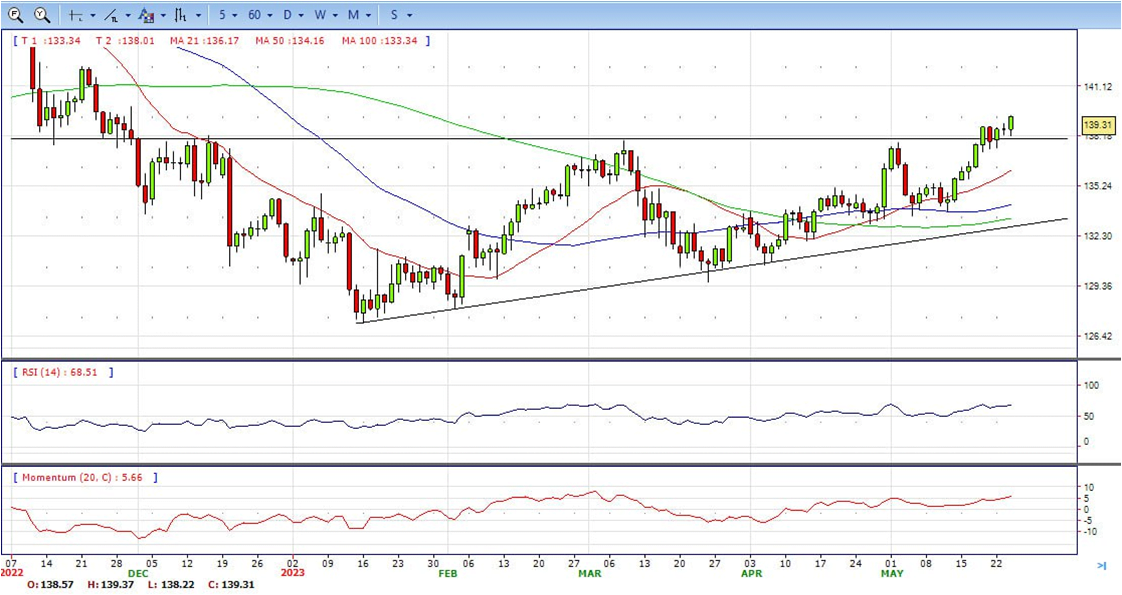
- USD/JPY extended its gains of more than 0.39%, as the latest Federal Reserve May meeting minutes showed that a scenario of more rate hikes was “less certain.” At the time of writing, the USD/JPY is trading at 139.30, pointing a new year-to-date high of 139.37.
- The US Dollar pulls back following an early uptick to a fresh two-month high amid a further decline in the US Treasury bond yields. Apart from this, a generally weaker tone around the equity markets drives some haven flow towards the Japanese Yen and acts as a headwind for the USD/JPY pair. Against the backdrop of worries about a global economic slowdown, the lack of progress in talks over increasing the US debt ceiling tempers investors’ appetite for riskier assets and benefits traditional safe-haven assets.
- The USD/JPY pair stabilized around 139.30, up for the day and bullish in the daily chart. The price stabilizes above 20 and 50 SMA, suggests bullish strength in short term. Meanwhile, 20 SMA continued accelerating north and developing above longer ones, indicating bulls not exhausted. On upside, overcome 140.00 may encourage bulls to challenge 142.30, break above that level will open the gate to 145.00.
- Technical indicators suggest the bullish strength. RSI stabilizes around 68, while the Momentum indicator stabilizes above the midline, suggests upward potentials. On downside, the immediate support is 138.20, break below this level will open the gate to 137.20 area.
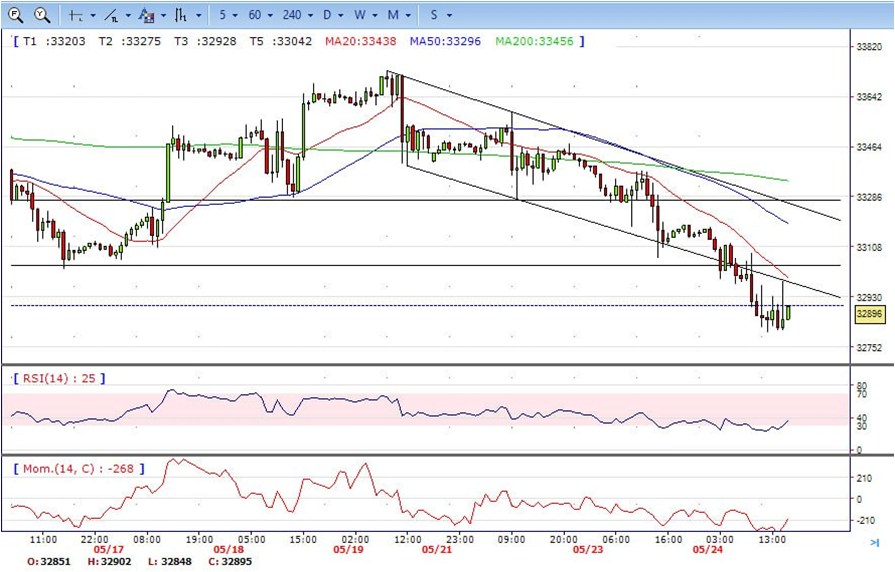
- DJI continued the decline as a debt-ceiling deal in the US risk running into a brick wall. The price tumbled from intraday high 33190 area to low 32800 level. It recovered modestly and ended Wednesday around 32900, below 20 and 50 SMA, suggests bearish strength. Meanwhile, 20 SMA continued accelerating south and developing far below longer ones, suggests bears not exhausted yet. On upside, overcome 33100 may encourage bulls to challenge 33300, break above that level will open the gate to 33550.
- Technical indicators suggest the bearish movement. RSI stabilizes around 36, while the Momentum indicator stabilizes below the midline, suggests downward potentials. On downside, the immediately support is 32800, break below this level will open the gate for more decline to 32500 area.
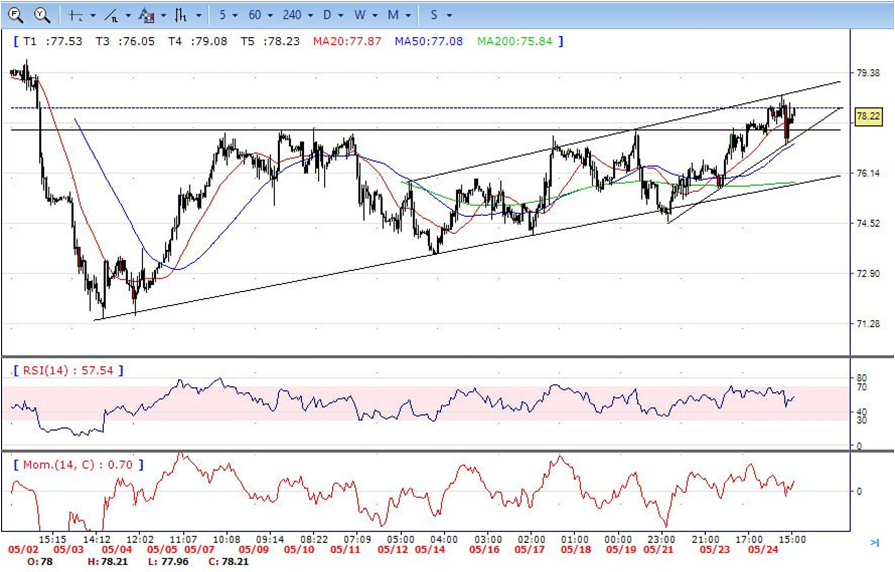
- Brent consolidated with gains on Wednesday, traded from intraday low 77.00 area to high 78.50 level. It retreated modestly and ended the day around 78.20, up for the day and above 20 and 50 SMA, indicates bullish sign in the hourly chart. Meanwhile, the 20 SMA continued accelerating north and developing above longer ones, indicates bulls not exhausted yet. On upside, overcome 78.50 may encourage bulls to challenge 79.70, break above that level will open the gate to 80.60.
- Technical indicators also suggest bullish movement, hovering above the midline. RSI stabilizes at 57, while the Momentum indicator stabilizes in positive territory, suggests upward potentials. On downside, the immediately support is 76.60, break below this level will open the gate for more decline to 75.60 area.