24/05/2023 Daily Reports
- EUR/USD maintains its bearish tone on Tuesday, seeing its decline accelerate to the 1.0760 area as the dollar continues to face upward pressure, while unease over the US debt ceiling continues to weigh on sentiment.
- Meanwhile, talks over the US debt ceiling are expected to continue to drive sentiment in global markets in the near term, while speculation of further rate hikes by the ECB at its June and July meetings, and likely in September, continues to grow. The movement of the euro’s value is expected to closely mirror the behaviour of the US Dollar and will likely be impacted by any differences in approach between the Fed and the ECB with regards to their plans for adjusting interest rates.
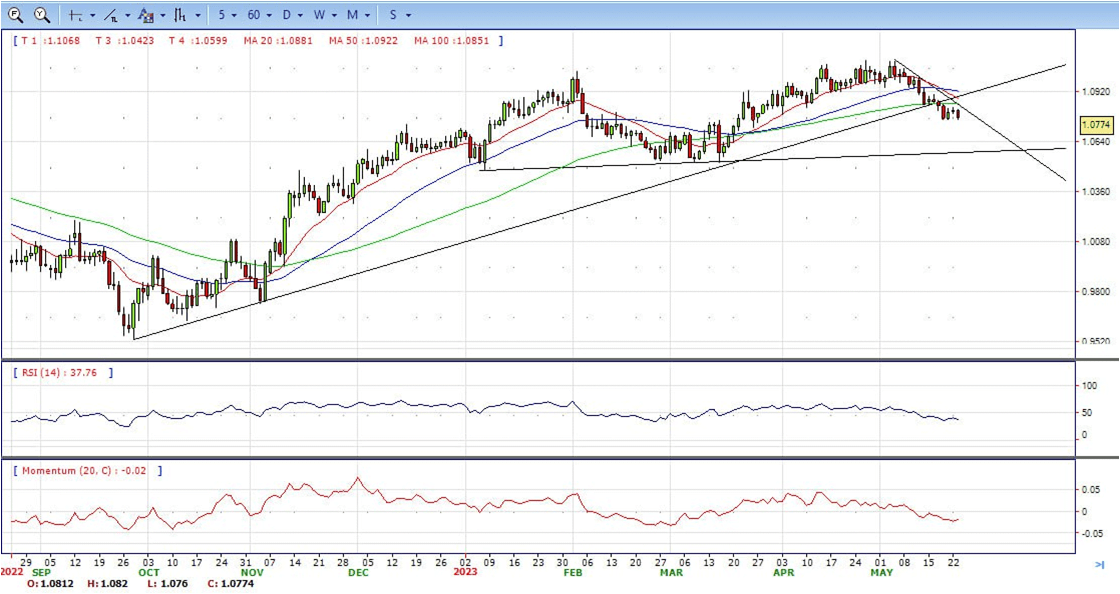
- The EUR/USD pair is trading near the 1.0775, down for the day with bearish stance in daily chart. The pair stabilized below 20 and 50 SMA, indicates bearish strength. Meanwhile, the 20 SMA started turning south and heading towards 50 and 200 SMA, suggests bears not exhausted yet. On upside, the immediate resistance is 1.0850, break above this level will extend the advance to 1.0900.
- Technical readings in the daily chart support the bearish stance. The RSI indicator stabilizes around 38. The Momentum indicator holds below the midline, indicating bearish potentials. On downside, the immediate support is 1.0710 and below this level will open the gate to 1.0630.
- GBP/USD drops extending its losses, as a risk-off impulse triggered a flight to safety, favouring the US Dollar to the detriment of the Pound Sterling. Uncertainty about the debt-ceiling negotiations in the US, and mixed US economic data bolstered the US Dollar. The GBP/USD is trading at 1.2414, below its opening price by almost 0.20%.
- The prevailing mood on Wall Street is decidedly gloomy as stocks tread downward. Ongoing debates concerning the increase of the US debt ceiling are eclipsing the latest economic figures from the United States. Even though President Joe Biden and House Speaker Kevin McCarthy declared their Monday discussions productive, they are yet to resolve. Meanwhile, Treasury Secretary Janet Yellen emphasizes the imminent cash crunch in the US, anticipated by June 1.
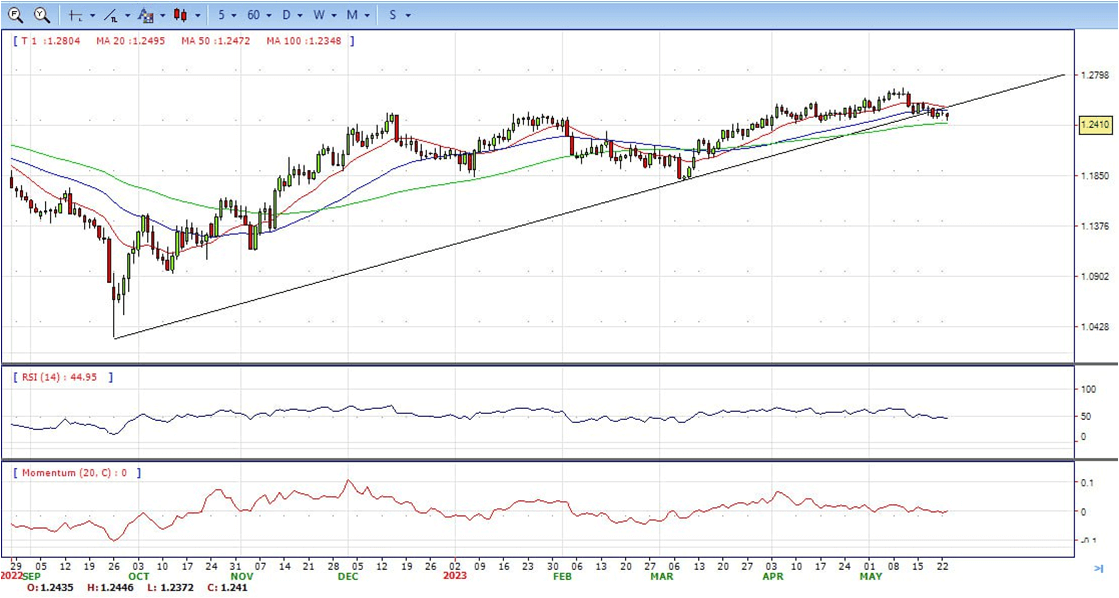
- The GBP/USD offers bearish stance in daily chart. Cable stabilizes below 20 and 50 SMA, indicating bearish strength in short term. Meanwhile, the 20 SMA started turning south and heading towards longer ones, suggests bears not exhausted yet. On upside, the immediate resistance is 1.2545 with a break above it exposing to 1.2600.
- Technical readings in the daily chart support the bearish stances. RSI indicator stabilizes around 45, while the Momentum indicator stabilizes near the midline, suggesting directionless potentials. On downside, the immediate support is 1.2350, unable to defend this level will resume the decline to 1.2270.


- Gold price is trimming some of its earlier losses, trading slightly positive in the day, as US Treasury bond yields rise due to uncertainty around US debt-ceiling discussions. Hence, US Treasury bond yields rise, underpinning the US Dollar, a headwind for XAU/USD’s prices. At the time of writing, the XAU/USD is trading at $1975, above its opening price.
- Wall Street portrays a sour sentiment, with equities trading lower. The economic data revealed in the United States is overshadowed by discussions about raising the debt ceiling in the US. Although US President Joe Biden and US House Speaker Kevin McCarthy called Monday’s talks productive, an agreement remains far from being done. In the meantime, US Treasury Secretary Janet Yellen continued to pressure that the US will run out of cash by June 1.
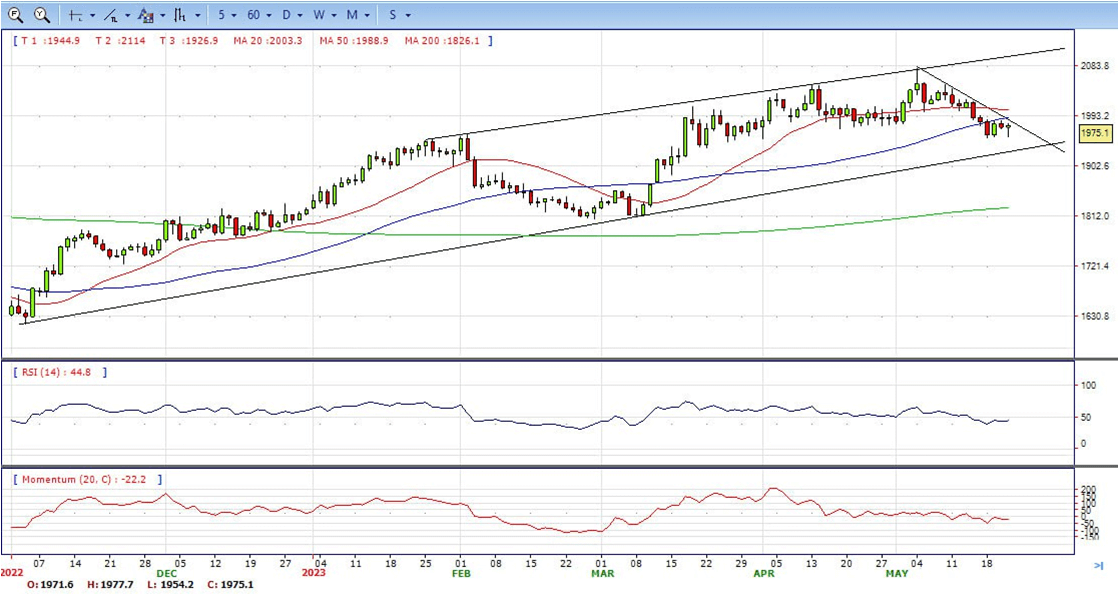
- Gold price stabilized around 1975, up for the day and bearish in the daily chart. The gold price stabilizes below 20 SMA, suggesting bearish strength in short term. However, the 20 SMA started turning flat but continued developing far above 50 and 200 SMA, indicates bulls not exhausted yet. On upside, the immediate resistance is 1993, break above this level will open the gate for more advance to 2022 area.
- From a technical perspective, the RSI indicator holds below the mid-line and stabilizes around 46, on a bearish strength. The Momentum indicator hold in negative territory, suggests downward potentials. On downside, the immediate support is 1950, below this area may resume the decline to 1935.


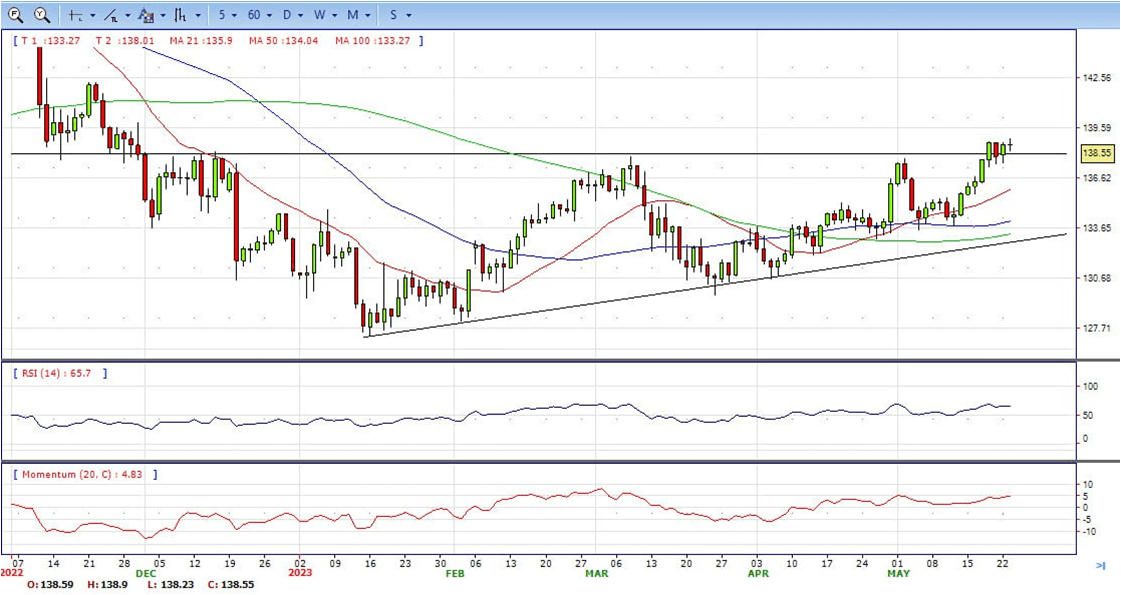
- USD/JPY touched a six-month high of 139 in the Asian session on Tuesday whereby talks over a debt-ceiling deal in the US risk running into a brick wall while investors get set for key economic events this week. At the time of writing, USD/JPY is flat at 0% with the price traveling between 138.23 and a high of 138.91.
- Global equities slid on Tuesday as talks over the US debt ceiling continued without resolution. We also have yields on one-month US Treasury bills running into a record high. Rising yields and a stronger US Dollar pressured the Yen that has been pressured by the Bank of Japan’s ongoing reluctance to tighten monetary policy further.
- The USD/JPY pair stabilized around 138.55, unchanged for the day bullish in the daily chart. The price stabilizes above 20 and 50 SMA, suggests bullish strength in short term. Meanwhile, 20 SMA continued accelerating north and developing above longer ones, indicating bulls not exhausted. On upside, overcome 140.00 may encourage bulls to challenge 142.30, break above that level will open the gate to 145.00.
- Technical indicators suggest the bullish strength. RSI stabilizes around 65, while the Momentum indicator stabilizes above the midline, suggests upward potentials. On downside, the immediate support is 137.80, break below this level will open the gate to 135.50 area.
- DJI continued the decline as a debt-ceiling deal in the US risk running into a brick wall. The price tumbled from intraday high 33475 area to low 33070. It recovered modestly and ended Tuesday around 33160, below 20 and 50 SMA, suggests bearish strength. Meanwhile, 20 SMA continued accelerating south and developing far below longer ones, suggests bears not exhausted yet. On upside, overcome 33300 may encourage bulls to challenge 33580, break above that level will open the gate to 33850.
- Technical indicators suggest the bearish movement. RSI stabilizes around 28, while the Momentum indicator stabilizes below the midline, suggests downward potentials. On downside, the immediately support is 33000, break below this level will open the gate for more decline to 32700 area.

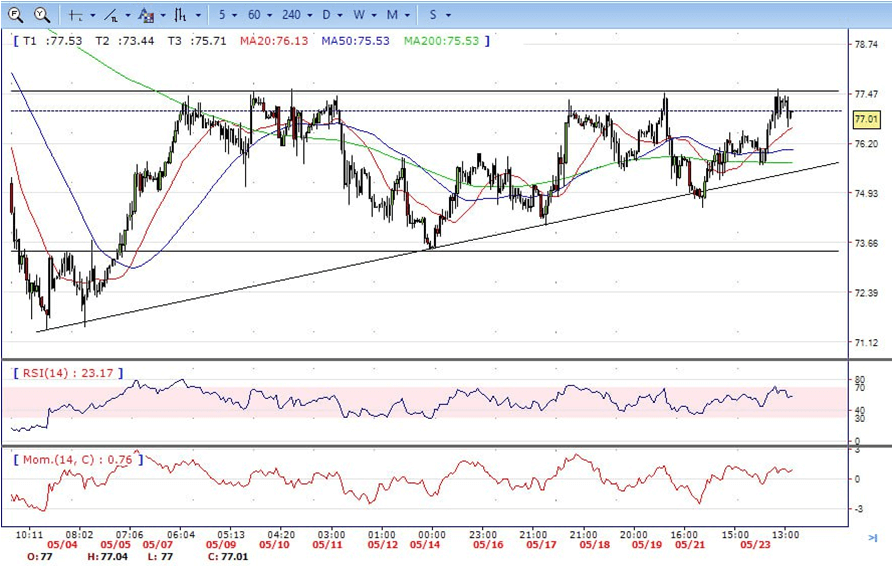
- Brent consolidated with gains in the familiar range, traded from intraday low 76.65 area to high 77.58 level. It retreated modestly and ended the day around 77.00, up for the day and above 20 and 50 SMA, indicates bullish sign in the hourly chart. Meanwhile, the 20 SMA continued accelerating north and developing above longer ones, indicates bulls not exhausted yet. On upside, overcome 77.60 may encourage bulls to challenge 79.20, break above that level will open the gate to 80.50.
- Technical indicators also suggest bullish movement, hovering above the midline. RSI stabilizes at 58, while the Momentum indicator stabilizes in positive territory, suggests upward potentials. On downside, the immediately support is 75.60, break below this level will open the gate for more decline to 74.50 area.