EUR/USD
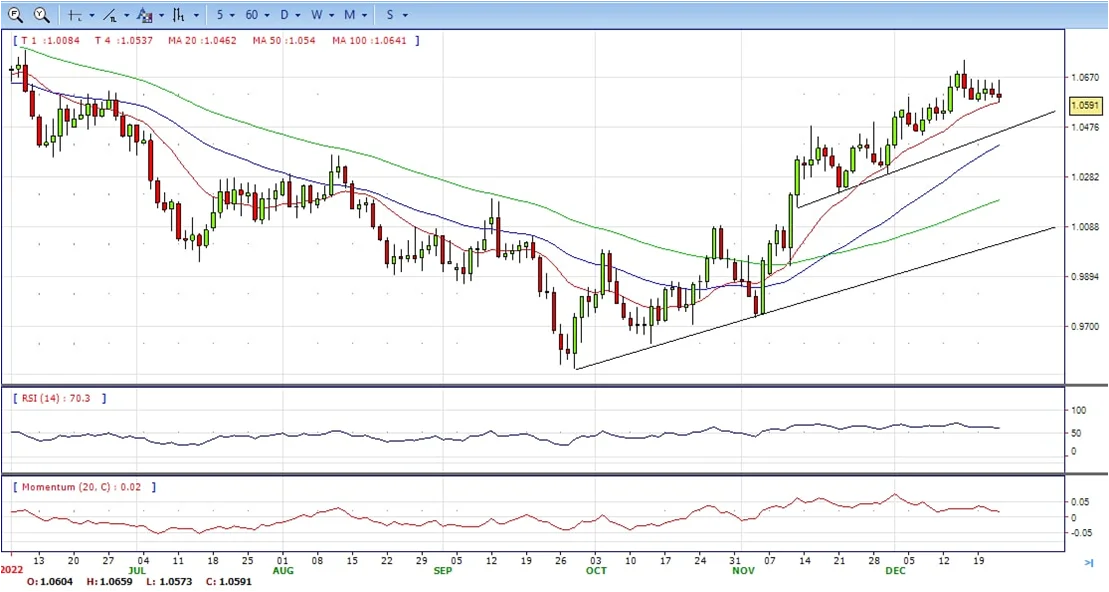
- EUR/USD is moving in towards a price imbalance between 1.0580 and 1.0570 having already made a low of 1.0573. The price is coiled below the top of the bullish cycle up at 1.0763 and is breaking down the trend which leaves the bias to the downside, but still bullish in the daily chart.
- The US Dollar recovered its shine on Thursday, and despite still trading within familiar levels against most of its major rivals, it currently stands near weekly highs. The Greenback got boosted by an upbeat US Gross Domestic Product report, as the Q3 GDP was upwardly revised from 2.9% to 3.2%.
- Asian stock markets closed in the green, but European indexes ended the day with modest losses. Wall Street posted substantial losses, trimming all of its weekly gains. Also, the US Senate approved a $1.7 trillion government funding bill and passed it to the House, where it is expected to also pass before the end of the day.
- The EUR/USD pair is trading near the 1.0590, down for the day with bullish stance in daily chart. The pair stabilized above 20 and 50 SMA, indicates bullish strength. Meanwhile, the 20 SMA continued accelerating north and developing far above longer ones, suggests bulls not exhausted yet. On upside, the immediate resistance is 1.0660, break above this level will extend the advance to 1.0740.
- Technical readings in the daily chart support the bullish stances. The RSI indicators hovering above the midline and stabilized around 61. The Momentum indicator stabilized above the midline, indicating upward potentials. On downside, the immediate support is 1.0570 and below this level will open the gate to 1.0500.
Open A Demo
CDO has wide range of tools, professional and friendly support for clients to achieve their financial markets trading goals. Open a live account now to enjoy this experience with virtual deposit.
GBP/USD
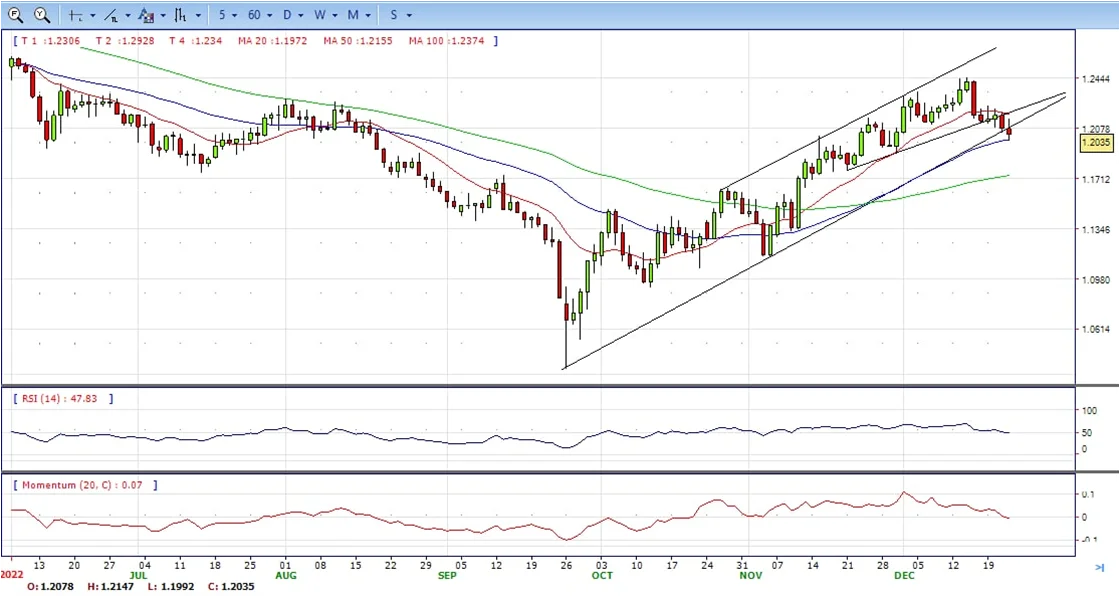
- GBP/USD is pressured by a resurgence in the US dollar that is getting a boost from stronger-than-forecast data, underpinning the hawkish Federal Reserve outlook and higher rate expectations for 2023. Then pair ended the day at around 1.2040, neutral to bearish in the daily chart.
- The greenback was in demand following the numbers as these are the type of data that could keep the Federal Reserve hawkish for longer. The Fed last week projected at least an additional 75 basis points of increases in borrowing costs by the end of 2023.
- Meanwhile, domestically, the UK reported third-quarter current account and final Gross Domestic Produce data. The QoQ growth rate was marked down a tick to -0.3%, while the YoY was revised to 1.9% vs. 2.4% preliminary. Private consumption, government spending, and investment were all marked down significantly, but this was partially offset by stronger net exports.
- The GBP/USD offers neutral to bearish stance in daily chart. Cable stabilized between 20 and 50 SMA, indicating neutral strength in short term. However, the 20 SMA started turning south and heading towards 50 SMA, suggests bears not exhausted yet. On upside, The immediate resistance is 1.2150 with a break above it exposing to 1.2250.
- Technical readings in the daily chart support the neutral stances. RSI indicator stabilized around 50, while the Momentum indicator stabilized near the midline, suggesting directionless potentials. On downside, the immediate support is 1.1990, unable to defend this level will resume the decline to 1.1900.

CDO TRADER
CDO TRADER, our cutting-edge trading platform, follows the technology from the forefront with new features added continuously. Moreover, CDO TRADER is now available for Android and iOS! So it allows you to trade on the go!
XAU/USD
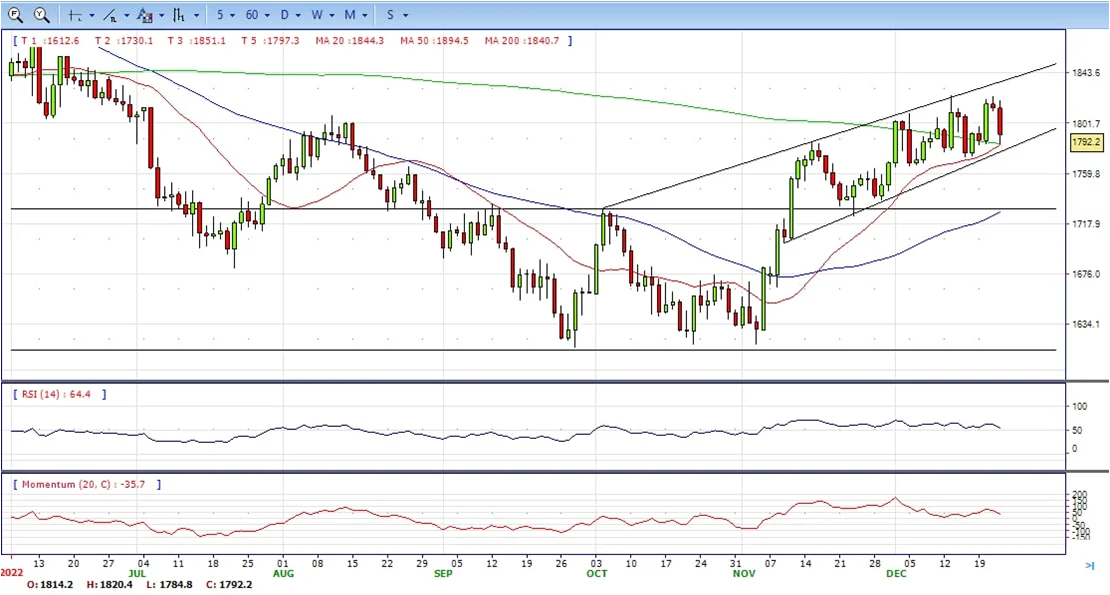
- The Gold price has dumped to a critical area on the daily charts, as shown below, losing some 1.5% on Thursday. The yellow metal is back below the psychological $1,800 area as the Gold price continues to face resistance in attempts to break out to the upside. It ended the day at around $1,792, still bullish in the daily chart.
- US Treasury yields are higher following the data on Thursday showed Weekly Jobless Claims in the US rose less than expected. The US 10-year Treasury yield is up 0.14% at the time of writing, but it rose to a high of 3.692% earlier in the day, bearish for the Gold price as the shiny metal offers no interest.
- The US Dollar and Gold price took their cues when the Department of Labor said seasonally adjusted numbers of initial unemployment claims rose by 2,000 to 216,000 in the week ended Dec. 17. The consensus on Econoday was for a 225,000 print. The previous week’s level was revised up by 3,000 to 214,000. The four-week moving average tallied 221,750, sliding by 6,250 from the previous week’s revised average of 228,000. Unadjusted claims declined by 4,064 on a weekly basis to 247,867.
- Gold price stabilized around 1792, down for the day and bullish in the daily chart. The gold price still stabilized above 20 and 50 SMA, suggesting bullish strength in short term. Meanwhile, the 20 SMA continued accelerating north and developing above 50 SMA, indicating bulls not exhausted yet. On upside, the immediate resistance is 1825, break above this level will open the gate for more advance to 1848 area.
- From a technical perspective, the RSI indicator hold above the midline and stabilized around 54, suggesting bullish strength. The Momentum indicator stabilized above the midline, suggests upward potentials. On downside, the immediate support is 1784, below this area may resume the decline to 1784.
MetaTrader 4
MT4 has user friendly interface that is providing simplicity and efficiency. The traders can perform trading strategies for different products like Forex and CFD. MetaTrader 4 has over 50 built-in indicators, also it’s the tool that predicts trends and defines the appropriate entry and exit points.

USD/JPY
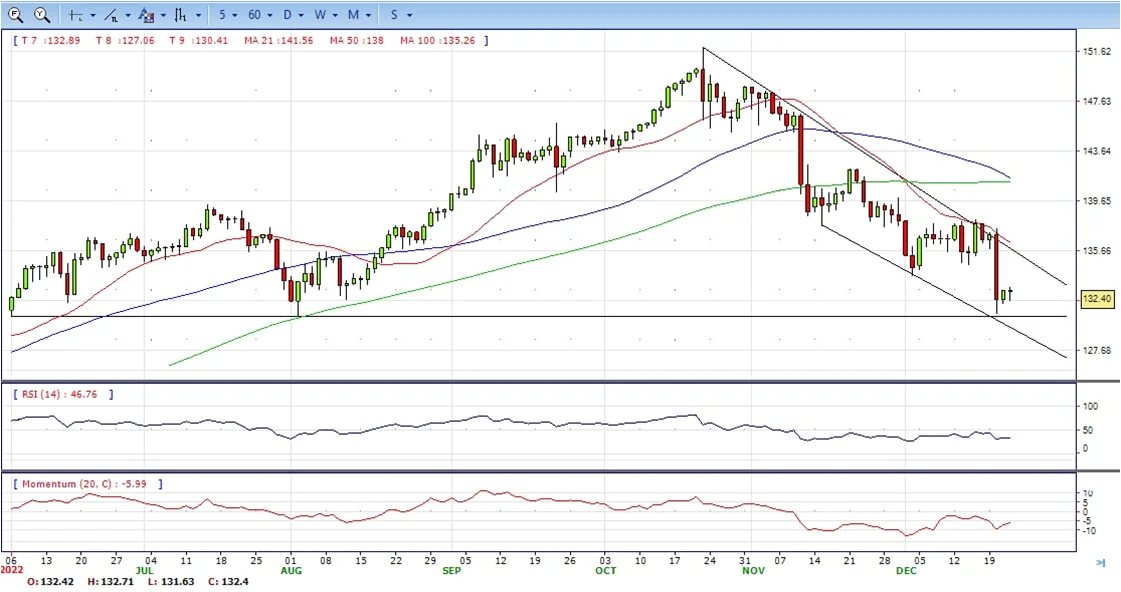
- The USD/JPY rose to 132.73 after the beginning of the American session and following the release of US economic data. It then pulled back finding support above 132.15. The pair ended the day at around 132.40, still bearish in the daily chart.
- Economic data released in the US on Thursday showed the economy expanded at an annualized rate of 3.2% during the third quarter, above the 2.9% of the previous estimate. Price indicators were also revised higher. Initial Jobless Claims rose to 216K below the 222K of market consensus while Continuing Claims fell for the first time in weeks from 1.678 million to 1.672 million.
- US figures came in above expectations and triggered an intraday rally of the US Dollar and a decline in equity and bond prices. The Dow Jones extended losses, a few minutes after the opening is falling by 0.96% and the Nasdaq tumbles by 1.75%. The Japanese Yen received some support from the deterioration in market sentiment and printed fresh highs against currencies like the Aussie and the Kiwi.
- The USD/JPY pair stabilized around 132.40, unchanged for the day and bearish in the daily chart. The price maintains the downward slope and develops below all main SMAs, suggests bearish strength in short term. Meanwhile, 20 SMA continued accelerating south and developing below longer ones, indicating bears not exhausted. On upside, overcome 132.90 may encourage bulls to challenge 133.70, break above that level will open the gate to 134.60.
- Technical indicators suggest the bearish strength. RSI stabilized around 33, while the Momentum indicator continued developing below the midline, suggests downward potentials. On downside, the immediate support is 131.50, break below this level will open the gate to 130.50 area.
DJI
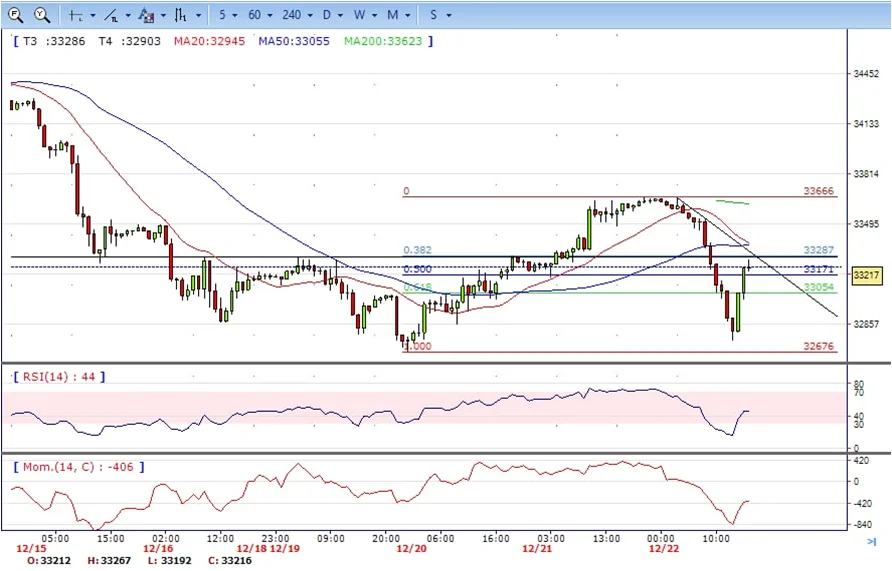
- DJI under the sell pressure, tumbled from intraday high 33655 to low 32751. It trimmed half losses and ended Thursday at 33190, down for the day and bearish in the daily chart. The price stabilized below 20 and 50 SMA, suggests bearish strength in short term. Meanwhile, 20 SMA continued accelerating south and heading towards 50 SMA , suggests bears not exhausted yet. On upside, overcome 33300 may encourage bulls to challenge 33650, break above this level will open the gate to 34000.
- Technical indicators suggests the bearish strength. RSI stabilized at around 44, while the Momentum indicator stabilized in negative territory, suggests downward potentials. On downside, the immediate support is 33000, break below this level will open the gate for more decline to 32670 area.
BRENT
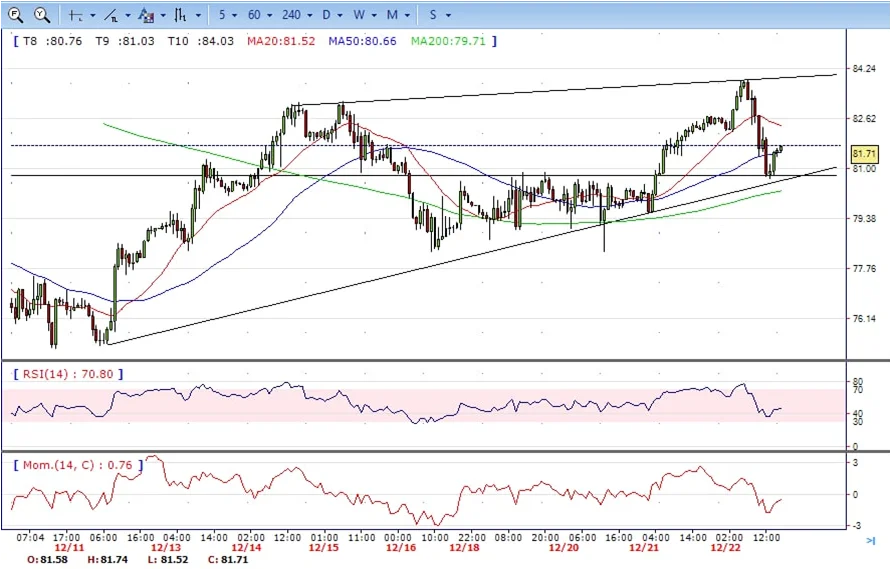
- Brent continued the advance in the first half of the day, climbed to intraday high 83.85. It failed to hold the gains, tumbled to low 80.68 and ended Thursday at around 81.75, down for the day and bearish in the hourly chart. The price stabilized below 20 SMAs, suggests bearish strength in short term. Meanwhile, the 20 SMA continued accelerating south and heading towards 50 SMA, indicating bears not exhausted yet. On upside, overcome 82.30 may encourage bulls to challenge 83.80, break above this level will open the gate to 85.20.
- Technical indicators suggest the bearish movement, hovering below the midline. RSI stabilized at around 46, while the Momentum indicator stabilized in negative territory, suggests downward potentials. On downside, the immediate support is 80.70, break below this level will open the gate for more decline to 79.50 area.
Contact Us
Please, fill the form to get an assistance.


