EUR/USD
- After rising to new monthly highs above the important 1.1000 threshold against the US Dollar, the Euro has lost some steam and retreated to the 1.0960 area, resulting in slight losses for the day thus far.
- In a broader context, the potential future actions of both the Federal Reserve and the ECB regarding the normalization of their monetary policies continue to be a subject of debate. Additionally, there is growing speculation of an economic slowdown on both sides of the Atlantic. Regarding the Fed, Chair Powell hinted that more measures are necessary to bring inflation back to the target of 2.0%, while also keeping the possibility of further tightening in the second half of the year open. Investors generally anticipate either two 25 basis point rate hikes or a single 50 basis point adjustment in the coming months.
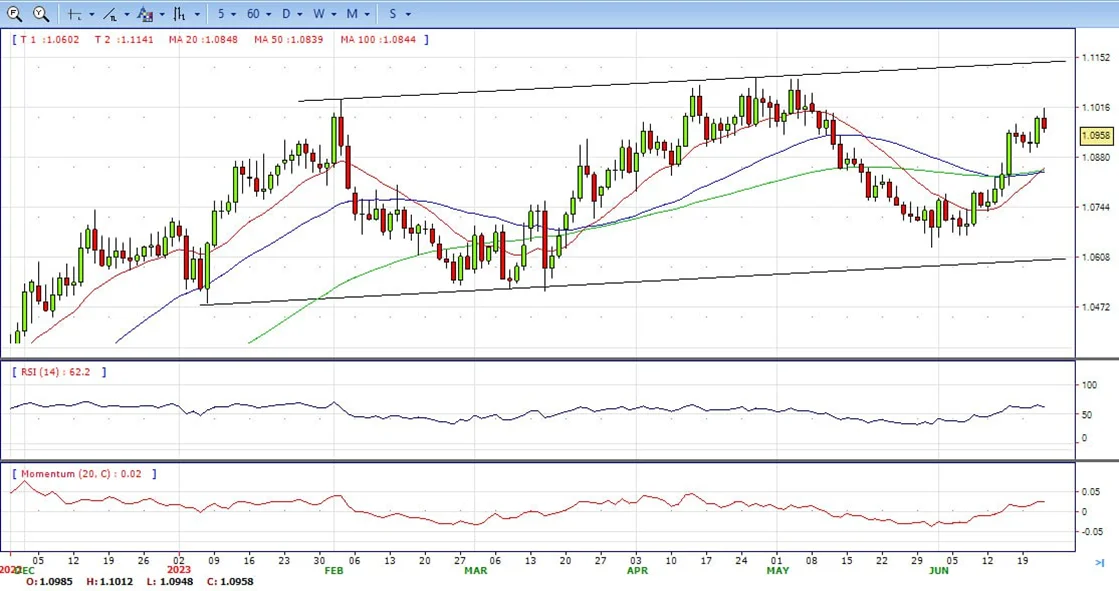
- The EUR/USD pair is trading near the 1.0960, down for the day with bullish stance in daily chart. The pair stabilized above all main SMAs, indicates bullish strength. Meanwhile, the 20 SMA continued accelerating north and heading towards 50 and 200 SMA, suggests bulls not exhausted yet. On upside, the immediate resistance is 1.1010, break above this level will extend the advance to 1.1100.
- Technical readings in the daily chart support the bullish stance. The RSI indicator stabilizes around 61. The Momentum indicator holds above the midline, indicating upward potentials. On downside, the immediate support is 1.0890 and below this level will open the gate to 1.0800.
Open A Demo
CDO has wide range of tools, professional and friendly support for clients to achieve their financial markets trading goals. Open a live account now to enjoy this experience with virtual deposit.
GBP/USD
- GBP/USD extended its losses after hitting a daily high of 1.2841 after the Bank of England surprised the markets by hiking rates 50 bps but failed to underpin the Pound Sterling. Late in the New York session, the GBP/USD is trading at 1.2745, down 0.20%.
- On Thursday, the BoE’s decision to lift rates to the 5% threshold caught off guard market participants, which foresaw a quarter of a percent increase to the Bank Rate. But Wednesday, inflation data in the UK spurred an aggressive reaction by Andrew Bailey and Co, a sign seen by investors that the central bank is behind the curve.
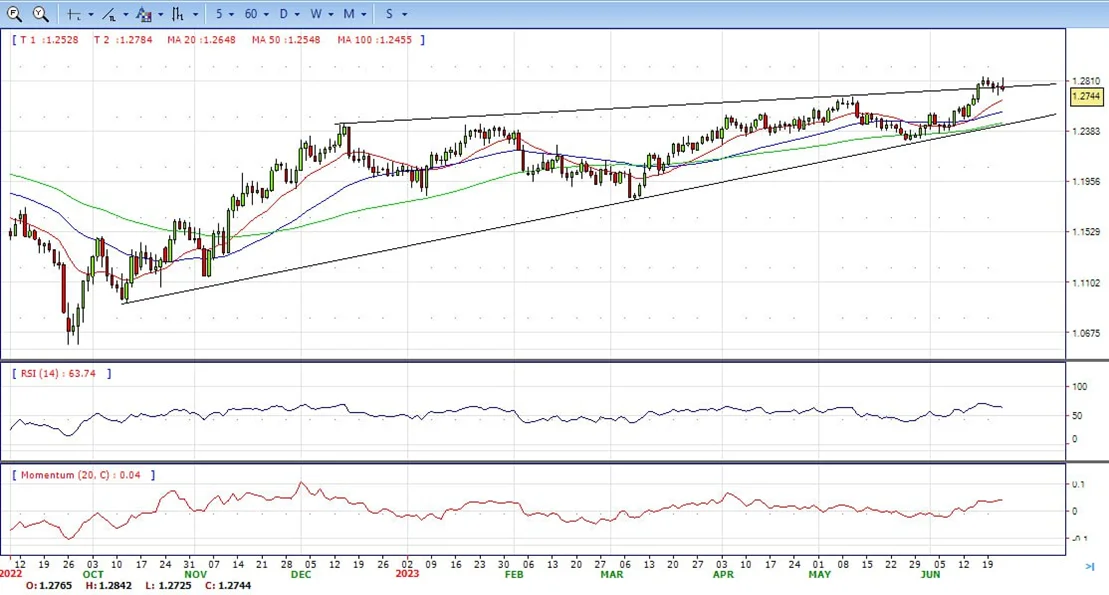
- The GBP/USD offers bullish stance in daily chart. Cable stabilizes above 20 and 50 SMA, indicating bullish strength in short term. Meanwhile, the 20 and 50 SMA started turning flat but continued developing above longer ones, suggests bulls not exhausted yet. On upside, the immediate resistance is 1.2850 with a break above it exposing to 1.3000.
- Technical readings in the daily chart support the bullish stances. RSI indicator stabilizes around 63, while the Momentum indicator stabilizes above the midline, suggesting upward potentials. On downside, the immediate support is 1.2690, unable to defend this level will resume the decline to 1.2550.

CDO TRADER
CDO TRADER, our cutting-edge trading platform, follows the technology from the forefront with new features added continuously. Moreover, CDO TRADER is now available for Android and iOS! So it allows you to trade on the go!
XAU/USD
- Gold price has retreated after a solid recovery to near $1,930.00 in the early New York session. The precious metal has faced selling pressure despite the weekly jobless claims for the week ending June 16 has landed marginally higher than expectations.
- S&P500 futures have recovered some losses. However, a weak opening is broadly expected. Investors have underpinned the risk-aversion theme as more rate hikes by the Federal Reserve (Fed) could accelerate fears of a recession in the United States. The US Dollar Index has rebounded to near day’s high around 102.16 as investors are providing more value to hawkish testimony by Fed chair Jerome Powell against dovish commentary by Atlanta Fed President Raphael Bostic and Chicago Fed Bank President Austan Goolsbee. The 10-year US Treasury yields have climbed above 3.75%.
- Gold price stabilized around 1914, down for the day and bearish in the daily chart. The gold price stabilizes below 20 SMA, suggesting bearish strength in short term. Meanwhile, the 20 SMA continued accelerating south and developing below 50 SMA, indicates bears not exhausted yet. On upside, the immediate resistance is 1935, break above this level will open the gate for more advance to 1960 area.
- From a technical perspective, the RSI indicator holds below the midline and stabilizes around 35, on a bearish strength. While the Momentum indicator also stabilized in the negative territory, suggests downward potentials. On downside, the immediate support is 1900, below this area may resume the decline to 1885.

MetaTrader 4
MT4 has user friendly interface that is providing simplicity and efficiency. The traders can perform trading strategies for different products like Forex and CFD. MetaTrader 4 has over 50 built-in indicators, also it’s the tool that predicts trends and defines the appropriate entry and exit points.

USD/JPY
- USD/JPY climbs to new YTD highs at around 143.21 on Thursday, as the Fed Chair Jerome Powell gets ready to finish its two-day testimony before the US Congress. Hawkish comments by Powell rattled Wall Street and underpinned the USD, recovering lost ground. The USD/JPY exchanged hands at 143.14 after hitting a low of 141.61.
- Global equities trade with losses. Aside from Powell’s comments on Wednesday, three major central banks raised rates, with the BoE surprising the markets with a 50 bps hike, though it failed to boost the GBP. However, sentiment dampened as more central banks tightened monetary conditions, reigniting fears of a global economic slowdown. The USD/JPY gained traction as bond yields rose. The US 10-year Treasury note yields 3.783%, five basis points higher than its open, underpinning the USD. The US Dollar Index measures the buck’s value vs. its peers, advances to 102.377, and gains 0.30%.
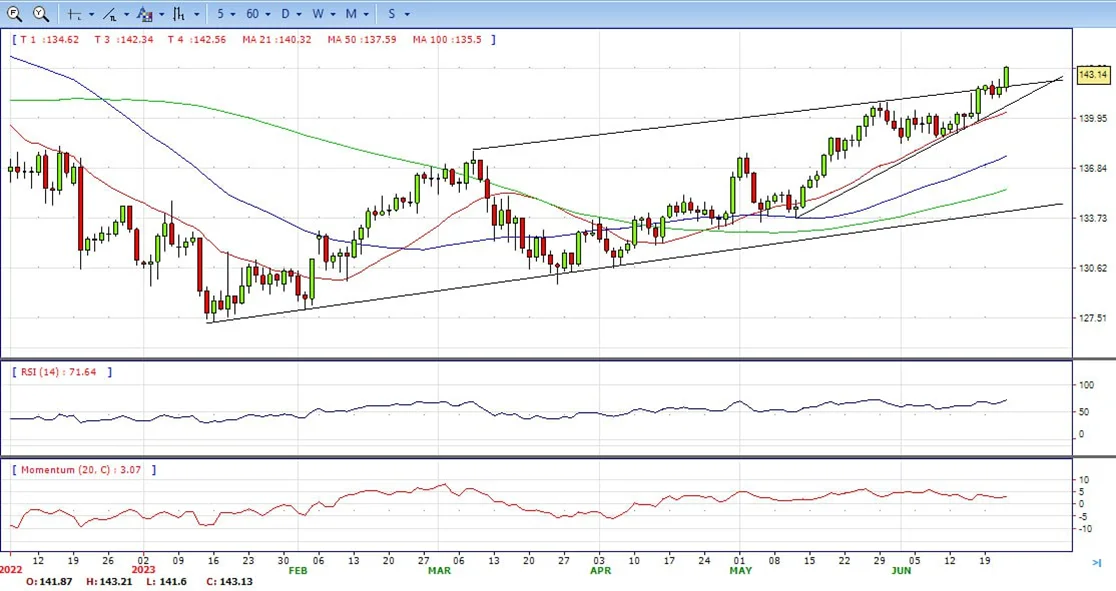
- The USD/JPY pair stabilized around 143.14, up for the day and bullish in the daily chart. The price stabilizes above 20 and 50 SMA, suggests bullish strength in short term. Meanwhile, 20 SMA continued accelerating north and developing above longer ones, indicating bulls not exhausted. On upside, overcome 144.00 may encourage bulls to challenge 145.50, break above that level will open the gate to 147.00.
- Technical indicators suggest the bullish strength. RSI stabilizes around 72, while the Momentum indicator stabilizes above the midline, suggests upward potentials. On downside, the immediate support is 142.20, break below this level will open the gate to 141.20 area.
DJI
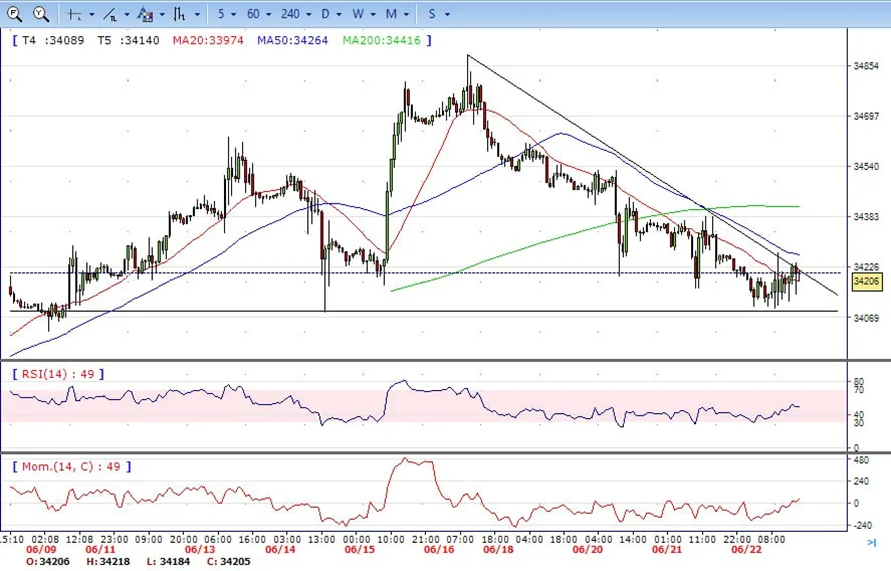
- DJI continued under the sell pressure on Thursday, declined to 34100 area and then trimmed some losses and ended the day around 34200, below 50 and 200 SMA, suggests bearish strength. Meanwhile, 20 SMA continued accelerating south and developing below longer ones, suggests bears not exhausted yet. On upside, overcome 34400 may encourage bulls to challenge 34620, break above that level will open the gate to 34900.
- Technical indicators suggest the bearish movement. RSI stabilizes around 48, while the Momentum indicator stabilizes above the midline, suggests upward potentials. On downside, the immediately support is 34100, break below this level will open the gate for more decline to 34000 area.
BRENT
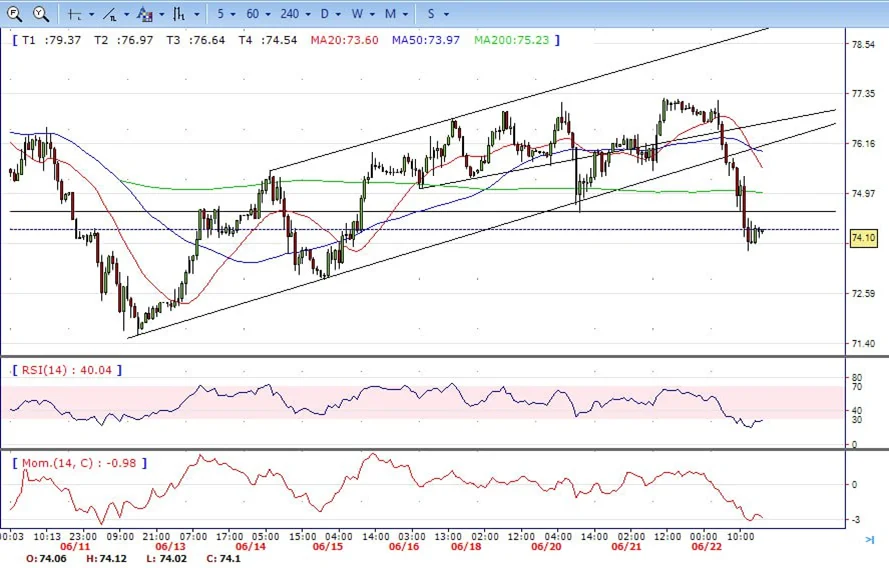
- Brent under the strong sell pressure on Thursday, tumbled from intraday high 77.20 to intraday low 73.60. It holds near the bottom and end the day around 74.10, down for the day and indicates bearish sign in the hourly chart. Meanwhile, the 20 SMA started turning south and heading towards longer ones, indicates bears not exhausted yet. On upside, overcome 75.40 may encourage bulls to challenge 77.25, break above that level will open the gate to 78.50.
- Technical indicators also suggest bearish movement, hovering below the midline. RSI stabilizes at 28, while the Momentum indicator stabilizes below the midline, suggests downward potentials. On downside, the immediately support is 73.60, break below this level will open the gate for more decline to 72.90 area.
Contact Us
Please, fill the form to get an assistance.


