EUR/USD
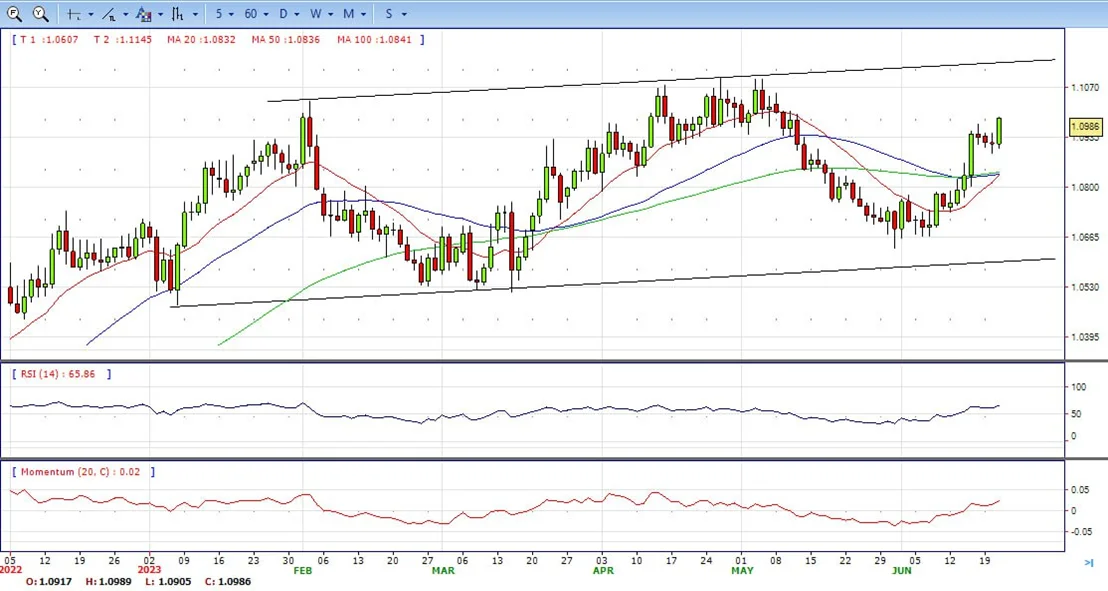
- EUR/USD snaps three days of consecutive losses and raises toward the 1.0990 region as the US Fed Chair Jerome Powell answers questions at the US House of Representatives on his first day of testimony. Risk aversion, and high US Treasury bond yields, drives the market’s narrative, though the EUR/USD pair climbs on broad USD weakness. At the time of writing, the EUR/USD exchanges hands at 1.0986 after bouncing from 1.0905 lows.
- US equities are trading with losses amidst Powell’s testimony. The Fed Chair reiterated the Fed would continue to tighten monetary policy but stressed the central bank would make its decisions meeting-by-meeting based on incoming data.
- The EUR/USD pair is trading near the 1.0986, up for the day with bullish stance in daily chart. The pair stabilized above all main SMAs, indicates bullish strength. Meanwhile, the 20 SMA continued accelerating north and heading towards 50 and 200 SMA, suggests bulls not exhausted yet. On upside, the immediate resistance is 1.1000, break above this level will extend the advance to 1.1100.
- Technical readings in the daily chart support the bullish stance. The RSI indicator stabilizes around 65. The Momentum indicator holds above the midline, indicating upward potentials. On downside, the immediate support is 1.0890 and below this level will open the gate to 1.0800.
Open A Demo
CDO has wide range of tools, professional and friendly support for clients to achieve their financial markets trading goals. Open a live account now to enjoy this experience with virtual deposit.
GBP/USD
- The Pound Sterling has defended the 1.2700 support comfortably as investors are confident that the United Kingdom central bank could announce a fat interest rate hike. The GBP/USD pair has stabilized after a V-shape recovery as surprisingly higher inflationary pressures in Britain have propelled the need for bulky hikes in the interest rates by the BoE. However, it will eventually hurt the economic prospects of the economy.
- Tight labor market conditions in the United Kingdom have fuelled inflationary pressures. Households demand has remained elevated as higher earnings provided the luxury of having more disposable individuals. Fears of bigger interest rate hikes by the UK central bank have accelerated, which might scale down the deviation of the Federal Reserve’s higher interest rates significantly. The Pound Sterling is bound to stay bullish versus the US Dollar while this central bank discrepancy continues.
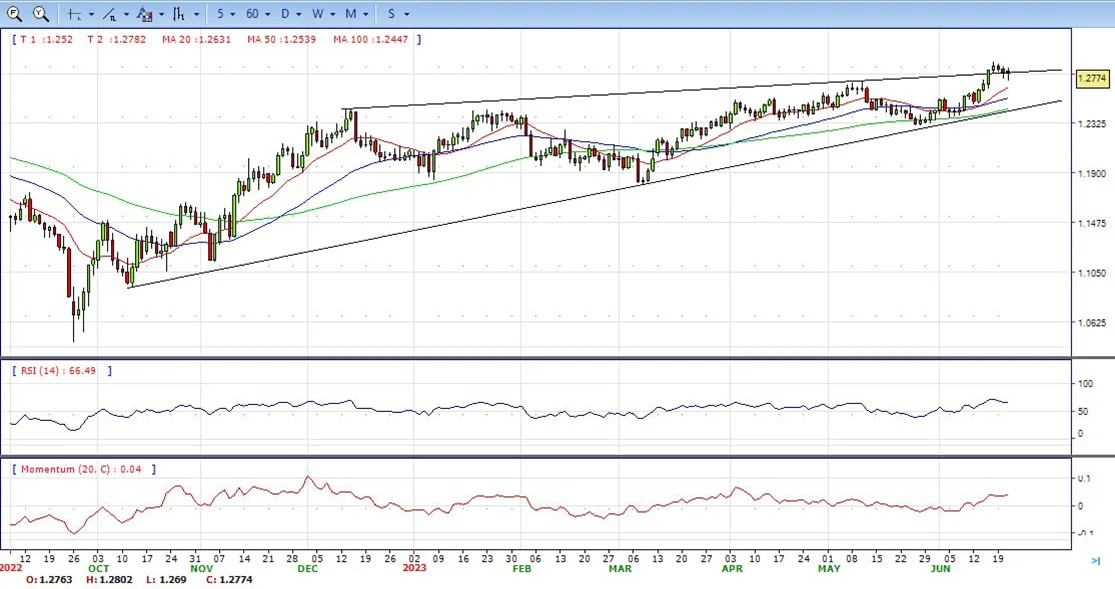
- The GBP/USD offers bullish stance in daily chart. Cable stabilizes above 20 and 50 SMA, indicating bullish strength in short term. Meanwhile, the 20 and 50 SMA started turning flat but continued developing above longer ones, suggests bulls not exhausted yet. On upside, the immediate resistance is 1.2850 with a break above it exposing to 1.3000.
- Technical readings in the daily chart support the bullish stances. RSI indicator stabilizes around 65, while the Momentum indicator stabilizes above the midline, suggesting upward potentials. On downside, the immediate support is 1.2690, unable to defend this level will resume the decline to 1.2550.

CDO TRADER
CDO TRADER, our cutting-edge trading platform, follows the technology from the forefront with new features added continuously. Moreover, CDO TRADER is now available for Android and iOS! So it allows you to trade on the go!
XAU/USD
- Gold price is showing extremely volatile action around $1,930.00 as Fed chair Jerome Powell has sounded hawkish while delivering testimony in front of Congress. The precious metal is strongly defending the $1,930.00 despite Fed Powell having confirmed more rate hikes this year.
- Fed Powell has confirmed that policymakers are in favour of further interest rate hikes this year as the process of getting inflation back down to 2% has a long way to go. The Fed believes that tight credit conditions are expected to put pressure on economic activities, inflation, and labor market conditions, however, the extent remains uncertain. Chances of a recession in the United States economy are well solid as more interest rates by the Fed would impact the scales of manufacturing and service activities significantly.
- Gold price stabilized around 1934, down for the day and bearish in the daily chart. The gold price stabilizes below 20 SMA, suggesting bearish strength in short term. Meanwhile, the 20 SMA started turning south and continued developing below 50 SMA, indicates bears not exhausted yet. On upside, the immediate resistance is 1985, break above this level will open the gate for more advance to 2000 area.
- From a technical perspective, the RSI indicator holds below the midline and stabilizes around 40, on a bearish strength. While the Momentum indicator also stabilized in the negative territory, suggests downward potentials. On downside, the immediate support is 1919, below this area may resume the decline to 1900.

MetaTrader 4
MT4 has user friendly interface that is providing simplicity and efficiency. The traders can perform trading strategies for different products like Forex and CFD. MetaTrader 4 has over 50 built-in indicators, also it’s the tool that predicts trends and defines the appropriate entry and exit points.

USD/JPY
- The USD/JPY exchanges hands at around the 142.00 handle on Wednesday, after hitting a low of 141.28, as the Fed Chair Jerome Powell’s two-day testimony in the US Congress begins. Risk aversion is another of the drivers of the day while US Treasury bond yields, rise.
- The USD/JPY remains underpinned by US Treasury bond yields, namely the 10-year benchmark note, gaining four and a half basis points, up at 3.769%. The US Dollar Index, which measures a basket of six currencies vs. the greenback, surprisingly tumbles 0.16%, at 102.367. Aside from this, BoJ members leaned dovish, as April’s meeting minutes showed members mentioning that it is important to continue with monetary easing. Some members stressed that past price increases are passed on to consumer prices with a lag.
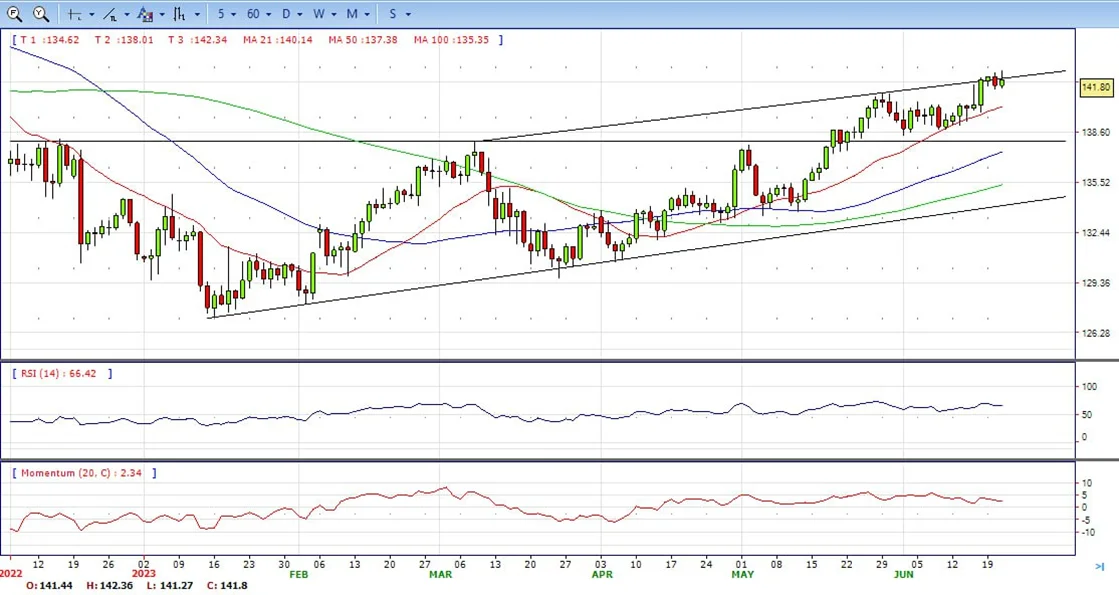
- The USD/JPY pair stabilized around 141.80, up for the day and bullish in the daily chart. The price stabilizes above 20 and 50 SMA, suggests bullish strength in short term. Meanwhile, 20 SMA continued accelerating north and developing above longer ones, indicating bulls not exhausted. On upside, overcome 142.40 may encourage bulls to challenge 144.00, break above that level will open the gate to 145.50.
- Technical indicators suggest the bullish strength. RSI stabilizes around 66, while the Momentum indicator stabilizes above the midline, suggests upward potentials. On downside, the immediate support is 141.20, break below this level will open the gate to 139.80 area.
DJI
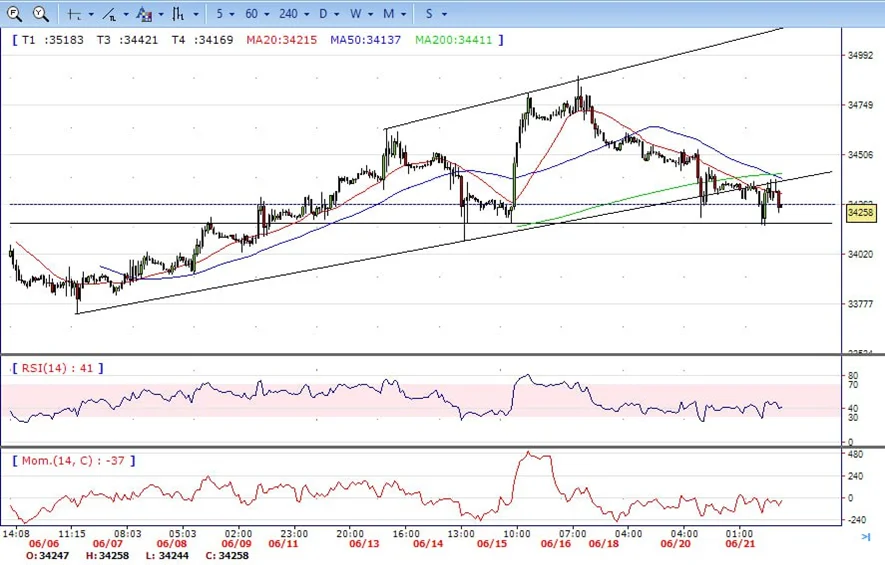
- DJI continued under the sell pressure on Wednesday, declined to 34160 area and then trimmed some losses and ended the day around 34260, below 20 SMA, suggests bearish strength. Meanwhile, 20 SMA continued accelerating south and heading towards longer ones, suggests bears not exhausted yet. On upside, overcome 34450 may encourage bulls to challenge 34620, break above that level will open the gate to 34900.
- Technical indicators suggest the bearish movement. RSI stabilizes around 42, while the Momentum indicator stabilizes below the midline, suggests downward potentials. On downside, the immediately support is 34160, break below this level will open the gate for more decline to 34000 area.
BRENT
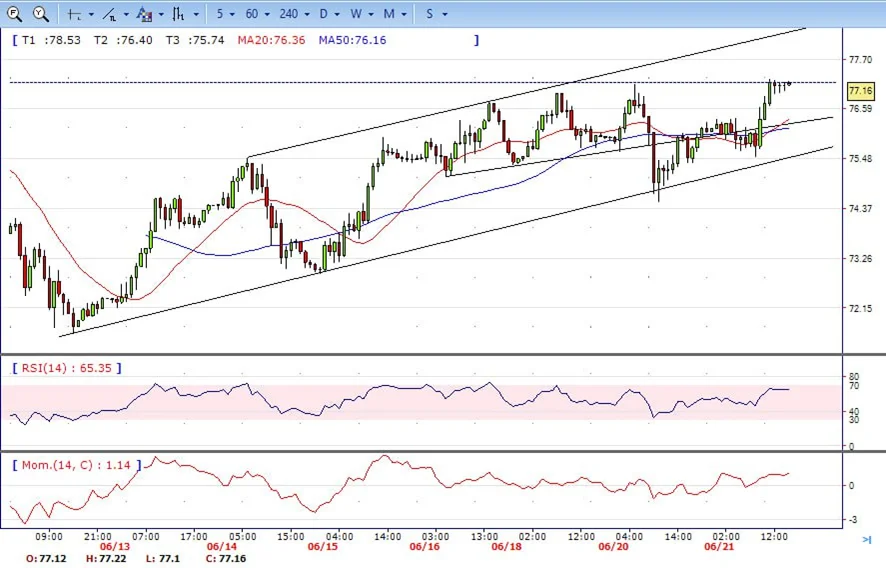
- Brent advanced on Wednesday, climbed from intraday low 75.40 to high 77.24. It holds near the top and end the day around 77.17, up for the day and indicates bullish sign in the hourly chart. Meanwhile, the 20 and 50 SMA started turning north and developing above 200 SMA, indicates bulls not exhausted yet. On upside, overcome 77.25 may encourage bulls to challenge 78.50, break above that level will open the gate to 79.50.
- Technical indicators also suggest bullish movement, hovering above the midline. RSI stabilizes at 65, while the Momentum indicator stabilizes above the midline, suggests upward potentials. On downside, the immediately support is 75.50, break below this level will open the gate for more decline to 74.50 area.
Contact Us
Please, fill the form to get an assistance.


