22/05/2023 Daily Reports
- EUR/USD rebounds from its weekly lows, reclaiming near the 1.0800 figure following US Federal Reserve Jerome Powell’s remarks, in which he opened the door for a pause on the Federal Reserve tightening cycle. In addition, a risk-on impulse dented an upbeat market sentiment, weighed in the US Dollar. At the time of writing, the EUR/USD is trading at 1.0800 after hitting a low of 1.0759.
- US equities are registering solid gains. Fed Chair Jerome Powell indicated that inflation currently exceeds the target level and stresses the Fed’s unwavering commitment to guide inflation back towards the 2% target, asserting that “failure would cause greater harm”. Furthermore, Powell noted the strength of the banking system and suggested that tighter banking credit conditions may prevent a potential rise in rates.
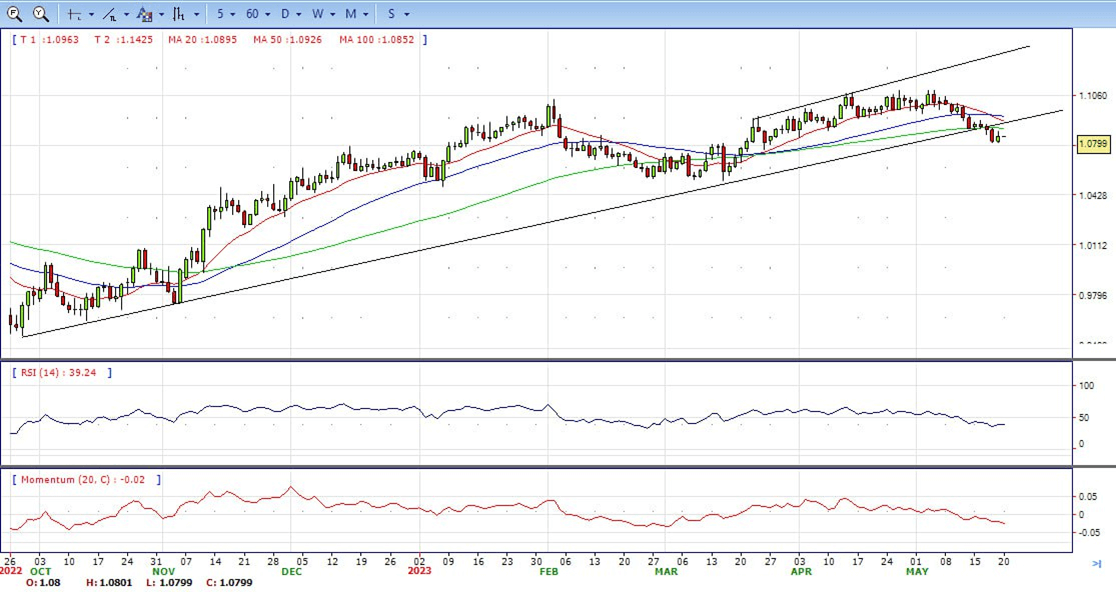
- The EUR/USD pair is trading near the 1.0800, up for the day with bearish stance in daily chart. The pair stabilized below 20 and 50 SMA, indicates bearish strength. Meanwhile, the 20 SMA started turning south and heading towards 50 and 200 SMA, suggests bears not exhausted yet. On upside, the immediate resistance is 1.0850, break above this level will extend the advance to 1.0900.
- Technical readings in the daily chart support the bearish stance. The RSI indicator stabilizes around 39. The Momentum indicator holds below the midline, indicating bearish potentials. On downside, the immediate support is 1.0710 and below this level will open the gate to 1.0630.
- The GBP/USD pair shows some resilience on Friday and stages a solid bounce from sub-1.2400 levels. The pair, however, retreats a few pips from the daily high touched during the early North American session and currently trades around the 1.2440 region, up nearly 0.25% for the day.
- The risk-on impulse – as depicted by a generally positive tone around the equity markets – prompts some profit-taking around the safe-haven US Dollar, especially after the recent run up to a nearly two-month high. This, in turn, is seen as a key factor lending support to the GBP/USD pair, though the upside potential seems limited. Firming expectations that the Federal Reserve (Fed) will keep interest rates higher for longer, along with the latest optimism over the US debt ceiling deal, continue to push the US Treasury bond yields higher and favour the USD bulls.
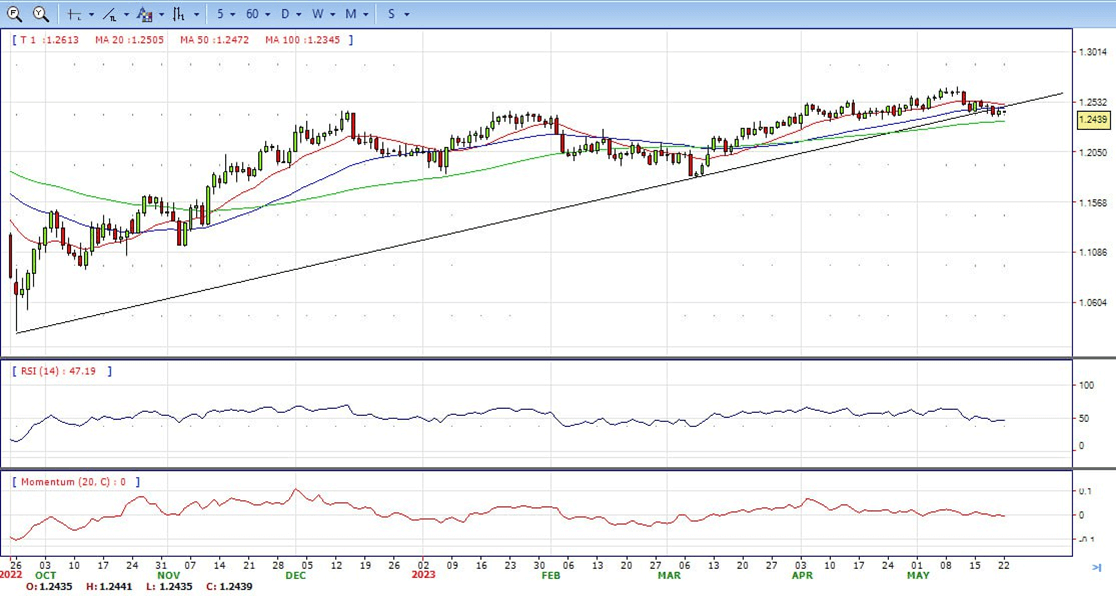
- The GBP/USD offers bearish stance in daily chart. Cable stabilizes below 20 and 50 SMA, indicating bearish strength in short term. Meanwhile, the 20 SMA started turning south and heading towards longer ones, suggests bears not exhausted yet. On upside, the immediate resistance is 1.2545 with a break above it exposing to 1.2600.
- Technical readings in the daily chart support the bearish stances. RSI indicator stabilizes around 47, while the Momentum indicator stabilizes near the midline, suggesting directionless potentials. On downside, the immediate support is 1.2350, unable to defend this level will resume the decline to 1.2270.


- Gold price climbed more than 1% on Friday, trimming some losses sustained during the week as the Fed’s hawkish rhetoric bolstered the greenback, which posted gains of 0.37%, per the US Dollar Index. At the time of writing, XAU/USD is trading at $1977.70, up daily 1.0%.
- XAU/USD bottomed at around $1954.14 as the Federal Reserve Chair Jerome Powell delivered remarks at a conference on Friday. Fed Chair Jerome Powell indicated that inflation currently exceeds the target level and stresses the Fed’s unwavering commitment to guide inflation back towards the 2% target, asserting that “failure would cause greater harm”. Furthermore, Powell noted the strength of the banking system and suggested that tighter banking credit conditions may prevent a potential rise in rates.
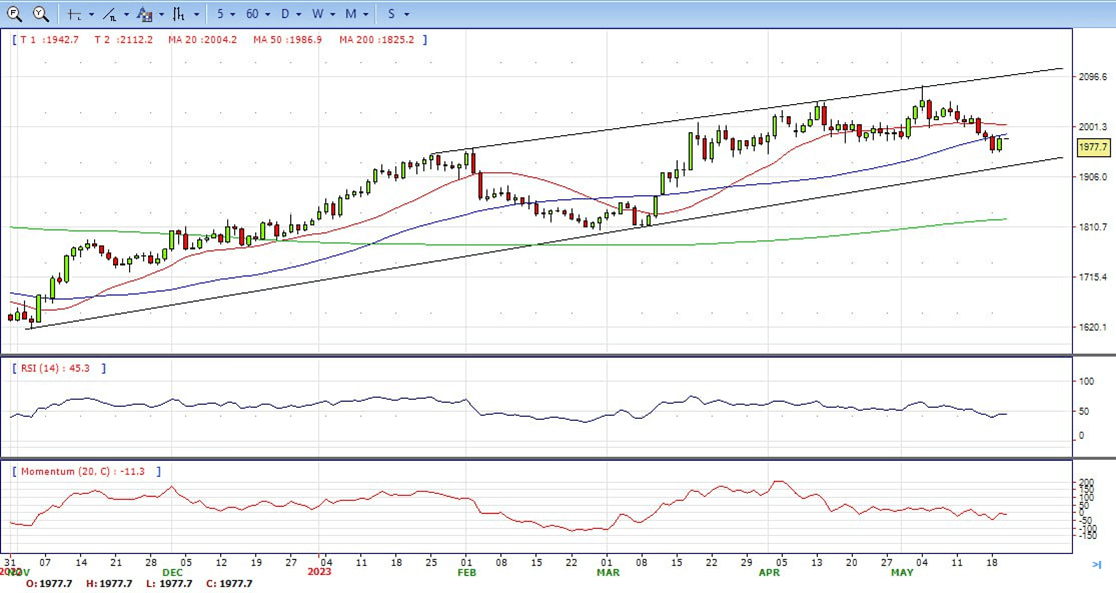
- Gold price stabilized around 1977, up for the day and bearish in the daily chart. The gold price stabilizes below 20 SMA, suggesting bearish strength in short term. However, the 20 SMA started turning flat but continued developing far above 50 and 200 SMA, indicates bulls not exhausted yet. On upside, the immediate resistance is 1993, break above this level will open the gate for more advance to 2022 area.
- From a technical perspective, the RSI indicator holds below the mid-line and stabilizes around 45, on a bearish strength. The Momentum indicator hold in negative territory, suggests downward potentials. On downside, the immediate support is 1950, below this area may resume the decline to 1935.


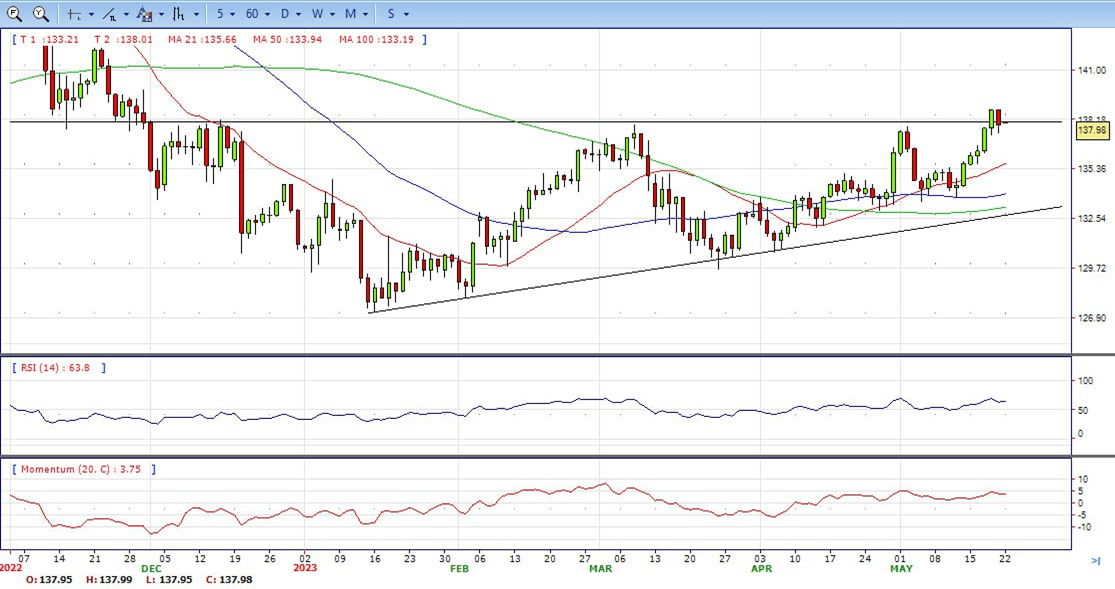
- USD/JPY forms a bearish-engulfing candlestick pattern, snapping five days of gains, down almost 0.60%, after hitting a weekly high of 138.74. Risk-off and a weaker US Dollar, weighed on the USD/JPY pair. At the time of writing, the USD/JPY is trading at 137.90, below its opening price.
- The US Dollar bulls opt to take some profits off the table following the recent run-up to a nearly two-month high, which, in turn, is seen as a key factor dragging the USD/JPY lower. The downside for the USD, however, remains cushioned amid firming expectations that the Fed will keep interest rates higher for longer. In fact, Dallas Fed President Lorie Logan said on Thursday that the economic data points so far don’t justify skipping a rate increase at the next policy meeting in June. This comes on the back of the recent hawkish comments by several Fed officials and forces investors to scale back their bet for rate cuts later this year.
- The USD/JPY pair stabilized around 137.90, down for the day and neutral to bullish in the daily chart. The price stabilizes above 20 and 50 SMA, suggests bullish strength in short term. Meanwhile, 20 SMA continued accelerating north and developing above longer ones, indicating bulls not exhausted. On upside, overcome 140.00 may encourage bulls to challenge 142.30, break above that level will open the gate to 145.00.
- Technical indicators suggest the bullish strength. RSI stabilizes around 64, while the Momentum indicator stabilizes above the midline, suggests upward potentials. On downside, the immediate support is 137.80, break below this level will open the gate to 135.50 area.
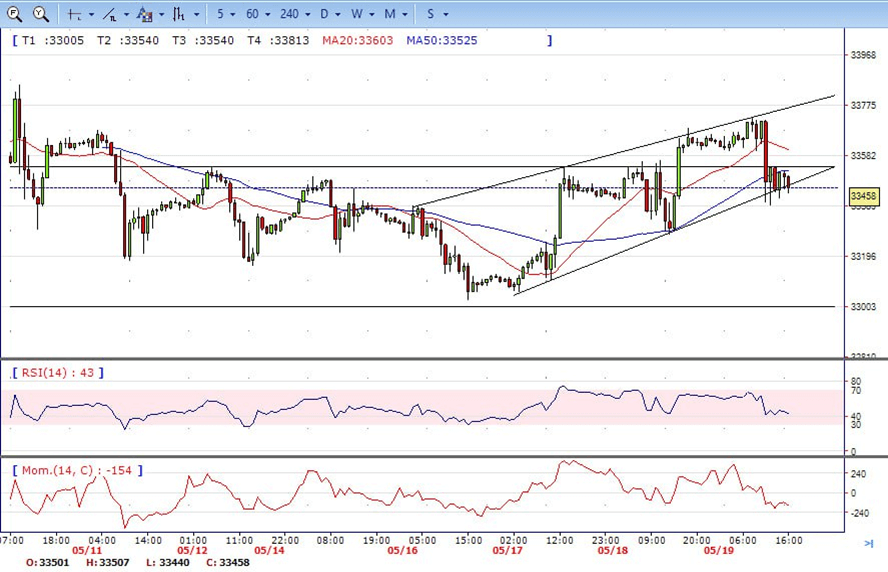
- DJI climbed to intraday high 33720 on the first half of the day, but failed to hold the gains in the US session and dropped to low 33390. Market ended the week around 33450, below 20 and 50 SMA, suggests bearish strength. Meanwhile, 20 SMA started turning south and heading towards longer ones, suggests bears not exhausted yet. On upside, overcome 33850 may encourage bulls to challenge 34100, break above that level will open the gate to 34360.
- Technical indicators suggest the bearish movement. RSI stabilizes around 42, while the Momentum indicator stabilizes below the midline, suggests downward potentials. On downside, the immediately support is 33280, break below this level will open the gate for more decline to 33000 area.
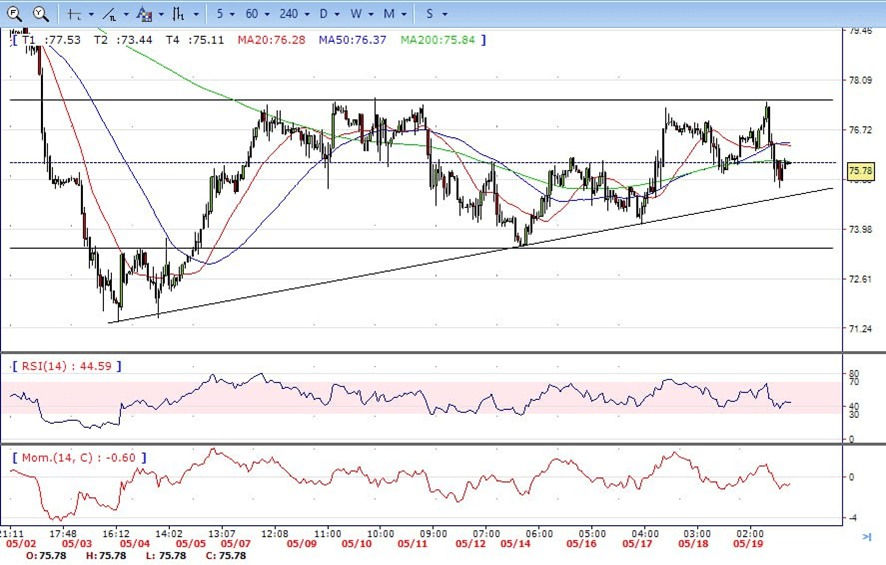
- Brent consolidated in the familiar range, traded from intraday high 77.50 area to low 75.10 level. It ended the day around 75.75, slightly down for the day and indicates bearish sign in the hourly chart. Meanwhile, the 20 SMA started turning south and heading towards longer ones, indicates bears not exhausted yet. On upside, overcome 77.60 may encourage bulls to challenge 79.20, break above that level will open the gate to 80.50.
- Technical indicators also suggest bearish movement, hovering below the midline. RSI stabilizes at 44, while the Momentum indicator stabilizes in negative territory, suggests downward potentials. On downside, the immediately support is 75.00, break below this level will open the gate for more decline to 73.50 area.