19/05/2023 Daily Reports
- EUR/USD is attempting to correct the heavy selling that has taken place over the course of several days. EUR/USD is currently trading at 1.0773 and is down some 0.66%, traveling between a low of 1.0762 and 1.0848 the high.
- No data releases in the euro docket leaves the attention to the US data space, where Initial Jobless Claims rose by 242K in the week to May 13 and the Philly Fed Manufacturing index improved to -10.4 in May. In addition, Existing Home Sales dropped 3.4% MoM in April (4.28M units) and the CB Leading Index contracted 0.6% MoM in April. As seen in past days, the persisting risk aversion appears propped up by uncertainty around the US debt ceiling issue, while now dwindling speculation of a potential pause by the Fed in June also adds to the dollar’s upside bias.
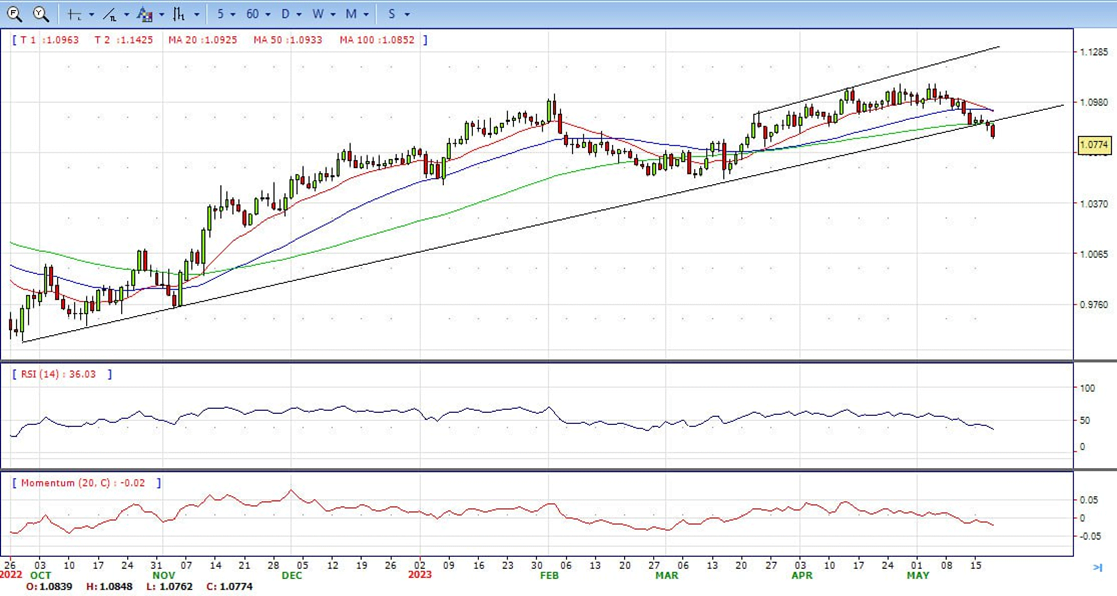
- The EUR/USD pair is trading near the 1.0775, down for the day with bearish stance in daily chart. The pair stabilized below 20 and 50 SMA, indicates bearish strength. Meanwhile, the 20 SMA started turning south and heading towards 50 and 200 SMA, suggests bears not exhausted yet. On upside, the immediate resistance is 1.0850, break above this level will extend the advance to 1.0900.
- Technical readings in the daily chart support the bearish stance. The RSI indicator stabilizes around 35. The Momentum indicator holds below the midline, indicating bearish potentials. On downside, the immediate support is 1.0710 and below this level will open the gate to 1.0630.
- GBP/USD prolongs its falls past the 1.2400 figure, reaching a new three-week low at around 1.2397, as the Pound Sterling takes a hit, taking advantage of a light economic calendar in the UK. Fears of a possible default in the US are fading, as talks between US Congress leaders and the White House showed hope that an agreement would emerge before June 1. The GBP/USD is trading at 1.2410 after hitting a daily high of 1.2492.
- The US Bureau of Labor Statistics released a robust labor market report. Initial Jobless Claims for the week ending May 13 recorded a lower-than-expected rise of 242K, a noticeable drop from the previous week’s 254K. In the meantime, although negative, the Philadelphia Fed Manufacturing Index outperformed expectations, with the index dropping to -10.4, better than the anticipated fall of -19.8, and showed a significant recovery from April’s dismal -31.3.
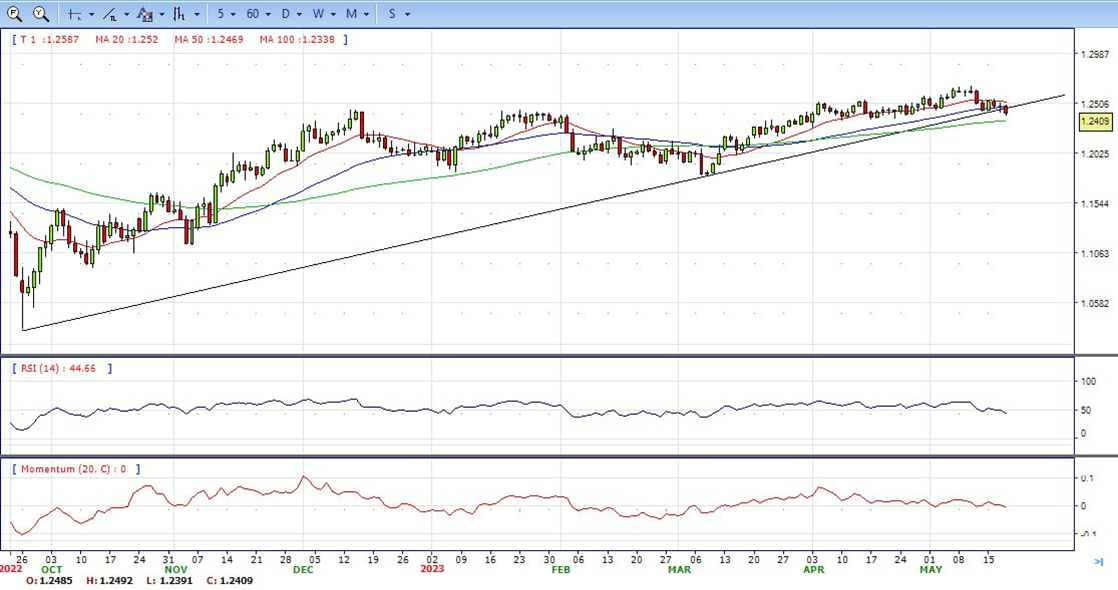
- The GBP/USD offers bearish stance in daily chart. Cable stabilizes below 20 and 50 SMA, indicating bearish strength in short term. Meanwhile, the 20 SMA started turning south and heading towards longer ones, suggests bears not exhausted yet. On upside, the immediate resistance is 1.2545 with a break above it exposing to 1.2600.
- Technical readings in the daily chart support the bearish stances. RSI indicator stabilizes around 44, while the Momentum indicator stabilizes near the midline, suggesting directionless potentials. On downside, the immediate support is 1.2350, unable to defend this level will resume the decline to 1.2270.


- Gold price continues drifting lower for the third successive day on Thursday – also marking the sixth day of a negative move in the previous seven – and dives to its lowest level since April 03 during the early North American session. The XAU/USD is currently placed around the $1,957region, down over 1% for the day, and seems poised to prolong its recent sharp retracement slide from the all-time high touched earlier this month.
- A combination of supporting factors pushes the USD to a nearly two-month high, which, in turn, is seen weighing heavily on the Gold price. Against the backdrop of the recent hawkish signals from several Fed officials, the optimism over the potential lifting of the US debt ceiling remains supportive of the elevated US Treasury bond yields and acts as a tailwind for the Greenback. The intraday USD buying picks up pace following the release of the mostly upbeat US macro data, which showed that Initial Jobless Claims fell to 242K last week and the Philly Fed Manufacturing Index improved to -10.4 in May from -31.3 previous.
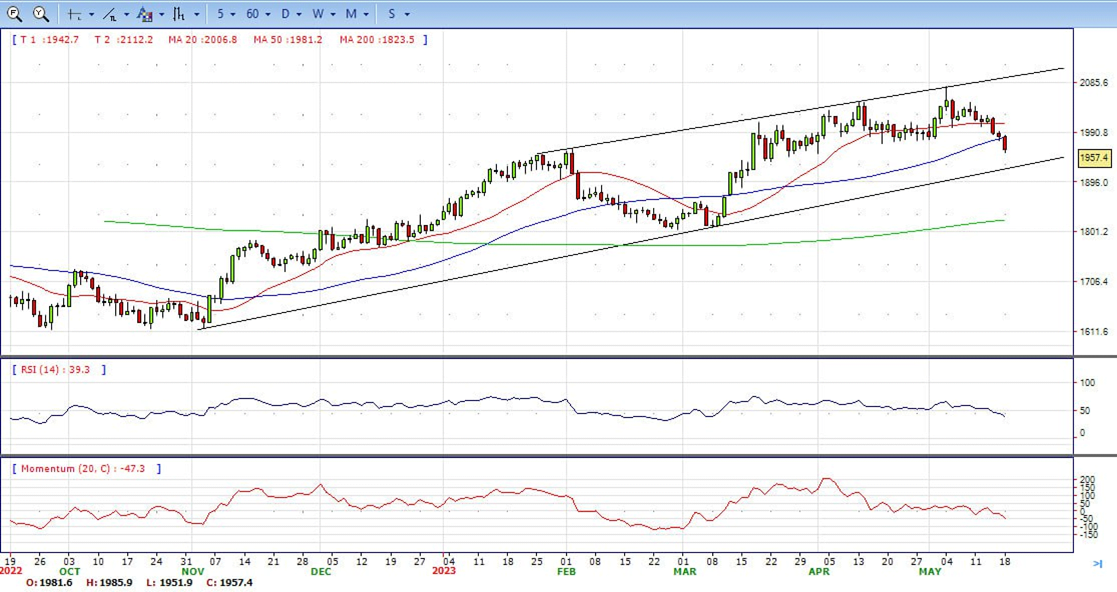
- Gold price stabilized around 1957, down for the day and bearish in the daily chart. The gold price stabilizes below 20 SMA, suggesting bearish strength in short term. However, the 20 SMA started turning flat but continued developing far above 50 and 200 SMA, indicates bulls not exhausted yet. On upside, the immediate resistance is 1993, break above this level will open the gate for more advance to 2022 area.
- From a technical perspective, the RSI indicator holds below the mid-line and stabilizes around 39, on a bearish strength. The Momentum indicator hold in negative territory, suggests downward potentials. On downside, the immediate support is 1950, below this area may resume the decline to 1935.


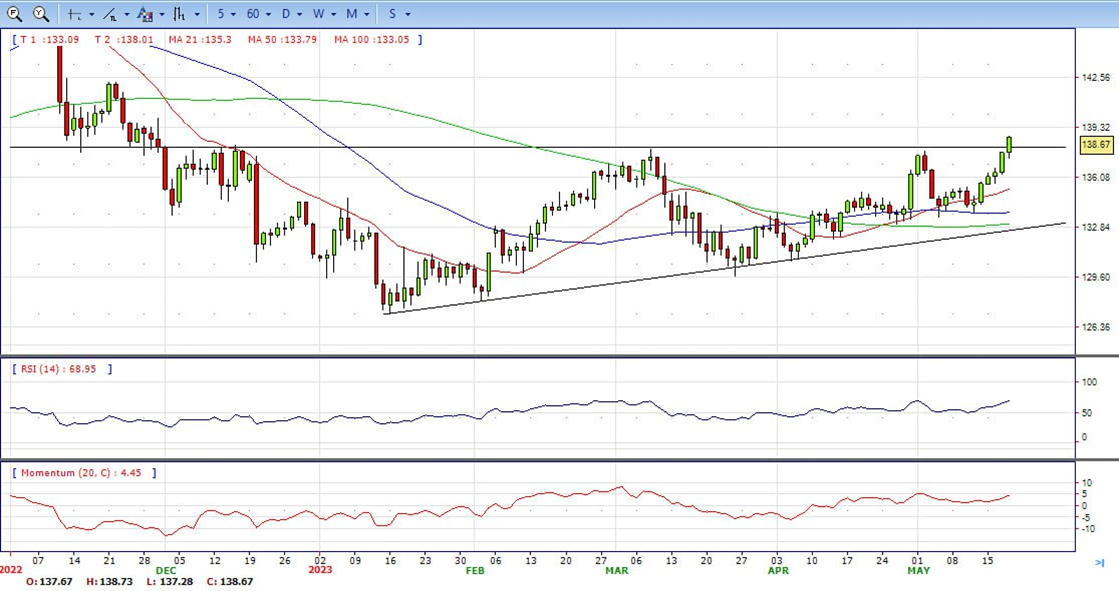
- USD/JPY climbs to YTD highs of 138.67, bolstered by higher US T-bond yields, amidst an upbeat sentiment sponsored by improvement in the US debt ceiling talks. In addition, solid US jobs data, alongside strong Retail Sales, Industrial Production, and a surprising hawkish comment by Dallas Fed President Lorie Logan, propelled the USD/JPY. At the time of writing, the USD/JPY is trading at 138.67 after hitting a low of 137.28.
- The US Dollar buying remains unabated amid the latest optimism over the potential lifting of the potential lifting of the US debt ceiling, which, in turn, is seen as a key factor acting as a tailwind for the USD/JPY pair. In fact, US President Joe Biden and top U.S. congressional Republican Kevin McCarthy underscored their determination to reach an agreement soon to raise the federal government’s $31.4 trillion debt ceiling.
- The USD/JPY pair stabilized around 138.67, up for the day and neutral to bullish in the daily chart. The price stabilizes above 20 and 50 SMA, suggests bullish strength in short term. Meanwhile, 20 SMA continued accelerating north and developing above longer ones, indicating bulls not exhausted. On upside, overcome 140.00 may encourage bulls to challenge 142.30, break above that level will open the gate to 145.00.
- Technical indicators suggest the bullish strength. RSI stabilizes around 70, while the Momentum indicator stabilizes above the midline, suggests upward potentials. On downside, the immediate support is 137.80, break below this level will open the gate to 135.50 area.
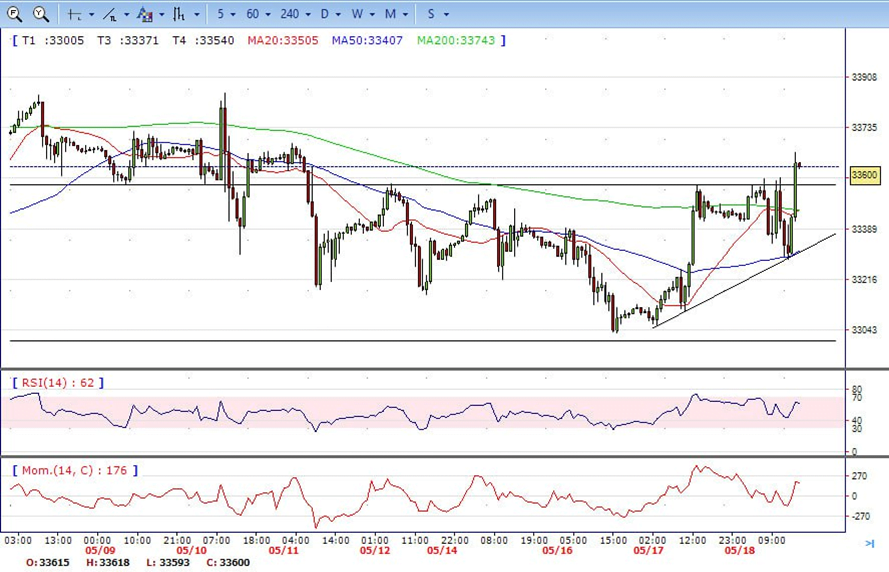
- DJI tumbled to low 33280 level on the first half of the day and made a U turn from here, jumped to high 33650 area. It retreated modestly and ended the day around 33600. Right now market is standing above 20 and 50 SMA, suggests bullish strength. Meanwhile, 20 SMA started turning north and heading towards longer ones, suggests bulls not exhausted yet. On upside, overcome 33650 may encourage bulls to challenge 33850, break above that level will open the gate to 34100.
- Technical indicators suggest the bullish movement. RSI stabilizes around 61, while the Momentum indicator stabilizes above the midline, suggests upward potentials. On downside, the immediately support is 33280, break below this level will open the gate for more decline to 33000 area.
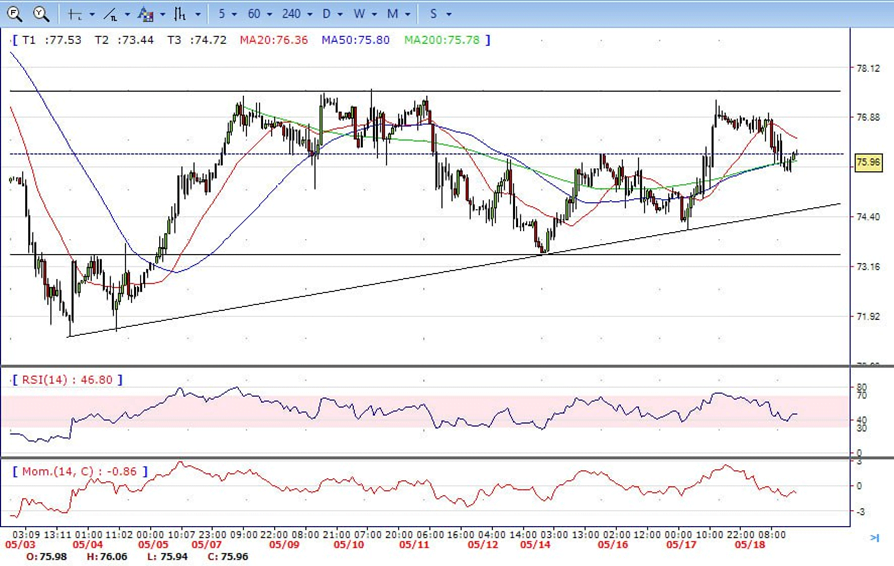
- Brent dropped modestly on Thursday, retreated from intraday high 77.00 area to low 75.50 level. It recovered modestly after then and ended the day around 76.00, down for the day and indicates bearish sign in the hourly chart. Meanwhile, the 20 SMA started turning south and heading towards longer ones, indicates bears not exhausted yet. On upside, overcome 77.60 may encourage bulls to challenge 79.20, break above that level will open the gate to 80.50.
- Technical indicators also suggest bearish movement, hovering below the midline. RSI stabilizes at 47, while the Momentum indicator stabilizes in negative territory, suggests downward potentials. On downside, the immediately support is 75.50, break below this level will open the gate for more decline to 73.50 area.