21/06/2023 Daily Reports
- The initial upward movement of the EUR against the USD towards the 1.0950 level has been reversed, leading EUR/USD to shift its focus towards the downside, specifically targeting the 1.0900 area.
- In Germany, Producer Prices experienced a monthly decline of 1.4% in May but recorded a year-on-year increase of 1.0%. On the US front, Building Permits expanded by 5.2% month-on-month in May, reaching 1.491 million units, while Housing Starts rose significantly by 21.7% month-on-month, totalling 1.631 million units. Furthermore, speeches by St. Louis Fed member J. Bullard, who holds a hawkish stance and is a voter in 2025, and NY Fed member J. Williams, a centrist permanent voter, are also scheduled.
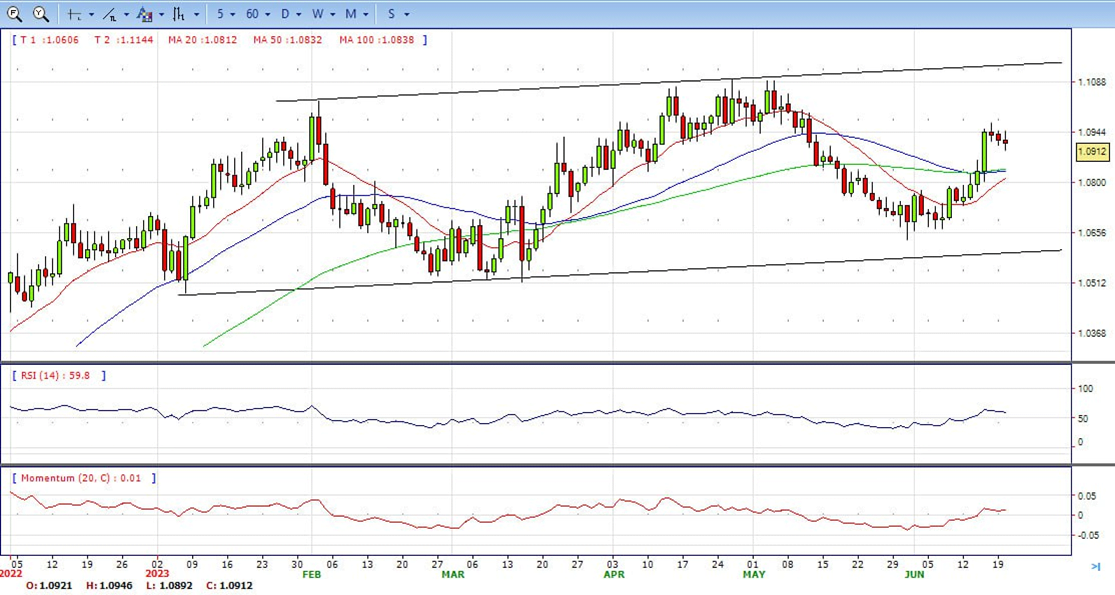
- The EUR/USD pair is trading near the 1.0912, modestly down for the day with bullish stance in daily chart. The pair stabilized above all main SMAs, indicates bullish strength. Meanwhile, the 20 SMA started turning north and heading towards 50 and 200 SMA, suggests bulls not exhausted yet. On upside, the immediate resistance is 1.0970, break above this level will extend the advance to 1.1010.
- Technical readings in the daily chart support the bullish stance. The RSI indicator stabilizes around 59. The Momentum indicator holds above the midline, indicating upward potentials. On downside, the immediate support is 1.0860 and below this level will open the gate to 1.0800.
- GBP/USD retraces after hitting a new YTD high of 1.2848 in the last week, down 0.34% back at the 1.2700 handle, amidst a strong USD. Expectations for additional tightening by the US Fed and an “overbought” US equity market dampened investors’ mood. At the time of writing, the GBP/USD is trading at 1.2755 after hitting a high of 1.2806.
- The Bank of England is expected to raise rates on Thursday, with markets pricing in a 25 bps hike. A day earlier, inflation data in the UK would be revealed, with expectations leaning toward a slowdown in headline and core CPI in yearly and monthly readings. Upward surprises could further cement market participants’ expectations that the BoE would raise rates by 100 bps toward the end of 2023. That should be positive for the GBP/USD, with traders looking for a reason to challenge the 1.30 figure.
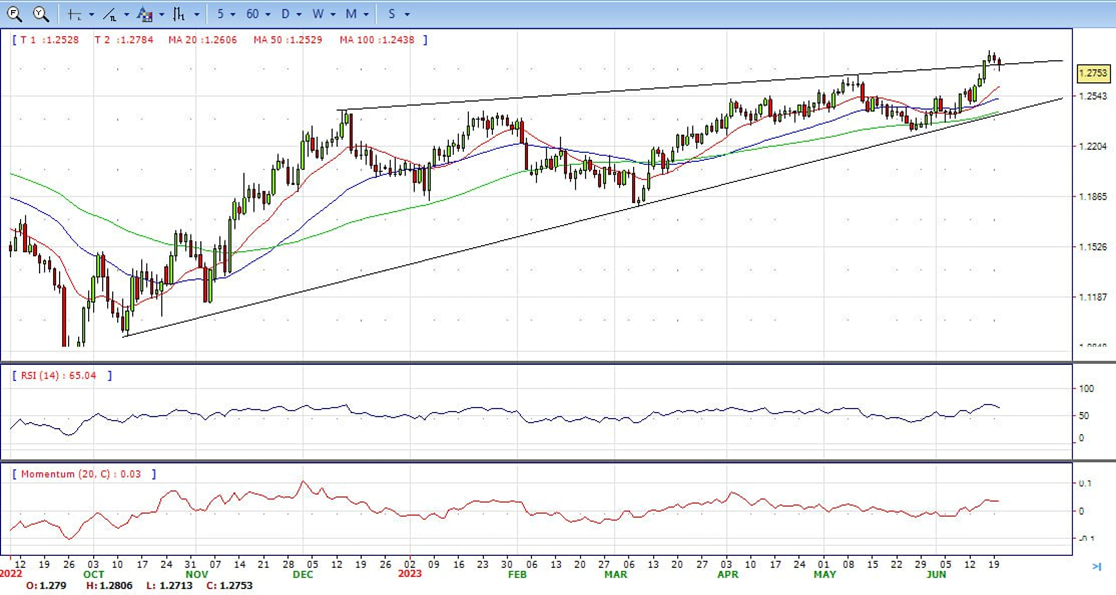
- The GBP/USD offers bullish stance in daily chart. Cable stabilizes above 20 and 50 SMA, indicating bullish strength in short term. Meanwhile, the 20 and 50 SMA started turning flat but continued developing above longer ones, suggests bulls not exhausted yet. On upside, the immediate resistance is 1.2850 with a break above it exposing to 1.3000.
- Technical readings in the daily chart support the bullish stances. RSI indicator stabilizes around 65, while the Momentum indicator stabilizes above the midline, suggesting upward potentials. On downside, the immediate support is 1.2710, unable to defend this level will resume the decline to 1.2630.


- Gold price tumbled sharply in the North American session as trading resumed after a holiday in the US. A stronger USD is the main reason behind XAU/USD’s fall, as the US Treasury bond yield slid, with traders eyeing Fed Chair Jerome Powell’s testimony at the US Congress. At the time of writing, XAU/USD is trading at $1938 after hitting a daily high of $1956.
- US equities continue to trade negatively. The US 10-year benchmark note dropped more than ten basis points at 3.707%, a tailwind for Gold prices, which remained downward pressured. Even though the CME FedWatch Tool shows, traders expect a 25 bps increase at the July FOMC meeting. It should be said that despite Federal Reserve officials forecasting 50 bps increases to the Federal Funds Rate, market participants are not, as shown by CME data.
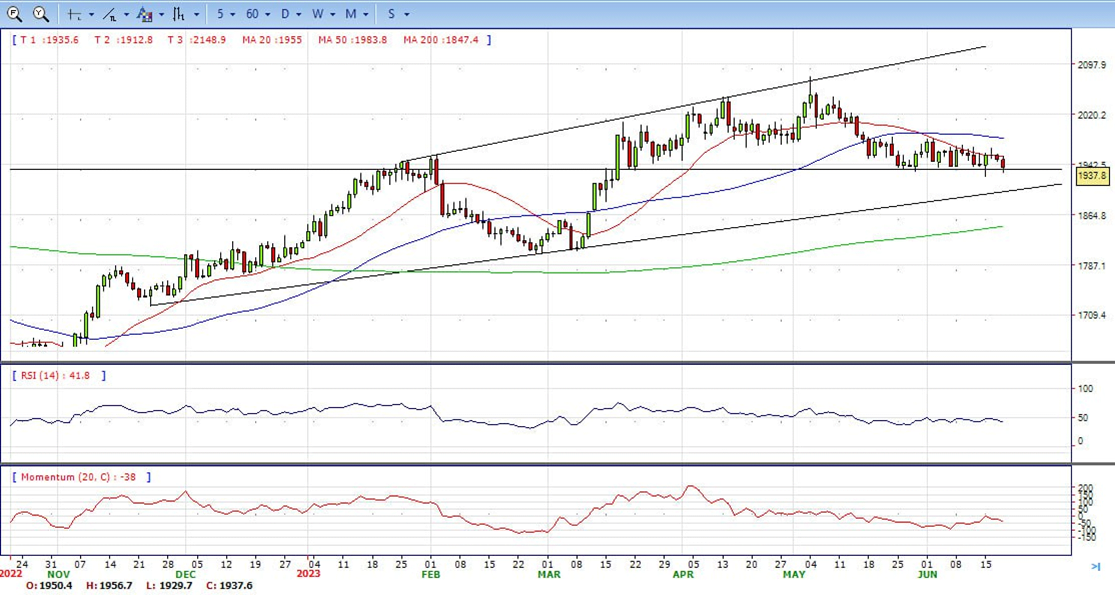
- Gold price stabilized around 1938, down for the day and bearish in the daily chart. The gold price stabilizes below 20 SMA, suggesting bearish strength in short term. Meanwhile, the 20 SMA started turning flat but continued developing below 50 SMA, indicates bears not exhausted yet. On upside, the immediate resistance is 1985, break above this level will open the gate for more advance to 2000 area.
- From a technical perspective, the RSI indicator holds below the midline and stabilizes around 43, on a bearish strength. While the Momentum indicator also stabilized in the negative territory, suggests downward potentials. On downside, the immediate support is 1925, below this area may resume the decline to 1900.


- The USD/JPY fell to negative territory losing over 40 pips below the 141.50 area as the Yen gained interest as markets anticipated a BoJ stealth intervention. However, the Japanese currency remains vulnerable amid the rate cuts announced by the People Bank of China, which fuelled global economic downturn worries.
- On the US Dollar side, the Greenback gained traction on the back of upbeat housing market data. The US Census Bureau’s May Housing Starts data surpassed expectations with a significant increase of 21.7%, outperforming the anticipated 0.8% decline. Similarly, Building Permits for the same month exceeded consensus by rising 5.2% instead of the expected 5% and helped the USD hold its ground as the DXY index trades with gains at the 102.75 area.
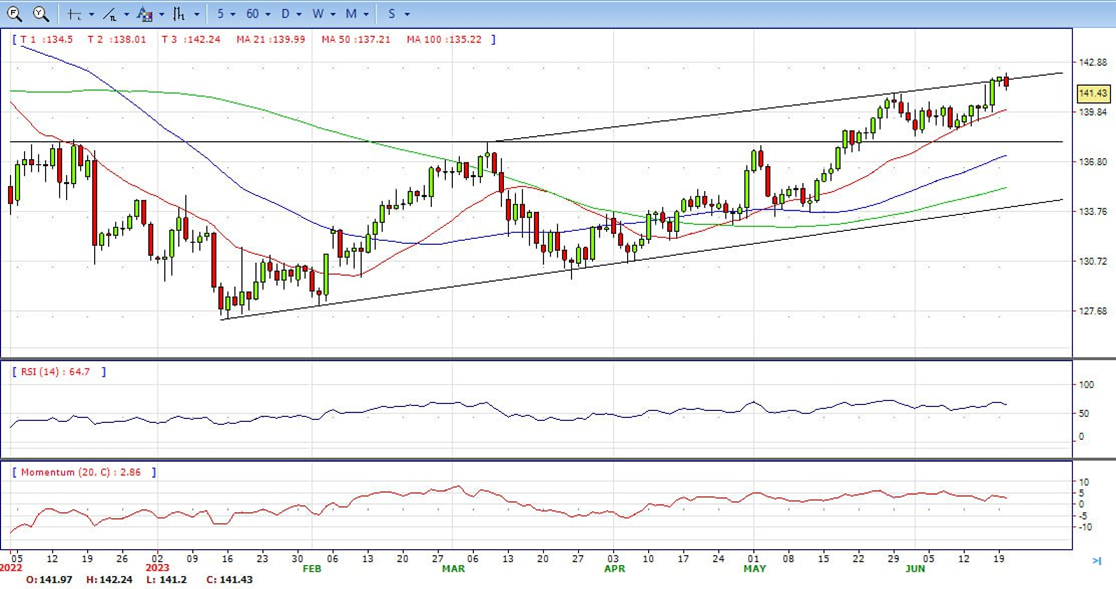
- The USD/JPY pair stabilized around 141.43, down for the day and bullish in the daily chart. The price stabilizes above 20 and 50 SMA, suggests bullish strength in short term. Meanwhile, 20 SMA continued accelerating north and developing above longer ones, indicating bulls not exhausted. On upside, overcome 142.20 may encourage bulls to challenge 144.00, break above that level will open the gate to 145.50.
- Technical indicators suggest the bullish strength. RSI stabilizes around 65, while the Momentum indicator stabilizes above the midline, suggests upward potentials. On downside, the immediate support is 140.80, break below this level will open the gate to 139.80 area.
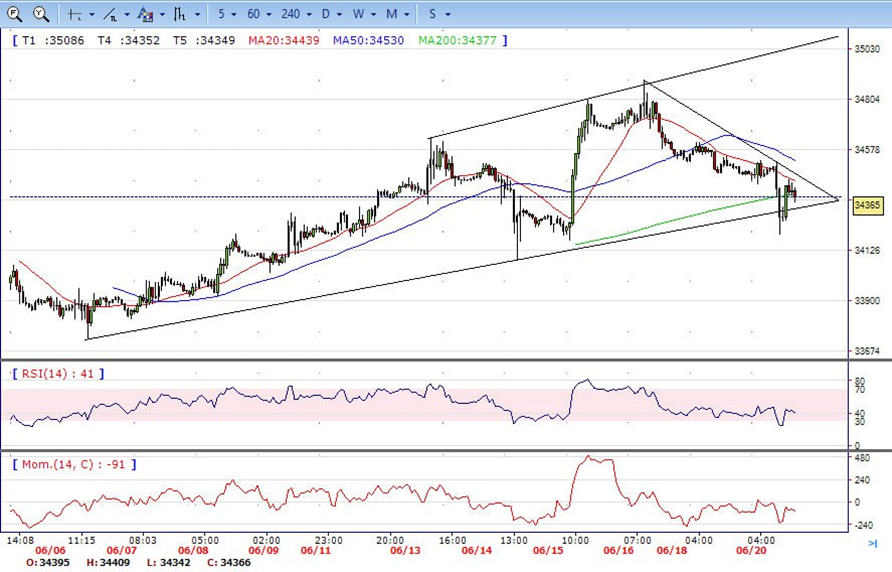
- DJI continued under the sell pressure on Tuesday. It declined to 34200 area and then trimmed some losses and ended the day around 34350, below 20 SMA, suggests bearish strength. Meanwhile, 20 SMA continued accelerating south and heading towards longer ones, suggests bears not exhausted yet. On upside, overcome 34450 may encourage bulls to challenge 34620, break above that level will open the gate to 34900.
- Technical indicators suggest the bearish movement. RSI stabilizes around 37, while the Momentum indicator stabilizes below the midline, suggests downward potentials. On downside, the immediately support is 34200, break below this level will open the gate for more decline to 34000 area.
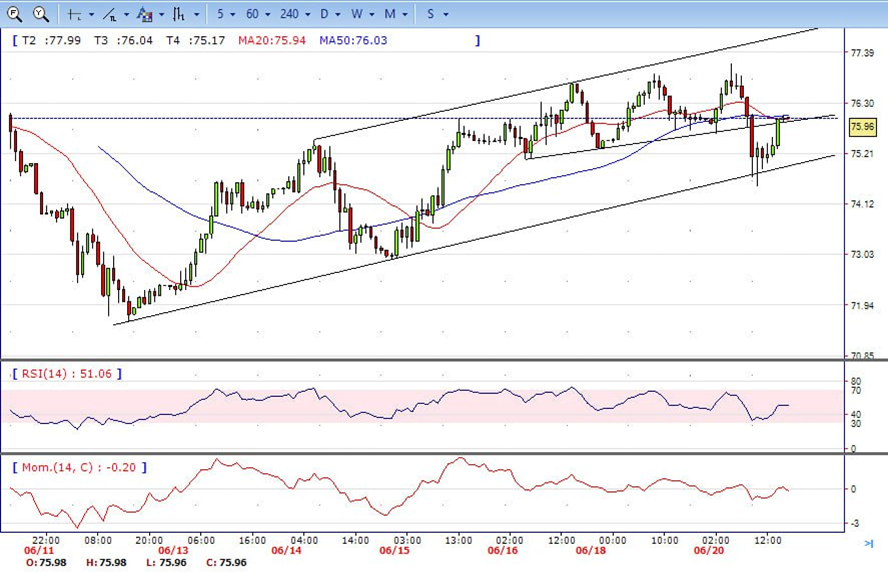
- Brent under the sell pressure on the first half of the day, tumbled to intraday low 74.50 area. It bounced from there and trimmed all the losses to end the day around 76.00, unchanged for the day and indicates neutral sign in the hourly chart. Meanwhile, the 20 and 50 SMA started turning flat but developing above 200 SMA, indicates bulls not exhausted yet. On upside, overcome 77.15 may encourage bulls to challenge 78.50, break above that level will open the gate to 79.50.
- Technical indicators also suggest neutral movement, hovering near the midline. RSI stabilizes at 51, while the Momentum indicator stabilizes near the midline, suggests directionless potentials. On downside, the immediately support is 74.50, break below this level will open the gate for more decline to 73.00 area.