21/03/2023 Daily Reports
- The EUR/USD breaks the 1.0700 barrier and climbs 0.50% after hitting a daily low of 1.0631. An improvement in market mood and ECB speakers lend a hand to the Euro, while the USD continues to weaken across the board. At the time of writing, the EUR/USD is trading at 1.0720.
- Market sentiment improved after UBS bought its Swiss rival Credit Suisse. The financial market turbulence has spurred speculations that global central banks could pause the pace of tightening. However, traders expect a 25 bps rate hike by the Fed on Wednesday. The CME Fed Watch Tool odds for a quarter of a percentage point lift at 73.10%.
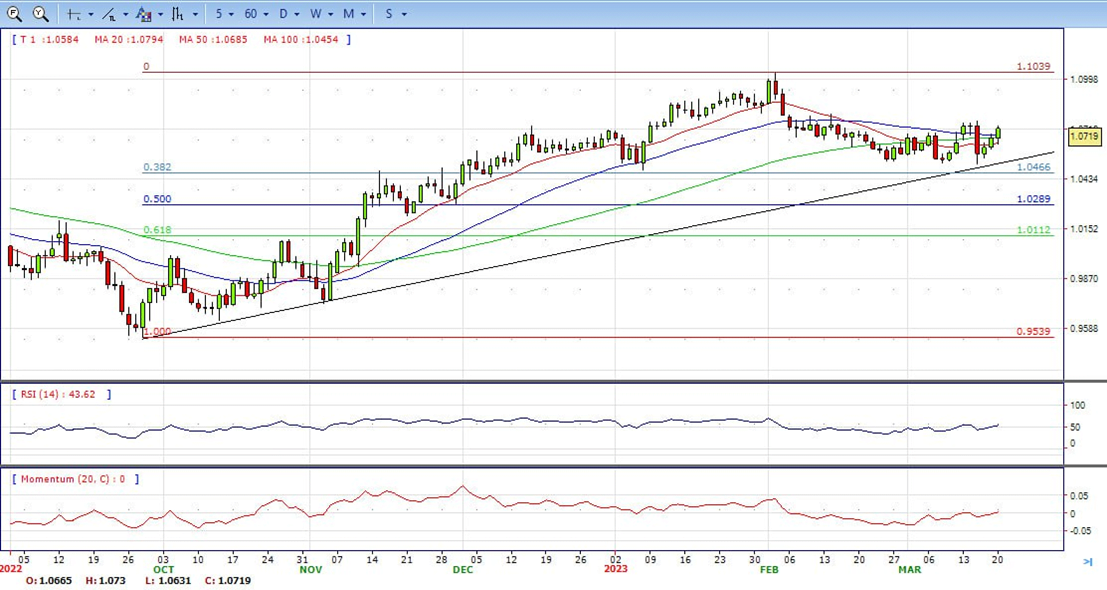
- The EUR/USD pair is trading near the 1.0720, up for the day with bullish stance in daily chart. The pair stabilized above 20 and 50 SMA, indicates bullish strength. Meanwhile, the 20 SMA started turning north and heading towards 50 and 200 SMA, suggests bulls not exhausted yet. On upside, the immediate resistance is 1.0760, break above this level will extend the advance to 1.0800.
- Technical readings in the daily chart support the bullish stance. The RSI indicator stabilizes around 56. The Momentum indicator holds near the midline, indicating directionless potentials. On downside, the immediate support is 1.0630 and below this level will open the gate to 1.0550.
- The GBP/USD pair builds on last week’s rally from the vicinity of the 1.2000 psychological mark and gains positive traction for the third successive day on Monday. The momentum remains uninterrupted through the early North American session and lifts spot prices to over a one-month high, around the 1.2270 region in the last hour.
- An intraday turnaround in the global risk sentiment – as depicted by a solid recovery in the US equity futures – drags the safe-haven USD to its lowest level since February 14, which, in turn, acts as a tailwind for the GBP/USD pair. The USD is further pressured by diminishing odds for a more aggressive policy tightening by the Fed, especially after the recent collapse of two mid-size US banks – Silicon Valley Bank and Signature Bank.
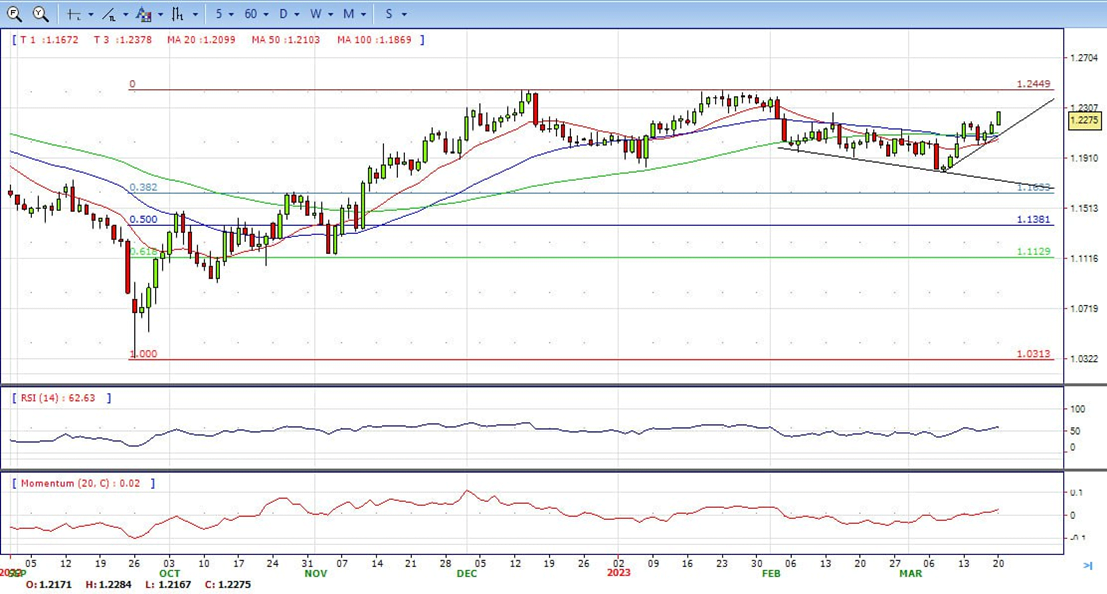
- The GBP/USD offers bullish stance in daily chart. Cable stabilizes above 20 and 50 SMA, indicating bullish strength in short term. Meanwhile, the 20 SMA started turning north and heading towards longer ones, suggests bulls not exhausted yet. On upside, the immediate resistance is 1.2280 with a break above it exposing to 1.2450.
- Technical readings in the daily chart support the bullish stances. RSI indicator stabilizes around 60, while the Momentum indicator stabilizes above the midline, suggesting upward potentials. On downside, the immediate support is 1.2140, unable to defend this level will resume the decline to 1.2010.


- Gold price pauses in its uptrend after spiking higher on safe-haven demand, as fears of global banking contagion persist. XAU/USD is trading at $1,980 per Troy Ounce at the time of writing, down 0.5% on the day. The precious metal is in a short-term uptrend, however, with the odds favouring more upside to come.
- A deal to enable rival UBS to take over troubled lender Credit Suisse over the weekend temporarily reassured investors in the early European session and stabilized sentiment but relief was temporary. Fears around wider banking stability continue to propel investors into safe-haven assets.
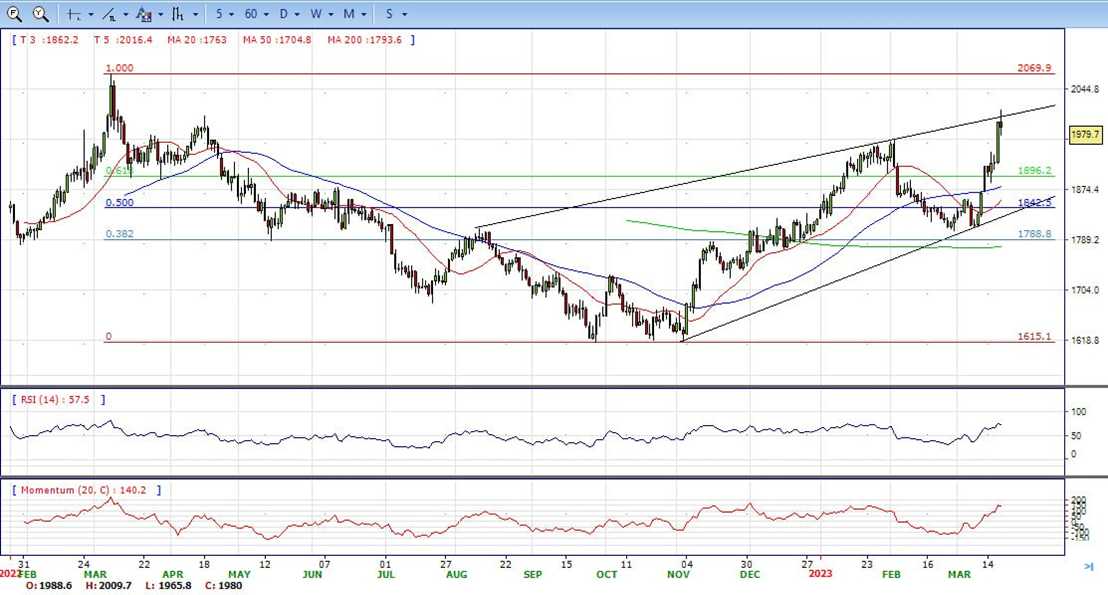
- Gold price stabilized around 1980, down for the day and bullish in the daily chart. The gold price still stabilizes above all main SMAs, suggesting bullish strength in short term. Meanwhile, the 20 and 50 SMA started turning north and continued developing far above 200 SMA, indicates bulls not exhausted yet. On upside, the immediate resistance is 2010, break above this level will open the gate for more advance to 2030 area.
- From a technical perspective, the RSI indicator holds above the mid-line and stabilizes around 72, on a bullish strength. The Momentum indicator hold in the positive territory, suggests upward potentials. On downside, the immediate support is 1958, below this area may resume the decline to 1920.


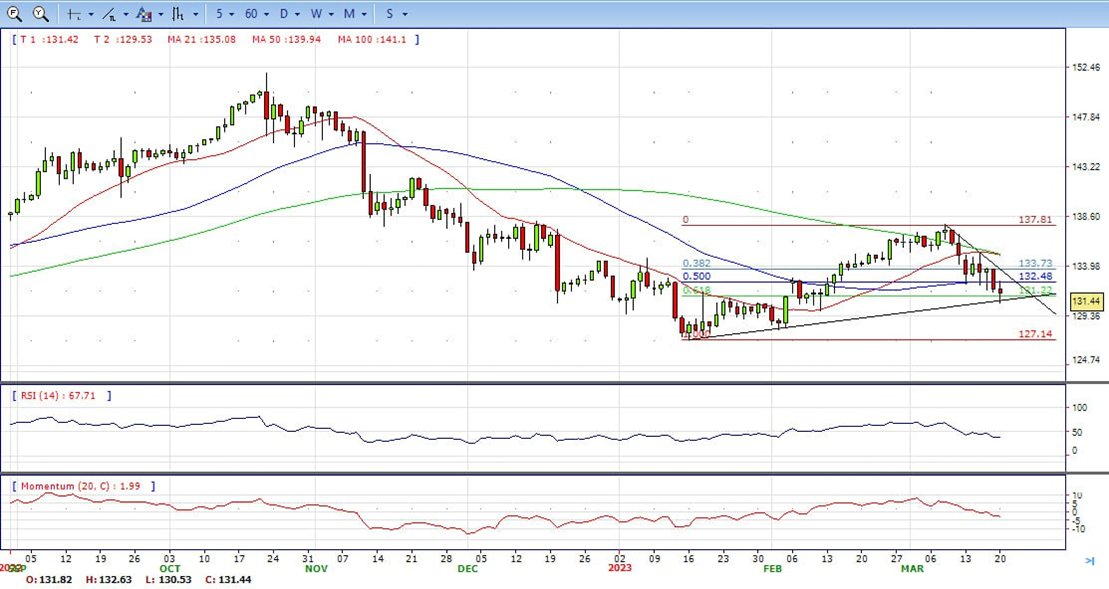
- The USD/JPY pair finds decent support in the vicinity of the mid-130.00s and stages a goodish intraday recovery of over 100 pips from its lowest level since February 10 touched earlier this Monday. The pair, however, keeps the red for the second straight day and trades just below the 131.50 region during the North American session, down less than 0.3% for the day.
- Apart from this, the Fed-BoJ policy outlook turns out to be another factor that assists the USD/JPY pair to attract some buyers at lower levels. Traders also opt to lighten their bearish bets ahead of the highly-anticipated FOMC monetary policy meeting, starting this Tuesday. The Fed will announce its decision on Wednesday, which will drive the USD demand and help determine the next leg of a directional move for the major.
- The USD/JPY pair stabilized around 131.45, down for the day and bearish in the daily chart. The price stabilizes below 20 and 50 SMA, suggests bearish strength in short term. Meanwhile, 20 SMA started turning north and heading towards longer ones, indicating bears not exhausted. On upside, overcome 132.60 may encourage bulls to challenge 133.80, break above that level will open the gate to 135.10.
- Technical indicators suggest the bearish strength. RSI stabilizes around 38, while the Momentum indicator stabilizes below the midline, suggests downward potentials. On downside, the immediate support is 130.50, break below this level will open the gate to 129.70 area.
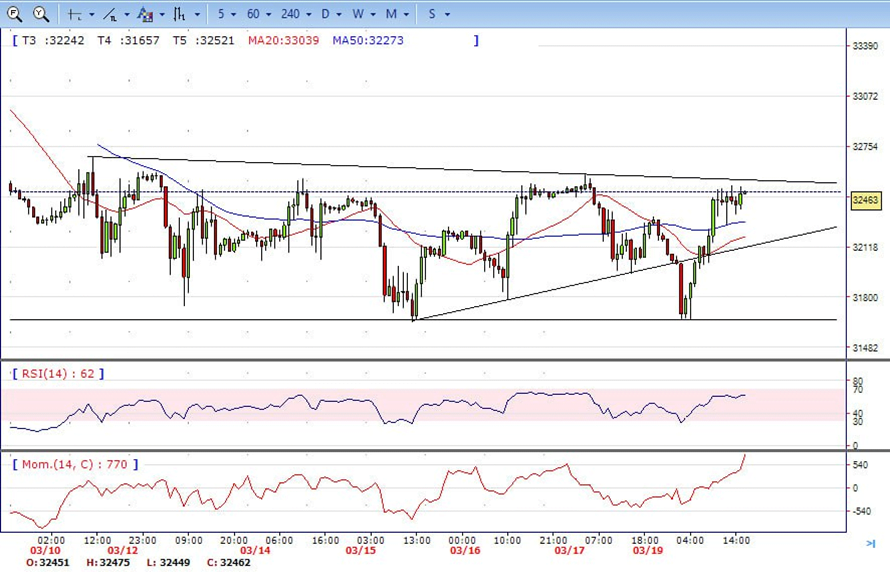
- DJI under the sell pressure on the first half of the day, dropped to intraday low 31656 area. It then recovered from here and bounced quickly to high 32508. DJI ended the day around 32460, up for the day and indicates bullish sign in the hourly chart. Right now market is standing above 20 and 50 SMA, suggests bullish strength. Meanwhile, 20 SMA started turning north and heading towards longer ones, suggests bulls not exhausted yet. On upside, overcome 32580 may encourage bulls to challenge 32900, break above that level will open the gate to 33280.
- Technical indicators suggest the bullish movement. RSI stabilizes around 62, while the Momentum indicator stabilizes in positive territory, suggests upward potentials. On downside, the immediately support is 32250, break below this level will open the gate for more decline to 31950 area.
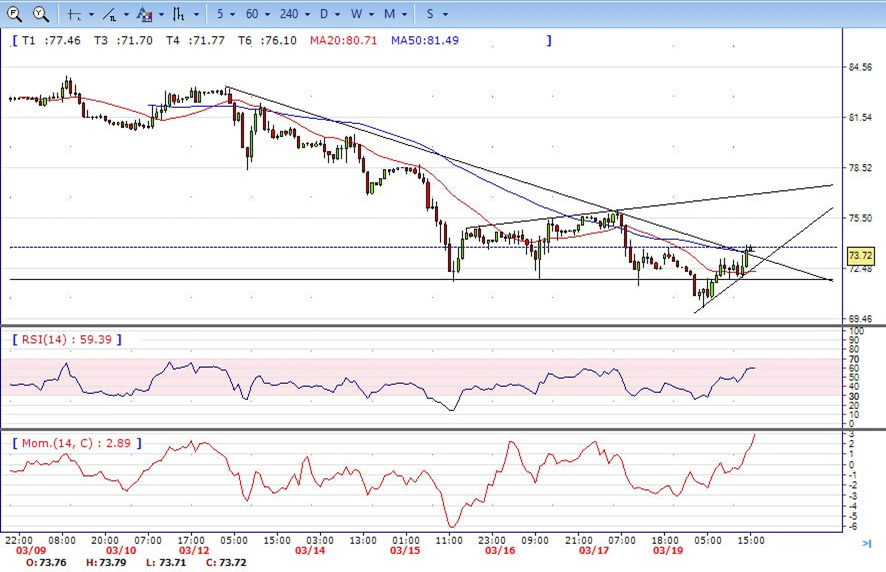
- Brent under the sell pressure on the first half of the day, dropped to intraday low 70.13 area. It then recovered from here and bounced quickly to high 73.86. Brent ended the day around 73.72, up for the day and indicates bullish sign in the hourly chart. However, the 20 and 50 SMA started turning flat but continued developing far below 200 SMA, indicates bears not exhausted yet. On upside, overcome 74.20 may encourage bulls to challenge 76.00, break above that level will open the gate to 78.70.
- Technical indicators also suggest bullish movement, hovering above the midline. RSI stabilizes at 60, while the Momentum indicator stabilizes in positive territory, suggests upward potentials. On downside, the immediately support is 71.70, break below this level will open the gate for more decline to 70.00 area.