

18/10/2022 Daily Reports
- The GBP/USD pierces the 1.1400 mark, as the UK’s new Finance Minister, Jeremy Hunt, said in the House f Commons that the government changed its course while reiterating that Britain is a country that “pays its debts.” So far, UK Government’s U-Turn keeps investors’ mood upbeat, with global equities trading in the green. the GBP/USD is trading at 1.1355, above its opening price but shy of the two-week high.
- An absent US calendar left investors adrift to UK’s economic turmoil news. The UK Chancellor of the Exchequer, Jeremy Hunt, slashed the tax cuts from the newest government budget to calm the markets. So far, the 30-year Gilts has fallen 45 bps, from 4.85% to 4.35%, as tweaks made by the newest Finance Minister bought PM Liz Truss government time.
- Jeremy Hunt’s program increased the corporate tax rate while reversing tax changes on dividend income, alcohol duty, and a VAT-free shopping scheme aimed to raise GBP 5 billion. Additionally, Hunt commented that he would form an “economic advisory council” to provide independent advice to the government.
- The GBP/USD offers neutral stance in daily chart but show signals of upside potentials. Cable now is stabilizing above 20 and 50 SMA, indicating bullish strength in short term. However, the 20 SMA continued developing below longer ones despite it started turning flat and upside still capped by the long-term bearish trend line, suggesting bears not exhausted yet. On upside, The immediate resistance is 1.1500 with a break above it exposing to 1.1600.
- Technical readings in the daily chart support neutral stances. RSI indicator stabilized around 52, while the Momentum indicator stabilized below the midline, suggesting downward potentials. On downside, the immediate support is 1.1220, unable to defend this level will resume the decline to 1.1100.


- Gold is rising on Monday, recovering from the two-week low it hit on Friday at $1,639. After the beginning of the American session it peaked at $1,668 and then pulled back to the $1,649 area, still bearish in the daily chart.
- The recovery in gold is being driver by lower yields and a weaker US dollar. The US Dollar Index (DXY) is falling by 0.90% and it tested the weekly low at 112.15. The US 10-year yield stands at 3.95% while the 2-year at 4.44%.
- The American dollar edged lower at the beginning of the week as news coming from the UK weighed on global government bonds and the greenback’s demand. Furthermore, US retail sales showed a certain resilience in consumers’ behaviour and Bank of America has reported better than expected quarterly reports, which has undermined demand for the safe-haven US dollar.
- Gold price stabilized around 1649, up for the day and bearish in the daily chart. The gold price stabilized below 20 and 50 SMA, suggesting bearish strength. Meanwhile, the 20 SMA continued developing far below longer ones despite it started turning flat, indicating bears not exhausted yet. On upside, the immediate resistance is 1684, break above this level will open the gate to extend the advance to 1700 area.
- From a technical perspective, the RSI indicator hold below the midline and stabilized around 41, suggesting bearish strength. The Momentum indicator struggled below the midline, suggests downward potentials. On downside, the immediate support is 1640, below this area may resume the decline to 1615.


- The dollar has remained hovering near the 149.00 on Monday, consolidating gains at a 32-year high, following an 8-day rally from the 144.00 area.
- Investors’ mood improved on Monday, with the market welcoming news that the UK finance minister is planning to reverse most of the aspects of his predecessor’s mini-Budget. Furthermore, US retail sales showed a certain resilience in consumers’ behaviour and Bank of America has reported better than expected quarterly reports, which has undermined demand for the safe-haven US dollar.
- On the other hand, the pair has appreciated well above the level that triggered intervention by the Bank of Japan last month. Japanese authorities have reiterated their warnings of a firm response to avoid rapid yen declines which has set investors on the guard.
- The USD/JPY pair stabilized around 148.95, up for the day and bullish in the daily chart. The price still maintains the upward slope and stabilized above all main SMAs, suggests bullish strength. Meanwhile, 20 SMA continued accelerating north and developing above longer ones, indicating bulls not exhausted in the long term. On upside, overcome 149.00 may encourage bulls to challenge 150.00, break above that level will open the gate to 151.00.
- Technical indicators suggest the bullish strength. RSI stabilized around 77, while the Momentum indicator continued developing above the midline, suggests upward potentials. On downside, the immediate support is 147.00, break below this level will open the gate to 146.00 area.

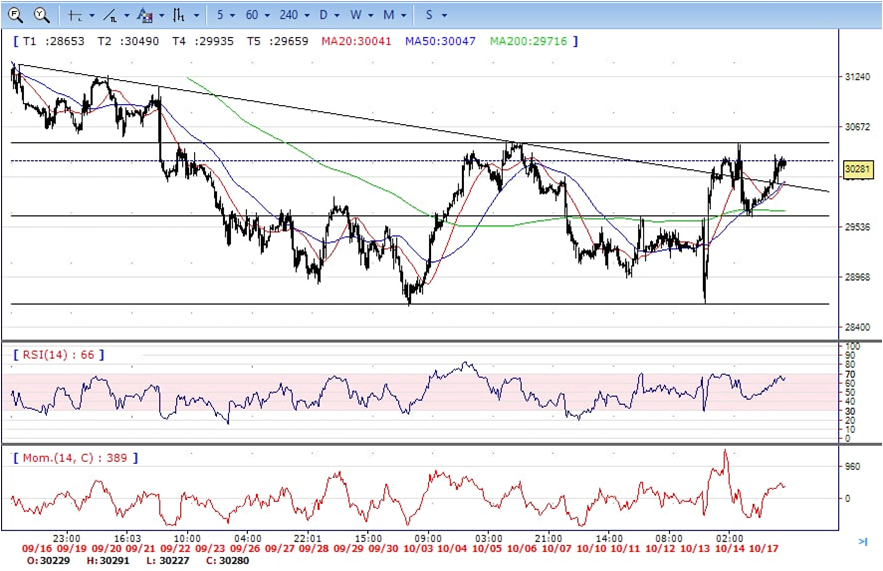
- DJI made a strong rally on Monday, jumped from intraday low 29700 area to intraday high 30310 region. It ended the day at around 30290, up for the day and bullish in the hourly chart. It stabilized above all main SMAs, suggests bullish strength. Meanwhile, 20 SMA continued accelerating north and developing above longer one, suggests bulls not exhausted yet. On upside, overcome 30500 may encourage bulls to challenge 30900, break above this level will open the gate to 31100.
- Technical indicators suggest the bullish strength. RSI stabilized around 67, while the Momentum indicator stabilized above the midline, suggests upward potentials. On downside, the immediate support is 30000, break below this level will open the gate for more decline to 29650 area.
- Brent under the sell pressure, tumbled from 93.20 area to intraday low 91.10. It settled near the bottom and ended Monday at around 91.70, unchanged for the day and still bearish in the hourly chart. The price stabilized below all main SMAs, suggests bearish strength in short term. Meanwhile, the 20 SMA started turning south and heading towards longer ones, indicating bears not exhausted yet. On upside, overcome 93.20 may encourage bulls to challenge 95.20, break above this level will open the gate to 96.50.
- Technical indicators suggest the bearish movement, hovering below the midline. RSI stabilized around 43, while the Momentum indicator stabilized in negative territory, suggests downward potentials. On downside, the immediate support is 91.00, break below this level will open the gate for more decline to 89.00 area.


