15/06/2023 Daily Reports
- The European currency now trades with marked gains and pushes EUR/USD to revisit daily highs in the 1.0950 band on Thursday. Indeed, spot sees its daily upside exacerbated after President Christine Lagarde advocated for an extra rate hike in July, at the time of writing, the price is trading at 1.0948, up more than 1% for the day.
- The central bank anticipates that inflation will remain excessively high for an extended period. To address this, future decisions will prioritize maintaining sufficiently restrictive interest rates. The rates will be sustained at these levels for as long as it takes to address the issue effectively. The central bank will continue to adopt a data-dependent approach to evaluate the situation.
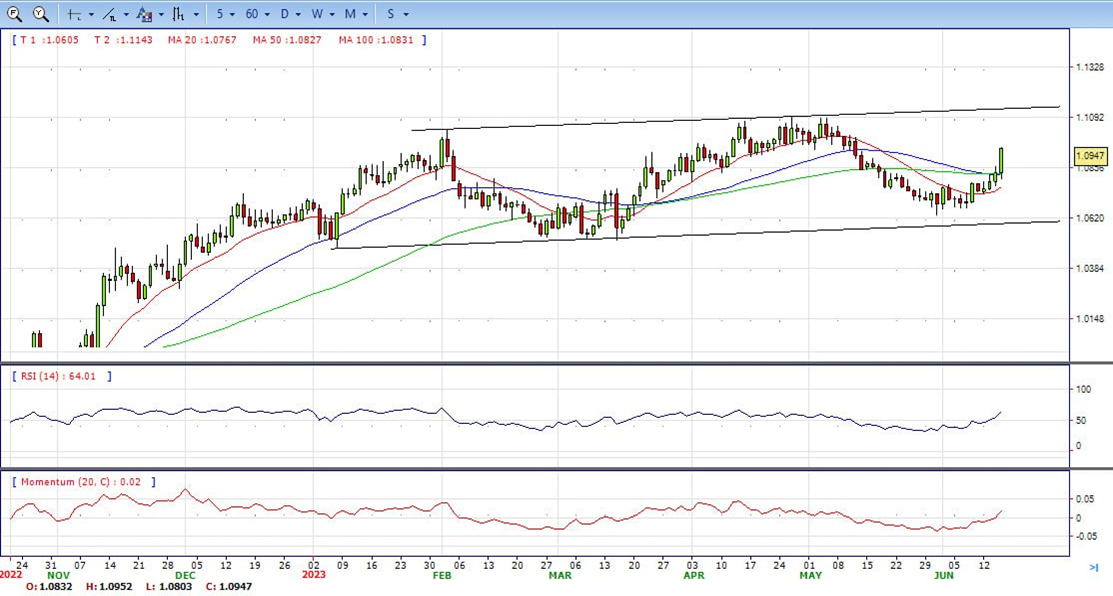
- The EUR/USD pair is trading near the 1.0950, up for the day with bullish stance in daily chart. The pair stabilized above all main SMAs, indicates bullish strength. Meanwhile, the 20 SMA started turning north and heading towards 50 and 200 SMA, suggests bulls not exhausted yet. On upside, the immediate resistance is 1.0950, break above this level will extend the advance to 1.1000.
- Technical readings in the daily chart support the bullish stance. The RSI indicator stabilizes around 64. The Momentum indicator holds above the midline, indicating upward potentials. On downside, the immediate support is 1.0860 and below this level will open the gate to 1.0800.
- GBP/USD rallies sharply in the North American session, propelled by an interest rate hike by the ECB and a hold of the US Fed. Expectations that the BoE could be the more hawkish central bank amongst G10 FX countries keep the GBP/USD underpinned toward the 1.2800 mark. At the time of writing, the GBP/USD is trading at 1.2778 after hitting a low of 1.2628.
- Wall Street is trading with gains following the Fed’s decision to keep rates unchanged. Even though Jerome Powell and Co. telegraphed two more 25 bps rate hikes, the markets are not buying their narrative, as US Treasury bond yields drift lower, with the 10-year note yielding 3.753%, down four basis points, while the greenback weakens across the board. In the meantime, the ECB lent a lifeline to the Pound Sterling after lifting rates by 25 bps and suggesting more increases are coming.
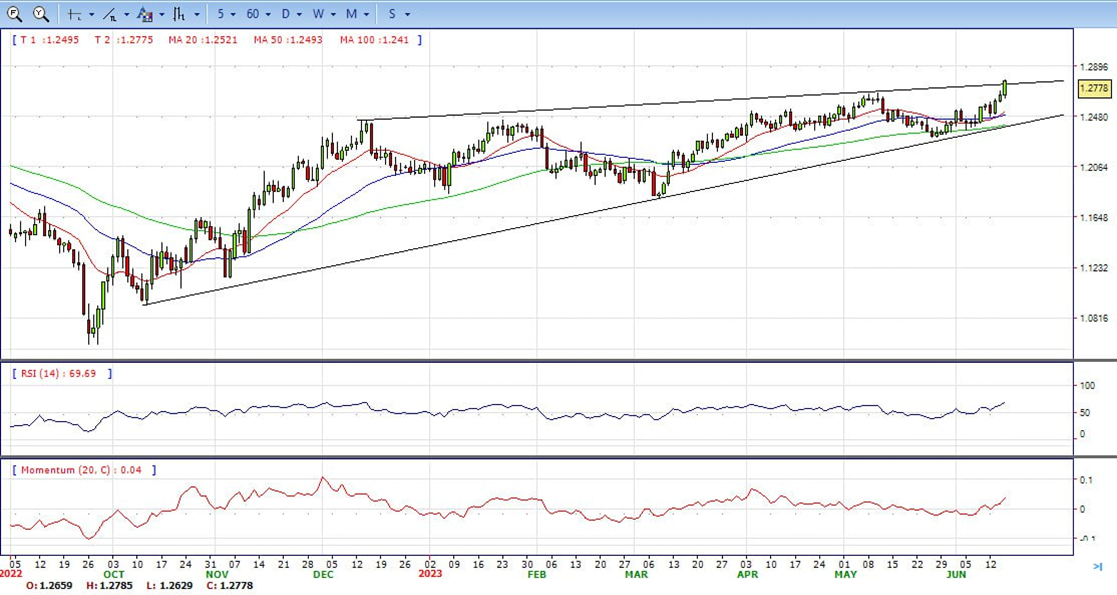
- The GBP/USD offers bullish stance in daily chart. Cable stabilizes above 20 and 50 SMA, indicating bullish strength in short term. Meanwhile, the 20 and 50 SMA started turning flat but continued developing above longer ones, suggests bulls not exhausted yet. On upside, the immediate resistance is 1.2840 with a break above it exposing to 1.3000.
- Technical readings in the daily chart support the bullish stances. RSI indicator stabilizes around 69, while the Momentum indicator stabilizes above the midline, suggesting upward potentials. On downside, the immediate support is 1.2670, unable to defend this level will resume the decline to 1.2600.


- Gold price bounced off three-month lows of $1925.06, spurred on by a soft US Dollar and falling US bond yields as the main factors underpinning Gold. At the time of writing, the XAU/USD is trading at $1958.50 a troy ounce, up 0.86%.
- Sentiment remains upbeat, even though the Fed’s announced additional hikes needed after holding rates unchanged. Even though the Fed’s decision weakened Gold prices, market participants remain sceptical about the Fed, as US Treasury bond yields retraced from Wednesday’s highs.
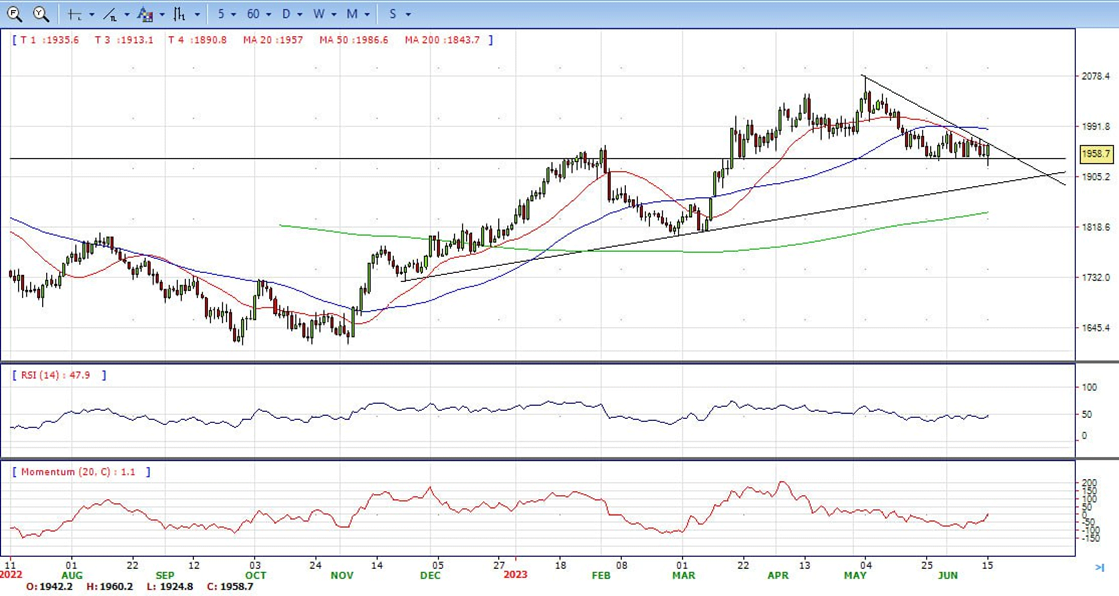
- Gold price stabilized around 1958, up for the day and bearish to neutral in the daily chart. The gold price stabilizes near 20 SMA, suggesting neutral strength in short term. Meanwhile, the 20 SMA started turning flat but continued developing below 50 SMA, indicates bears not exhausted yet. On upside, the immediate resistance is 1985, break above this level will open the gate for more advance to 2000 area.
- From a technical perspective, the RSI indicator holds near the midline and stabilizes around 50, on a neutral strength. The Momentum indicator also stabilized near the midline, suggests directionless potentials. On downside, the immediate support is 1925, below this area may resume the decline to 1900.


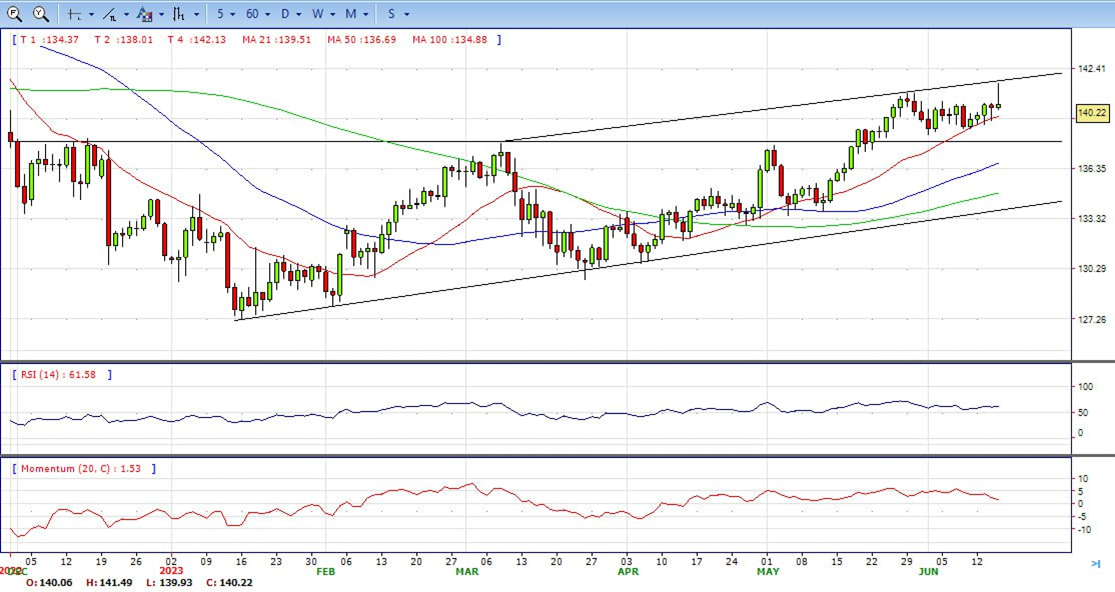
- The USD/JPY pair has resumed its north-side journey after a pullback move to near 140.20 in the New York session. The major is aiming to reclaim its fresh six-month high of 141.50 as no tweak is expected in the monetary policy to be announced by the BoJ on Friday.
- USD/JPY has reached the highest levels since November 2022 as the US Federal Reserve maintained a hawkish stance in Wednesday’s interest rate announcement with the dot plot hinting at two more quarter-point rate increases this year. However, a big wick is being left on the day’s candle currently as the US Dollar and US Treasury yields pared gains. At the same time, investors digested the European Central Bank’s interest rate hike and a flurry of economic data.
- The USD/JPY pair stabilized around 140.20, slightly up for the day and bullish in the daily chart. The price stabilizes above 20 and 50 SMA, suggests bullish strength in short term. Meanwhile, 20 SMA continued accelerating north and developing above longer ones, indicating bulls not exhausted. On upside, overcome 141.50 may encourage bulls to challenge 142.30, break above that level will open the gate to 144.00.
- Technical indicators suggest the bullish strength. RSI stabilizes around 62, while the Momentum indicator stabilizes above the midline, suggests upward potentials. On downside, the immediate support is 138.40, break below this level will open the gate to 137.30 area.
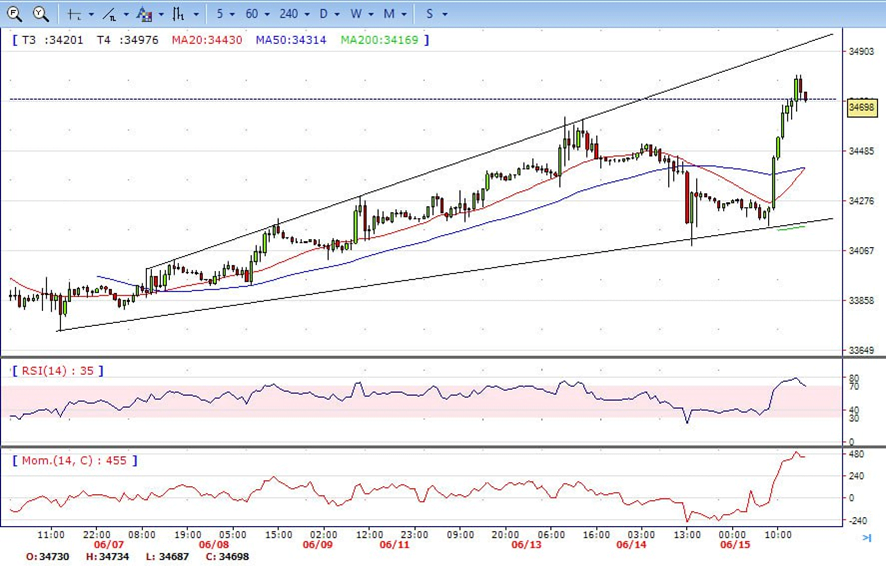
- DJI made a strong rally on Thursday post the better than expected retail sales dat. It jumped from intraday low 34170 level to high 34800 and ended the day around 34700, above 20 and 50 SMA, suggests bullish strength. Meanwhile, 20 SMA started turning north and heading towards longer ones, suggests bulls not exhausted yet. On upside, overcome 34800 may encourage bulls to challenge 35000, break above that level will open the gate to 35250.
- Technical indicators suggest the bullish movement. RSI stabilizes around 68, while the Momentum indicator stabilizes above the midline, suggests upward potentials. On downside, the immediately support is 34600, break below this level will open the gate for more decline to 34320 area.
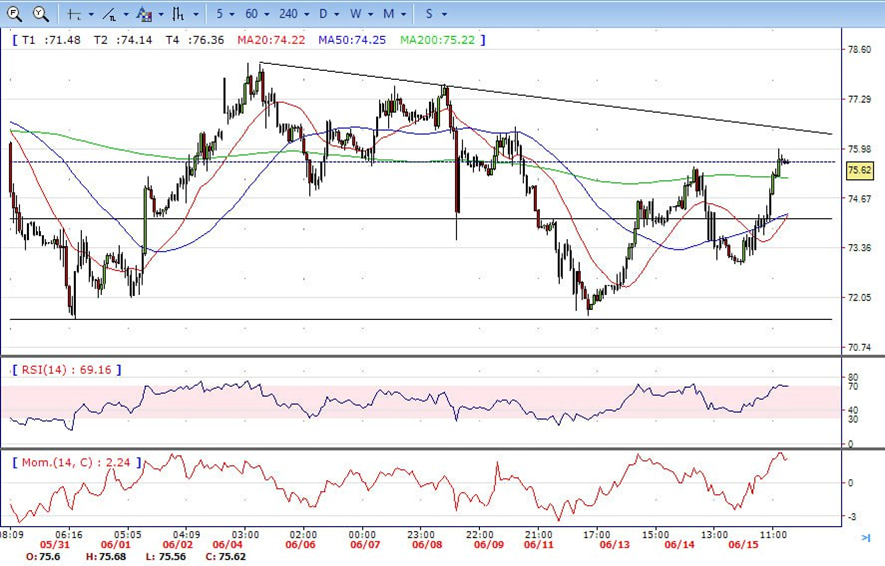
- Brent continued the advance on Thursday, climbed from intraday low 73.00 area to intraday high 76.00 level. It holds most the gains and ended the day around 75.60, up for the day and indicates bullish sign in the hourly chart. Meanwhile, the 20 SMA started turning north and heading towards 50 SMA, indicates bulls not exhausted yet. On upside, overcome 76.50 may encourage bulls to challenge 77.60, break above that level will open the gate to 78.50.
- Technical indicators also suggest bullish movement, hovering above the midline. RSI stabilizes at 69, while the Momentum indicator stabilizes above the midline, suggests upward potentials. On downside, the immediately support is 74.00, break below this level will open the gate for more decline to 73.00 area.