15/03/2023 Daily Reports
- EUR/USD currency pair trades consolidated in the familiar range after Tuesday’s US CPI data release. However, the losses remain limited as market participants assess the inflation data’s implications on the Fed’s monetary policy. As of writing, the EUR/USD is up 0.12% on the day, with the daily high and low at 1.0749 and 1.0679, respectively.
- EUR/USD trims its earlier decline after the US inflation figures tracked by the CPI showed headline consumer prices rose 6.0% in the year to February and 5.5% when it comes to the Core CPI, both prints matching initial consensus. The dollar, in the meantime, gives away part of the earlier gains and now struggles to regain upside traction some traction in response to rising speculation that the Fed might pause its hiking cycle as soon as at the March gathering, always following heightened concerns around the US banking sector.
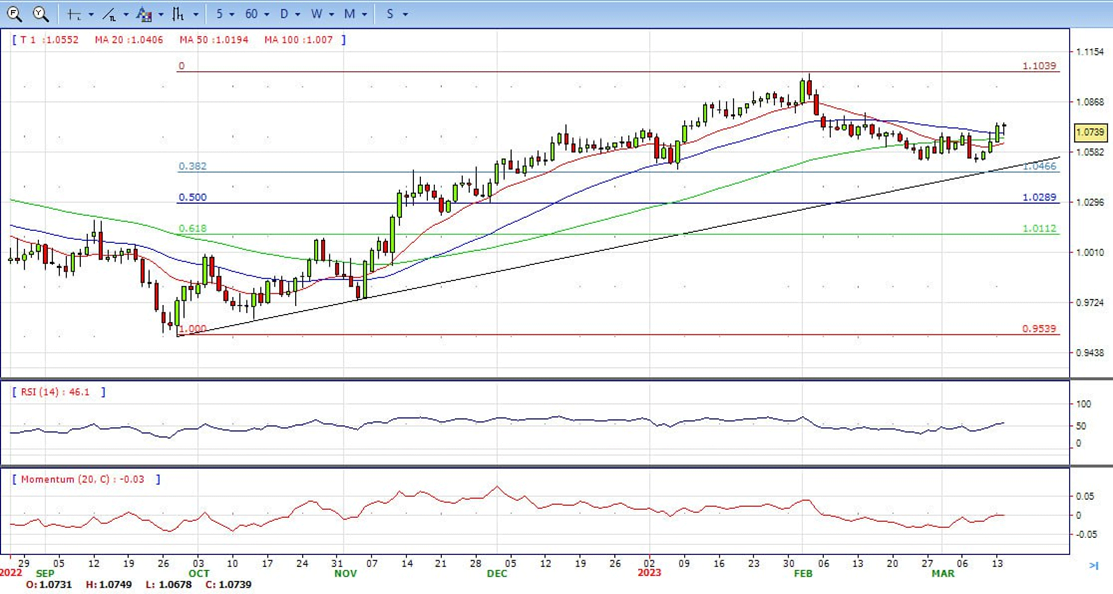
- The EUR/USD pair is trading near the 1.0740, slightly up for the day with bullish stance in daily chart. The pair stabilized above 20 and 50 SMA, indicates bullish strength. Meanwhile, the 20 SMA started turning flat but continued developing below 50 SMA, suggests bears not exhausted yet. On upside, the immediate resistance is 1.0800, break above this level will extend the advance to 1.0900.
- Technical readings in the daily chart support the neutral to bullish stance. The RSI indicator stabilizes around 57. The Momentum indicator holds just around the midline, indicating directionless potentials. On downside, the immediate support is 1.0650 and below this level will open the gate to 1.0530.
- GBP/USD sideways trades on Tuesday after the US inflation data was announced as per market expectations. Cable hovers around 1.2170 at the time of press. The intraday high of 1.2205 was briefly touched just after the US CPİ data release, but the currency pair quickly pulled back to the lower end of its trading range.
- On Tuesday, the US Bureau of Labor Statistics released a report indicating that inflation in the US, as measured by the CPI, declines from 6.4% in January to 6% in February on a yearly basis. The actual reading aligns with the market’s expectation of 6%. Meanwhile, the Core CPI, which excludes the prices of volatile food and energy, rose 0.5% in February, as expected on a monthly basis, bringing the annual rate down to 5.5% from 5.6%.
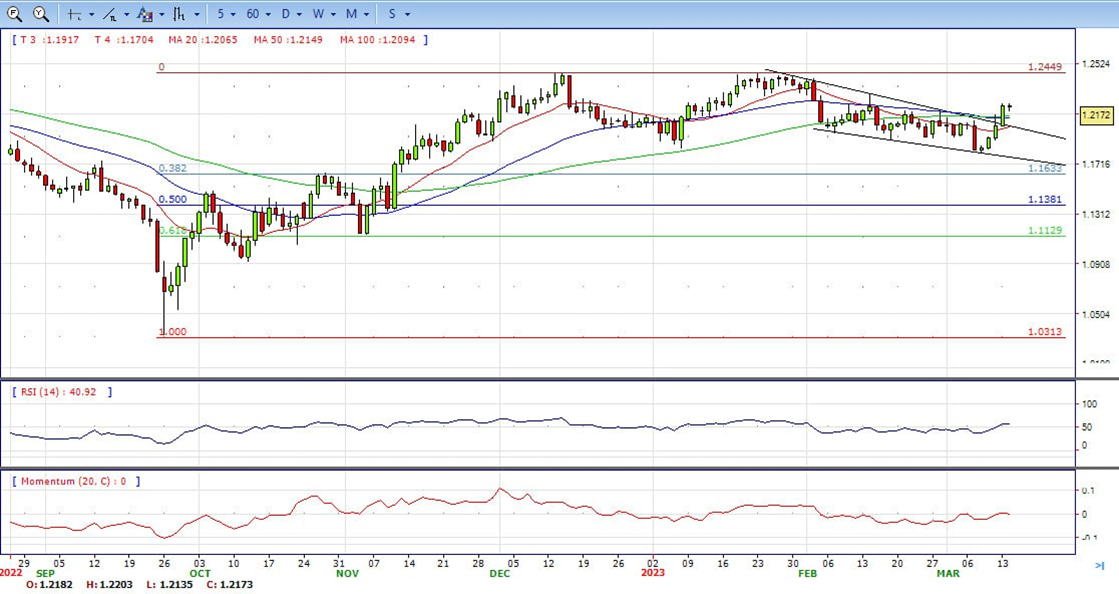
- The GBP/USD offers bullish stance in daily chart. Cable stabilizes above 20 and 50 SMA, indicating bullish strength in short term. Meanwhile, the 20 SMA started turning north and heading towards longer ones, suggests bulls not exhausted yet. On upside, the immediate resistance is 1.2200 with a break above it exposing to 1.2270.
- Technical readings in the daily chart support the neutral to bullish stances. RSI indicator stabilizes around 57, while the Momentum indicator stabilizes near the midline, suggesting directionless potentials. On downside, the immediate support is 1.2040, unable to defend this level will resume the decline to 1.1920.


- Gold prices moved to the upside following the release of US inflation data. XAU/USD climbed from near $1,900, reached levels above $1,910 and lost strength. The yellow metal is looking at the monthly high it reached earlier on Tuesday at $1,915.
- The US CPI rose in February 0.4%, and the annual rate slowed down from 6.4% in January to 6.0%; both matched market consensus. The Core CPI rose 0.5% from the previous month, slightly above the 0.4% expected; and the annual Core rate rose 5.5% from the previous year, below the 5.6% of the previous month. US Inflation numbers offered no surprise to market participants. US yield rose modestly, suggesting that the upside in Gold is being driven by a weaker US Dollar across the board and an improvement in sentiment. If the upside moves in US yields continue, XAU/USD could find difficulties extending gains.
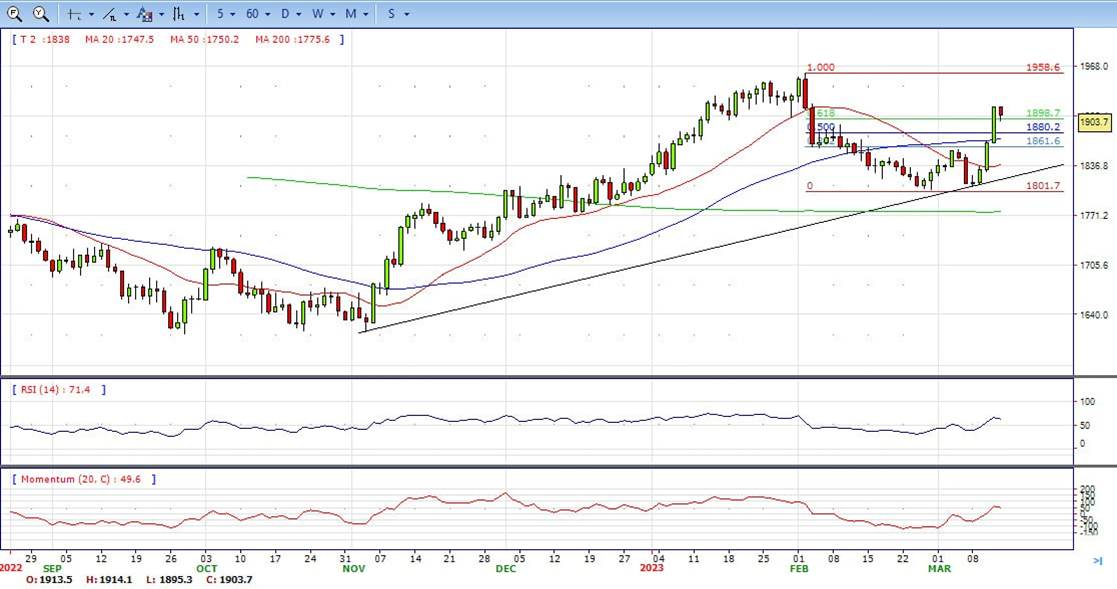
- Gold price stabilized around 1904, down for the day and bullish in the daily chart. The gold price still stabilizes above all main SMAs, suggesting bullish strength in short term. Meanwhile, the 20 and 50 SMA started turning north and continued developing far above 200 SMA, indicates bulls not exhausted yet. On upside, the immediate resistance is 1915, break above this level will open the gate for more advance to 1958 area.
- From a technical perspective, the RSI indicator holds above the mid-line and stabilizes around 62, on a bullish strength. The Momentum indicator hold in the positive territory, suggests upward potentials. On downside, the immediate support is 1895, below this area may resume the decline to 1870.


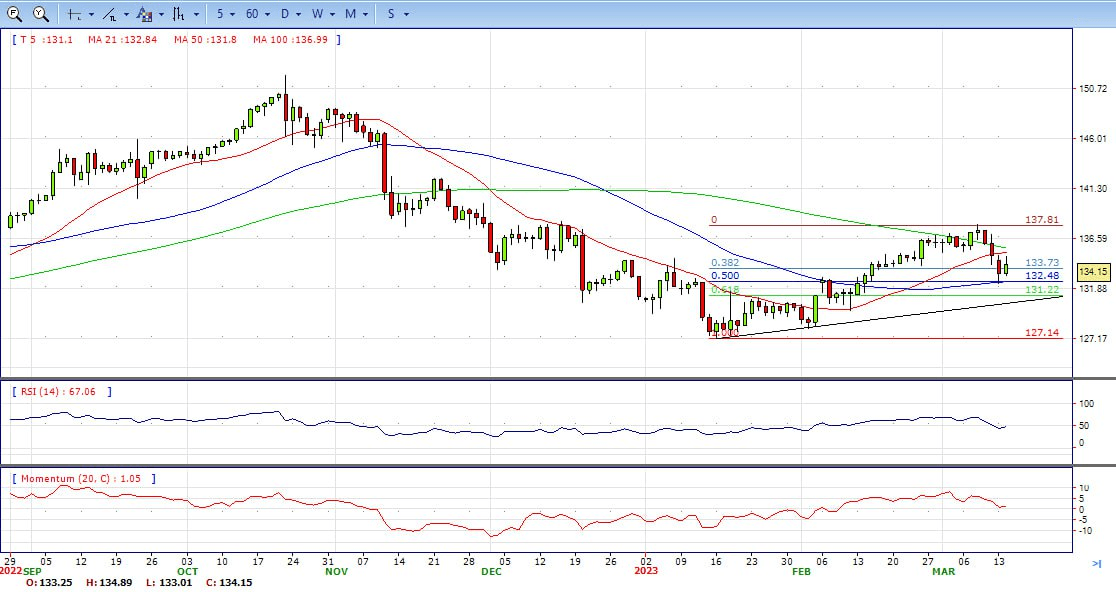
- The USD/JPY broke a range after the beginning of the American session and following the release of US CPI numbers. The pair is trading above 134.20, with strong gains as the US dollar strengthens.
- US February Consumer Price Index rose 0.4% in February, as expected, while the annual rate slowed down from 6.4% to 6%. The core CPI rose 0.5%, slightly above the 0.4% of market consensus. The US Dollar stayed relatively quiet immediately after the report. However, the Greenback gained momentum later as US yields moved further to the upside. US Treasury bonds are erasing most of Monday’s gains. The rebound in yields is fuelling the USD/JPY.
- The USD/JPY pair stabilized around 134.20, up for the day and neutral in the daily chart. The price stabilizes below 20 SMA, suggests bearish strength in short term. Meanwhile, 20 SMA continued accelerating north and developing far above 50 SMA, indicating bulls not exhausted. On upside, overcome 135.20 may encourage bulls to challenge 137.00, break above that level will open the gate to 138.00.
- Technical indicators suggest the neutral to bearish strength. RSI stabilizes around 48, while the Momentum indicator stabilizes just above the midline, suggests upward potentials. On downside, the immediate support is 132.25, break below this level will open the gate to 131.50 area.
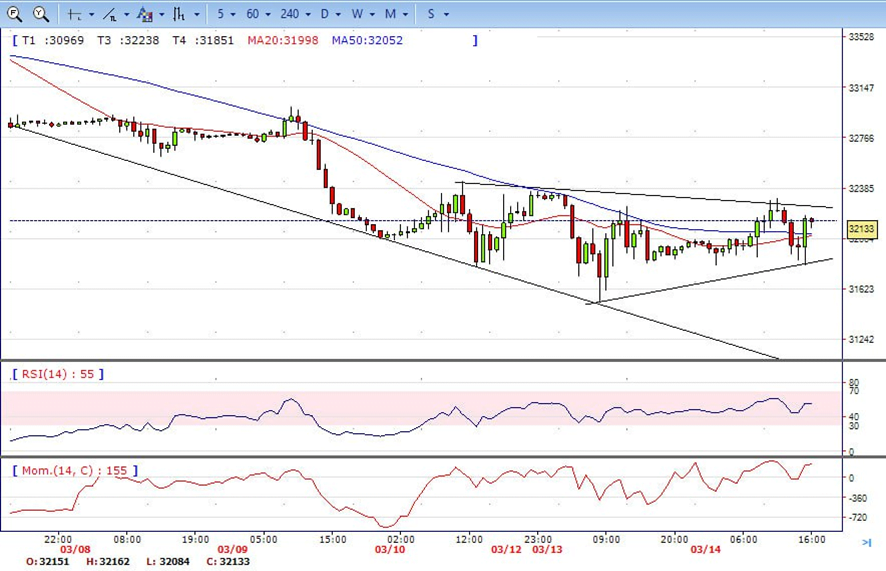
- DJI recovered some losses on Tuesday, climbed from intraday low 31800 area to high 32310. It trimmed some gains and ended the day around 32130, up for the day and indicates bullish sign in the hourly chart. Right now market is standing above 20 and 50 SMA, suggests bullish strength. Meanwhile, 20 SMA started turning north and heading towards longer ones, suggests bulls not exhausted yet. On upside, overcome 32300 may encourage bulls to challenge 32430, break above that level will open the gate to 32750.
- Technical indicators suggest the bullish movement. RSI stabilizes around 55, while the Momentum indicator stabilizes in positive territory, suggests upward potentials. On downside, the immediately support is 31800, break below this level will open the gate for more decline to 31530 area.
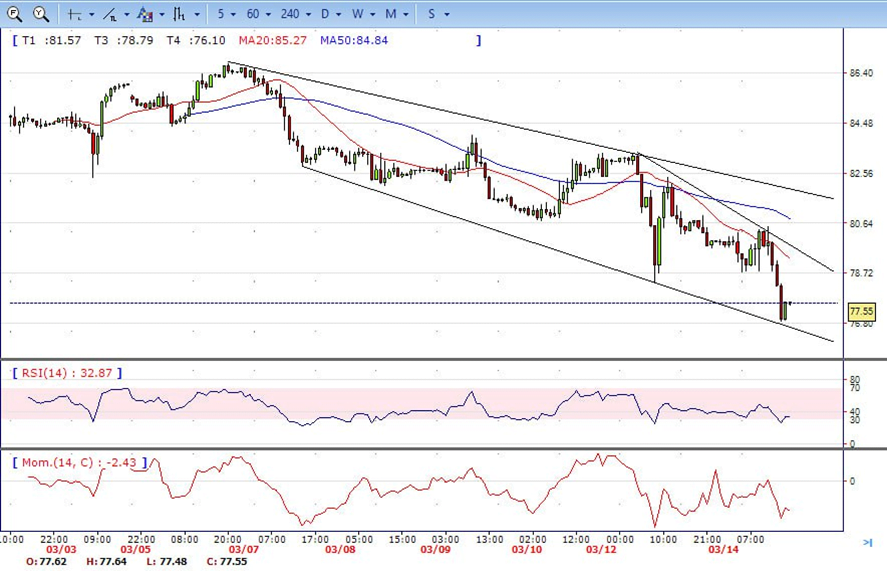
- Brent dropped to monthly low 76.88 area, then bounced from here modestly but still under the sell pressure and ended the day around 77.55. The price currently stabilizes below 20 and 50 SMA, suggests bearish strength in the hourly chart. Meanwhile, the 20 SMA continued accelerating south and developing far below longer ones, indicates bears not exhausted yet. On upside, overcome 78.80 may encourage bulls to challenge 80.50, break above that level will open the gate to 82.30.
- Technical indicators also suggest bearish movement, hovering below the midline. RSI drops to 32, while the Momentum indicator stabilizes in negative territory, suggests downward potentials. On downside, the immediately support is 76.80, break below this level will open the gate for more decline to 75.00 area.