14/03/2023 Daily Reports
- EUR/USD is up by over 0.9% in midday trade on Wall Street aided by a weaker US Dollar and ahead of the European Central Bank’s policy meeting on Thursday. Expectations call for the ECB to deliver a 50-basis point hike and hawkish rhetoric is assumed which is buoying the Single Currency which has travelled from a low of 1.0650 to a high of 1.0748 so far.
- The US Dollar continued to bleed heavily on Monday as markets bet the Federal Reserve will be less aggressive in raising interest rates to curb inflation. US authorities have made moves to try to lessen the damage from the recent collapse of Silicon Valley Bank. A new Bank Term Funding Program will offer loans from the Federal Reserve of up to one year to depository institutions, backed by United States Treasuries and other assets these institutions hold.
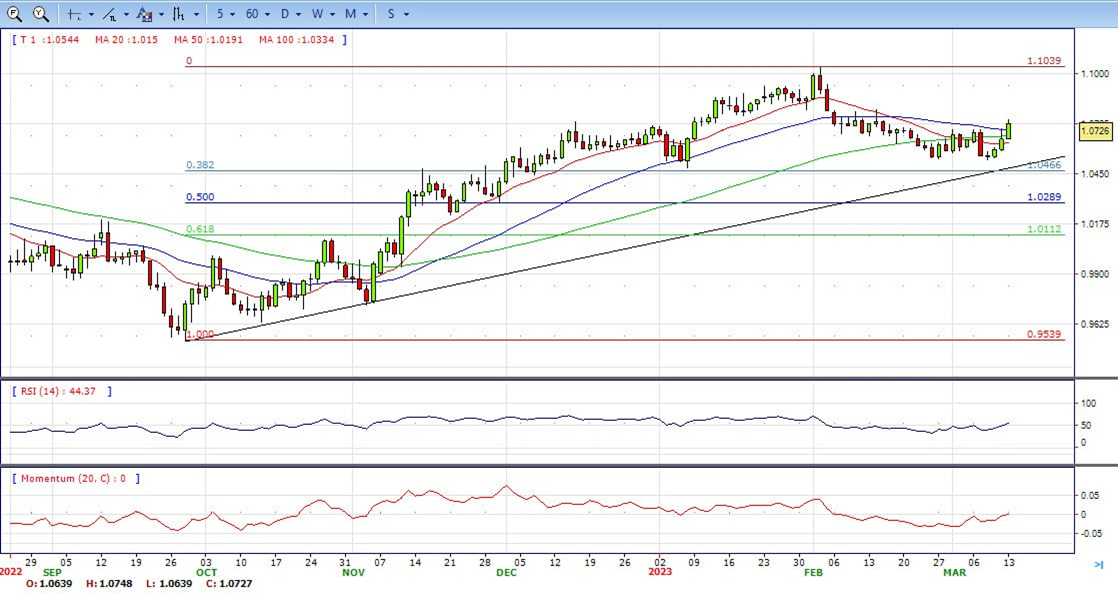
- The EUR/USD pair is trading near the 1.0730, up for the day with bullish stance in daily chart. The pair stabilized above 20 and 50 SMA, indicates bullish strength. Meanwhile, the 20 SMA started turning flat but continued developing below 50 SMA, suggests bears not exhausted yet. On upside, the immediate resistance is 1.0800, break above this level will extend the advance to 1.0900.
- Technical readings in the daily chart support the neutral to bullish stance. The RSI indicator stabilizes around 56. The Momentum indicator holds just around the midline, indicating directionless potentials. On downside, the immediate support is 1.0650 and below this level will open the gate to 1.0530.
- The GBP/USD broke above 1.2150, reaching the highest level since mid-February, boosted by a sharp decline of the US Dollar Index (DXY). A sharp drop in US yields occurs as investors shift their bets for a softer Federal Reserve, amid market concerns about the banking industry.
- The collapse of Silicon Valley Bank and its effect are driving markets. Major US indices are mixed on Monday, with the banking sector falling sharply. The Dow Jones is at four-month lows levels. The ongoing situation has diminished the odds of a 50 basis points rate hike from the Federal Reserve next week and sent US yields sharply to the downside. On Tuesday, the US will release February’s Consumer Price Index, a key input, now being offset by recent developments.
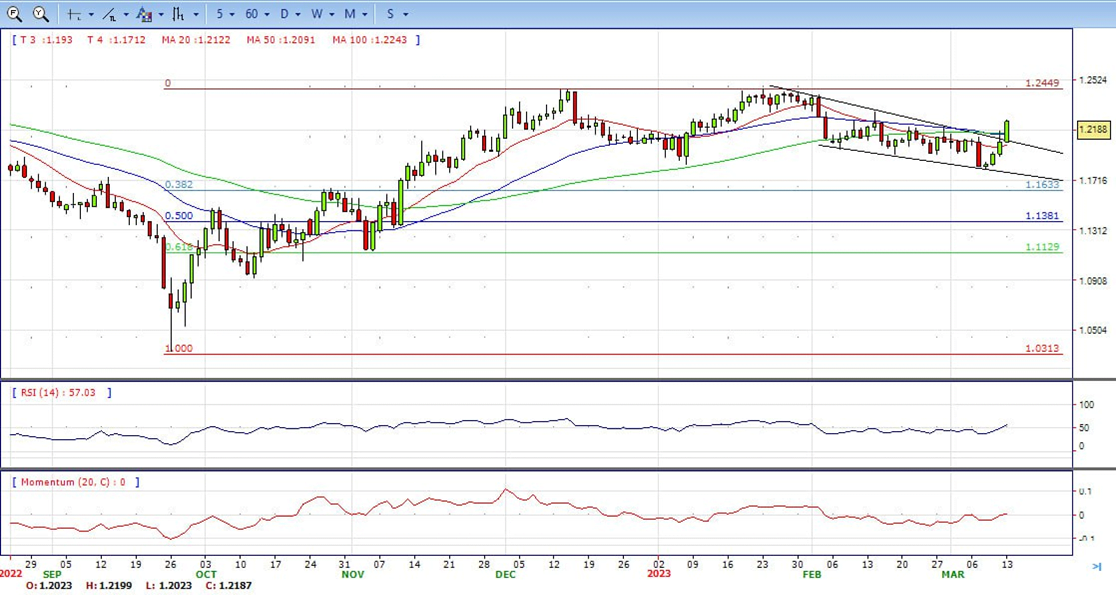
- The GBP/USD offers bullish stance in daily chart. Cable stabilizes above 20 and 50 SMA, indicating bullish strength in short term. Meanwhile, the 20 SMA started turning north and heading towards longer ones, suggests bulls not exhausted yet. On upside, the immediate resistance is 1.2200 with a break above it exposing to 1.2270.
- Technical readings in the daily chart support the neutral to bullish stances. RSI indicator stabilizes around 57, while the Momentum indicator stabilizes near the midline, suggesting directionless potentials. On downside, the immediate support is 1.2040, unable to defend this level will resume the decline to 1.1920.


- XAU/USD commodity opens the first day of the week at $1,885, with an intraday high of $1,913.13 and a low of $1,867.24. Gold trades at $1,914.60 at the press time for the first time since February 3rd, 2023, up by 2.45% on Monday.
- The sharp drop in US yields is considered the primary catalyst for the rise in the price of Gold. The US 10-year yield has fallen to 3.41%, approaching its year-to-date lows from its previous level above 4.0%. Meanwhile, the 2-year yield reached its highest since 2008 and fell to its lowest intraday level since October 2022, at 4.00%. Following the collapse of Silicon Valley Bank (SVB), concerns have arisen about the state of the banking sector, which has caused a decrease in expectations for a rate hike by the Federal Reserve (Fed). Investors are watching the potential impact of this crisis on economic data.
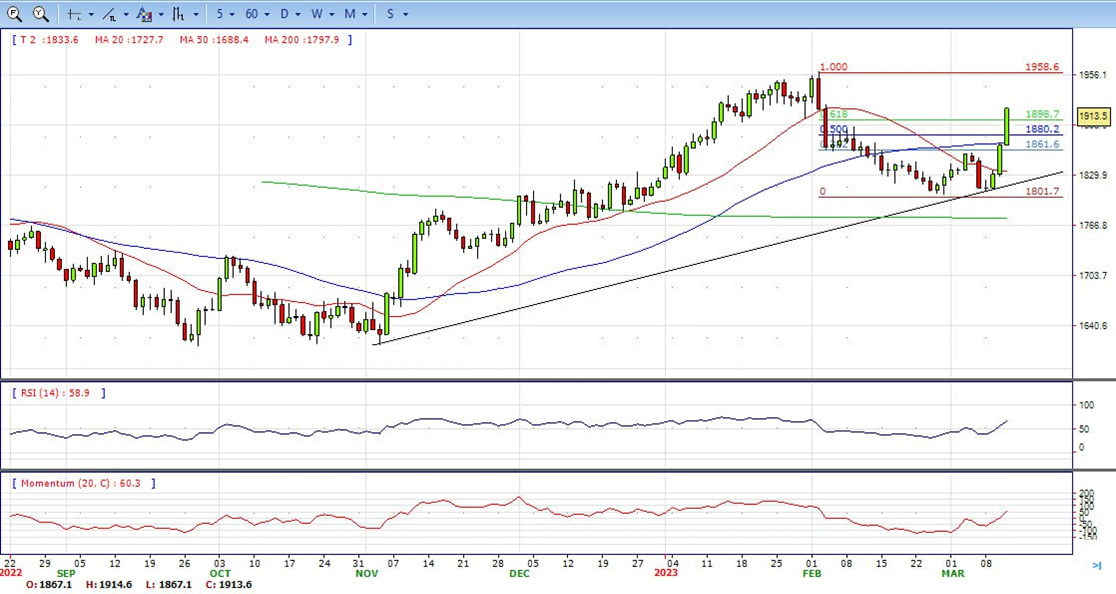
- Gold price stabilized around 1914, up for the day and neutral to bullish in the daily chart. The gold price stabilizes above all main SMAs, suggesting bullish strength in short term. Meanwhile, the 20 and 50 SMA started turning flat but continued developing far above 200 SMA, indicates bulls not exhausted yet. On upside, the immediate resistance is 1918, break above this level will open the gate for more advance to 1958 area.
- From a technical perspective, the RSI indicator holds above the mid-line and stabilizes around 67, on a bullish strength. The Momentum indicator hold in the positive territory, suggests upward potentials. On downside, the immediate support is 1893, below this area may resume the decline to 1870.


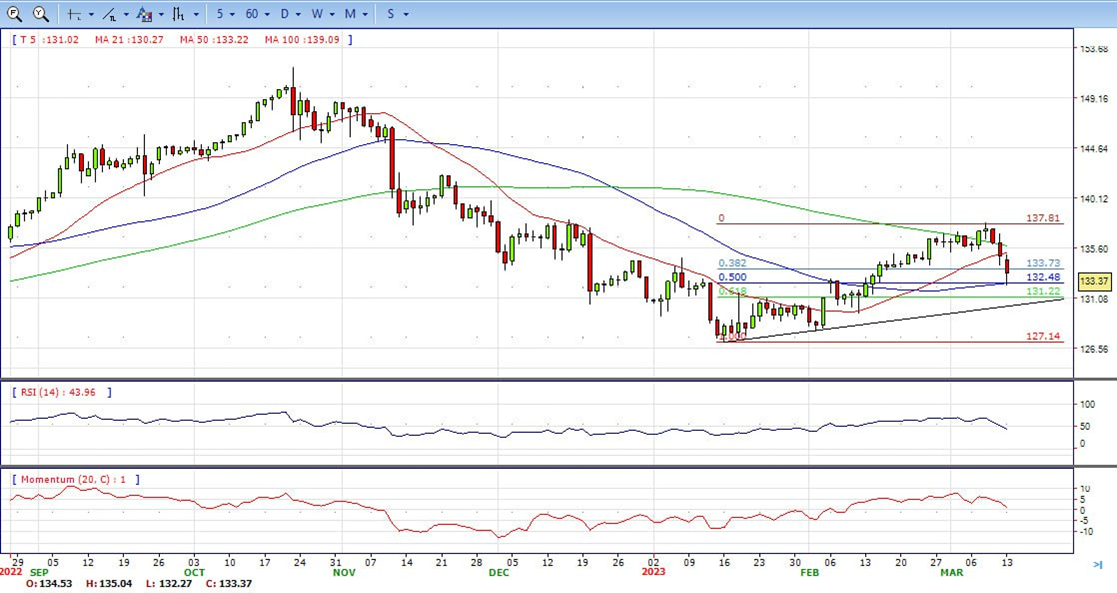
- USD/JPY opens the day of a new week at 134.97, dropping to an intraday low of 132.96 before hitting an intraday high of 134.99. The pair continues to struggle to gain amid bearish market sentiment, trading at 133.40, down by 1.10% on the day at the press time.
- There is no critical economic event on the day that may affect the price of USD/JPY on Monday, the week’s first and relatively silent day. However, the collapse of Silicon Valley Bank (SVB) and its potential impact on the broader US banking system continues to be the market’s primary focus. Commerzbank economists predict that the US Dollar will face negative consequences due to this development. Fed’s strategy of implementing extremely rapid interest rate hikes appears unsuccessful.
- The USD/JPY pair stabilized around 133.40, down for the day and neutral to bearish in the daily chart. The price stabilizes below 20 SMA, suggests bearish strength in short term. Meanwhile, 20 SMA continued accelerating north and developing far above 50 SMA, indicating bulls not exhausted. On upside, overcome 135.20 may encourage bulls to challenge 137.00, break above that level will open the gate to 138.00.
- Technical indicators suggest the neutral to bearish strength. RSI stabilizes around 44, while the Momentum indicator stabilizes just above the midline, suggests directionless potentials. On downside, the immediate support is 132.25, break below this level will open the gate to 131.50 area.
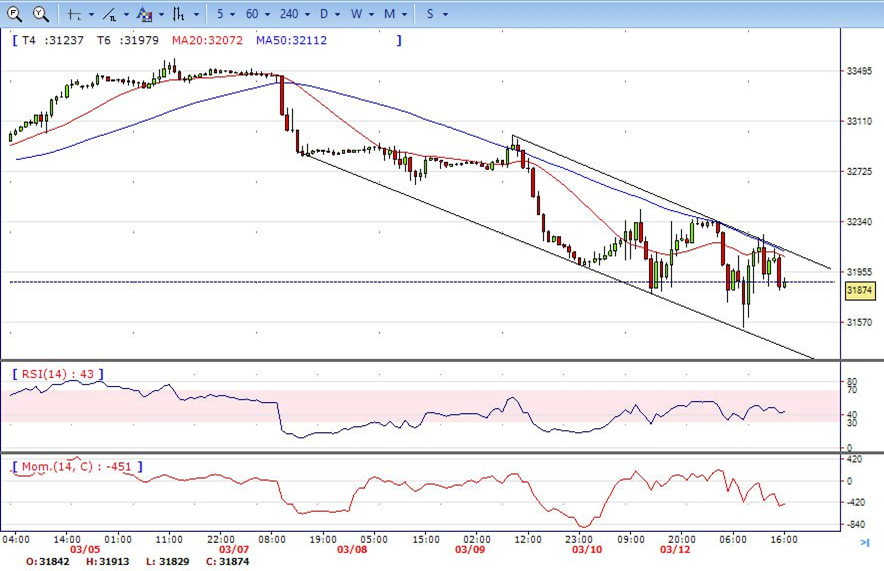
- DJI still under the sell pressure after the news of SVB collapse, plunged from intraday high 32370 area to low 31528. It recovered some losses and ended the day around 31870, down for the day and indicates bearish sign in the hourly chart. Right now market is standing below 20 and 50 SMA, suggests bearish strength. Meanwhile, 20 SMA continued accelerating south and developing far below longer ones, suggests bears not exhausted yet. On upside, overcome 32230 may encourage bulls to challenge 32430, break above that level will open the gate to 32750.
- Technical indicators suggest the bearish movement. RSI stabilizes around 44, while the Momentum indicator stabilizes in negative territory, suggests bearish potentials. On downside, the immediately support is 31530, break below this level will open the gate for more decline to 31250 area.

- Brent dropped to monthly low 78.35 area, then bounced from here and climbed to 82.40 area. It still under the sell pressure and ended the day around 80.50. The price currently stabilizes below 20 and 50 SMA, suggests bearish strength in the hourly chart. Meanwhile, the 20 SMA continued accelerating south and developing far below longer ones, indicates bears not exhausted yet. On upside, overcome 83.10 may encourage bulls to challenge 84.00, break above that level will open the gate to 85.00.
- Technical indicators also suggest bearish movement, hovering below the midline. RSI drops to 40, while the Momentum indicator stabilizes in negative territory, suggests downward potentials. On downside, the immediately support is 78.30, break below this level will open the gate for more decline to 77.50 area.