13/02/2023 Daily Reports
- The European currency trades in a vacillating fashion and motivates EUR/USD to hover around the 1.0670 band at the end of the week.
- The pair remains side-lined in the lower end of the weekly range and appears to have finally digested the steep decline in the wake of the FOMC and ECB gatherings during the previous week. In the domestic docket, Industrial Production in Italy expanded at a monthly 1.6% in December and 0.1% from a year earlier. Later in the session, Germany will publish the Current Account figures.
- Price action around the European currency should continue to closely follow dollar dynamics, as well as the potential next moves from the ECB after the central bank delivered a 50 bps at its meeting last week. Back to the euro area, recession concerns now appear to have dwindled, which at the same time remain an important driver sustaining the ongoing recovery in the single currency as well as the hawkish narrative from the ECB.
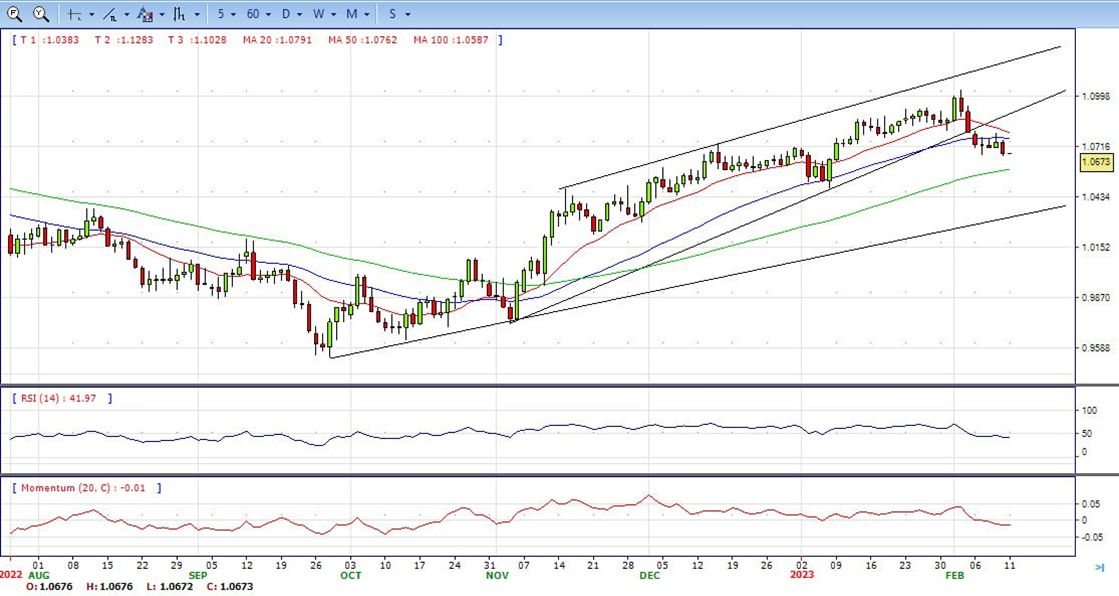
- The EUR/USD pair is trading near the 1.0670, down for the day with bearish stance in daily chart. The pair stabilized below 20 and 50 SMA, indicates bearish strength. Meanwhile, the 20 SMA started turning south and heading towards longer ones, suggests bears not exhausted yet. On upside, the immediate resistance is 1.0800, break above this level will extend the advance to 1.0930.
- Technical readings in the daily chart support the bearish stance. The RSI indicator stabilizes around 42. The Momentum indicator holds below the midline, indicating downward potentials. On downside, the immediate support is 1.0660 and below this level will open the gate to 1.0580.
GBP/USD snaps three straight days of gains and drops as it tested 1.2130 area, as UK economic data showed the economy did not grow, while consumer sentiment in the US improved. At the time of writing, the GBP/USD exchanges hands at 1.2050.
The GBP/USD extended a leg down after data from the University of Michigan reported that Consumer Sentiment surpassed predictions of 65 and increased to 66.4, indicating a better financial situation. In addition, the expected inflation rate for the year rose from 3.9% in January’s final reading to 4.2%, while the inflation estimations for a five-year period remained steady at 2.9%.
In the meantime, a gloomy scenario in the UK suggests that the British Pound would be under pressure as the BoE struggles to tame inflation which reached a 41-year high at 11.1% in October of 2022. The BoE’s latest monetary policy meeting revealed a split vote amongst its members. The BoE forward discussions and guidance would be interesting, which could reassure the central bank’s commitment to tackle inflation.
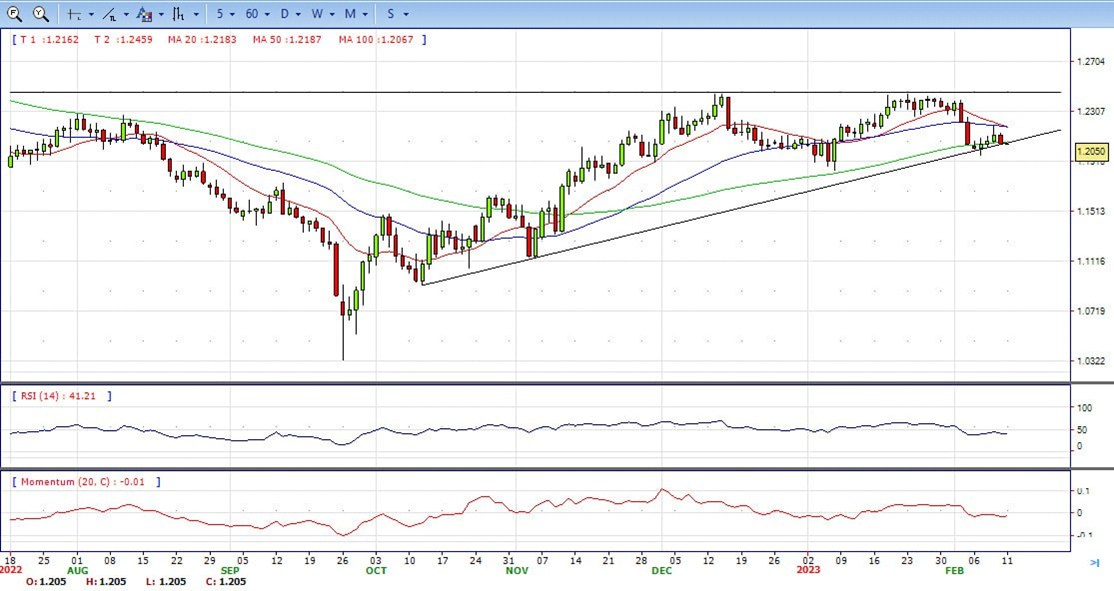
The GBP/USD offers bearish stance in daily chart. Cable stabilizes below 20 and 50 SMA, indicating bearish strength in short term. Meanwhile, the 20 SMA started turning south and heading towards longer ones, suggests bears not exhausted yet. On upside, The immediate resistance is 1.2200 with a break above it exposing to 1.2270.
Technical readings in the daily chart support the bearish stances. RSI indicator stabilizes around 40, while the Momentum indicator stabilizes below the midline, suggesting downward potentials. On downside, the immediate support is 1.1960, unable to defend this level will resume the decline to 1.1840.


- Gold price remains firm at around $1860 after hitting a week-to-date new low of $1852.45 on Friday due to speculations that the US Federal Reserve would raise rates by 25 bps in the next couple of meetings, as money market futures showed. At the time of writing, XAU/USD is trading at $1865, above its opening price by 0.24%
- Wall Street continues to trade mixed, with the Nasdaq 100 being the outlier, losing more than 0.50%. A poll by the University of Michigan reported that American Consumer Sentiment exceeded estimates of 65 and rose by 66.4, showing an improvement in financial conditions. Meanwhile, inflation expectations for a one-year horizon increased by 4.2% from 3.9% reported on January’s final reading, while for a 5-year horizon, it stood unchanged at 2.9%. XAU/USD’s reacted on the data, reaching as high as $1866.80, though retraced towards current prices.
- In the meantime, US Treasury bond yields continued to underpin the US Dollar. The 10-year benchmark note rate is up six bps, at around weekly highs of 3.728%, a headwind for XAU’s prices. The US Dollar Index (DXY), which tracks the buck’s value vs. a basket of peers, advances 0.37% daily, up at 103.57.
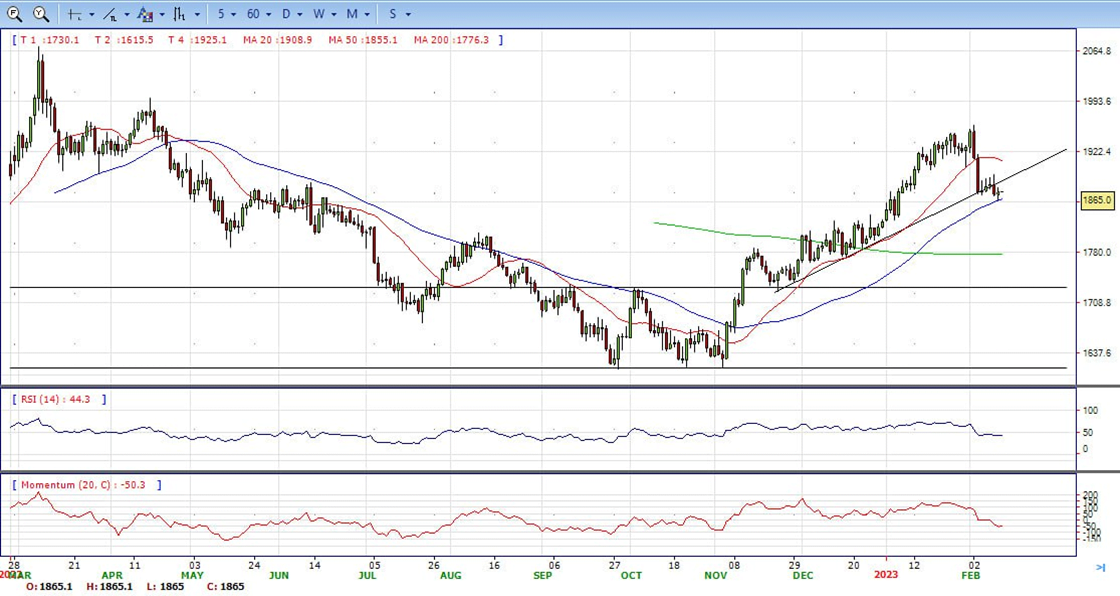
- Gold price stabilized around 1865, slightly up for the day and neutral to bearish in the daily chart. The gold price stabilized below 20 SMA, suggesting bearish strength in short term. Meanwhile, the 20 and 50 SMA started turning south and heading towards longer ones, indicating bears not exhausted yet. On upside, the immediate resistance is 1891, break above this level will open the gate for more advance to 1920 area.
- From a technical perspective, the RSI indicator holds below the mid-line and stabilizes around 44, on a bearish strength. The Momentum indicator hold below the midline, suggests downward potentials. On downside, the immediate support is 1852, below this area may resume the decline to 1830.


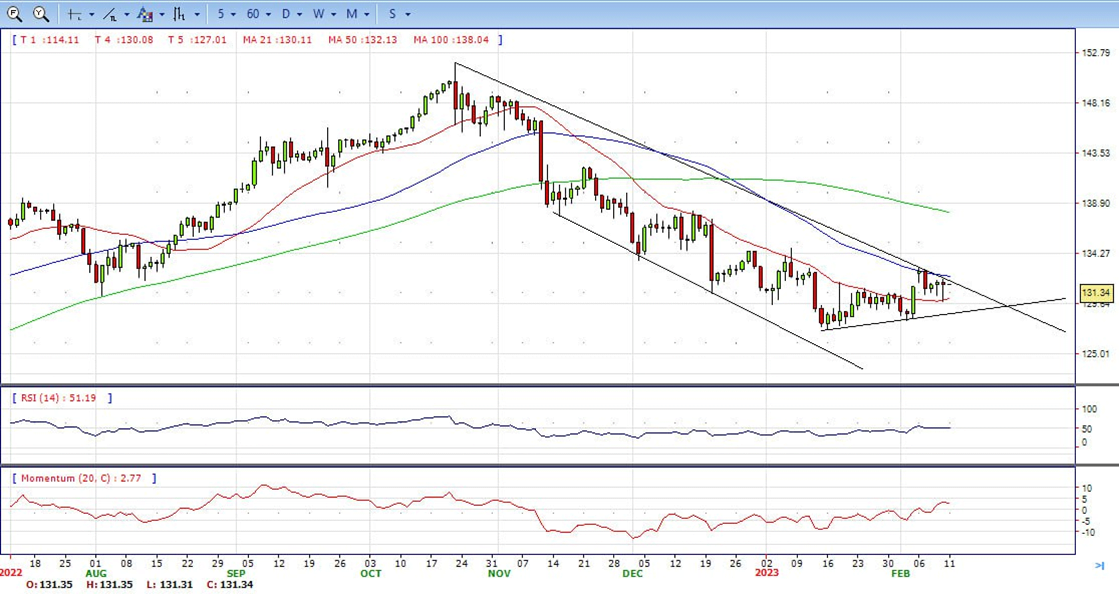
- The USD/JPY pair rebounds nearly 140 pips from the weekly low touched during the first half of the European session on Friday and now trades above the 131.00 mark.
- Reports that the Japanese government is likely to appoint Kazuo Ueda as the next BoJ governor boost the domestic currency and prompt aggressive intraday selling around the USD/JPY pair. The initial market reaction, however, fades rather quickly after the possible BoJ governor candidate Ueda said that the current policy is appropriate and added they need to continue the easy policy. This, in turn, undermines the JPY, which, along with the emergence of fresh US Dollar buying, assists the pair to rebound swiftly from the 129.80 region.
- The USD continues to draw support from diminishing odds for an imminent pause in the Fed’s policy tightening cycle. The expectations were lifted by the recent hawkish remarks by several FOMC officials, including Fed Chair Jerome Powell, stressing the need for additional interest rate hikes this week to fully gain control of inflation. This, in turn, pushes the US Treasury bond yields higher, which, in turn, benefits the Greenback. That said, looming recession risks lend some support to the safe-haven JPY and keep a lid on further gains for the USD/JPY pair.
- The USD/JPY pair stabilized around 131.35, down for the day and neutral in the daily chart. The stabilizes between 20 and 50 SMA for several days and shows no sign of a breakout, suggests neutral strength in short term. However, 20 SMA started turning flat but continued developing far below longer ones, indicating bears not exhausted. On upside, overcome 131.90 may encourage bulls to challenge 133.00, break above that level will open the gate to 134.70.
- Technical indicators still suggest the neutral strength. RSI stabilizes around 50, while the Momentum indicator stabilizes just above the midline, suggests upward potentials. On downside, the immediate support is 129.80, break below this level will open the gate to 129.00 area.
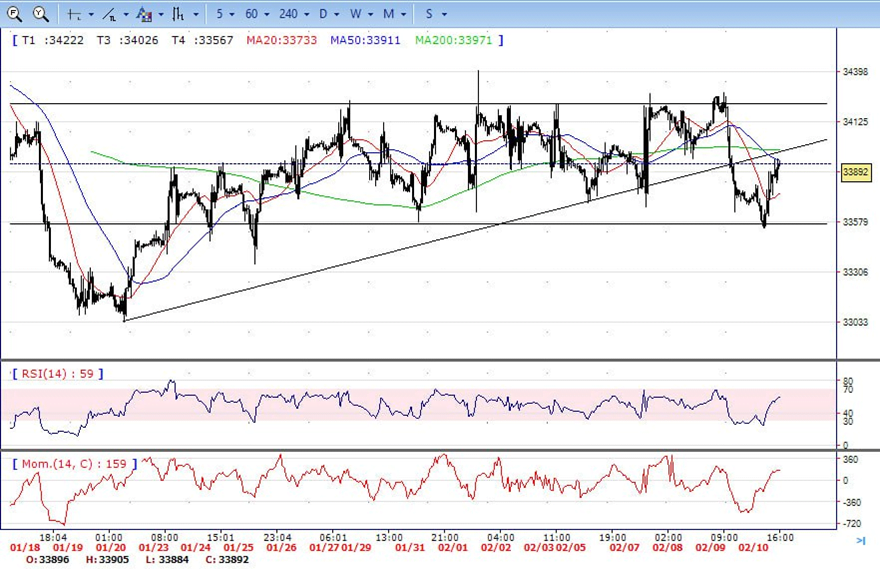
- DJI under the sell pressure on the first half of the day, tumbled to intraday low 33540 area and then made a U turn, recovered more than 300 pips to ended Friday around 33890, up for the day and indicates bullish sign in the hourly chart. Right now market is standing above 20 SMAs, suggests bullish strength. Meanwhile, 20 SMA started turning north and heading towards longer ones, suggests bulls not exhausted yet. On upside, overcome 33930 may encourage bulls to challenge 34230, break above that level will open the gate to 34490.
- Technical indicators suggest the bullish movement, developing above the mid-line. RSI stabilizes around 60, while the Momentum indicator stabilizes in the positive territory, suggests upward potentials. On downside, the immediately support is 33540, break below this level will open the gate for more decline to 33350 area.
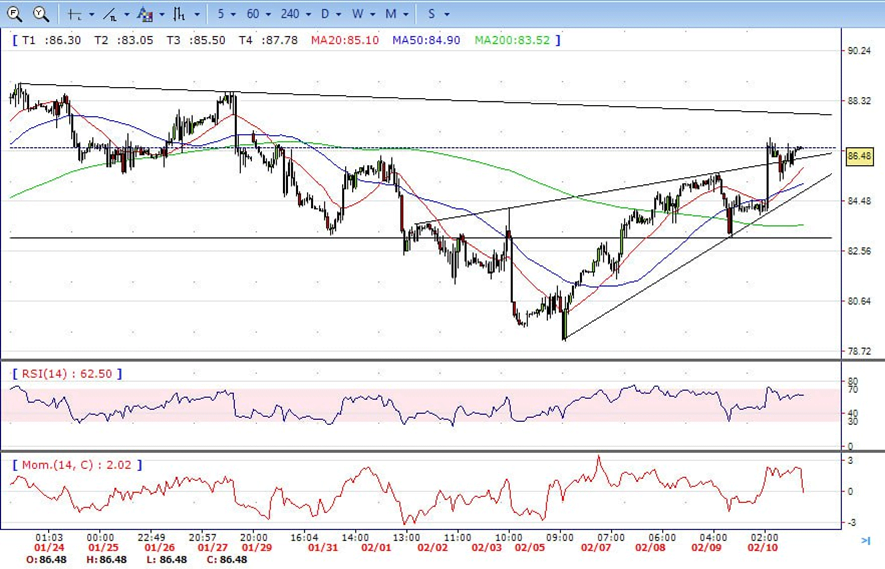
- The Brent continued the advance on Friday, jumped from intraday low 83.90 area to high 86.90. It trimmed some gains and ended the day around 86.50. The price currently stabilizes above 20 and 50 SMA, suggests bullish strength in the hourly chart. Meanwhile, the 20 SMA continued accelerating south and developing above longer ones, indicates bulls not exhausted yet. On upside, overcome 87.00 may encourage bulls to challenge 89.00, break above that level will open the gate to 90.00.
- Technical indicators also suggest bullish movement, hovering above the midline. RSI climbs to 62, while the Momentum indicator stabilizes in positive territory, suggests upward potentials. On downside, the immediately support is 85.30, break below this level will open the gate for more decline to 84.20 area.