12/12/2022 Daily Reports
- Despite a knee-jerk mid-week, the EUR/USD pair is comfortably trading above the 1.0500 threshold, seesawing around 1.0530 following the release of the December University of Michigan’s Consumer Confidence Index, which rose by more than anticipated, to 59.1 from 56.8 in November.
- Upbeat US data helped the US Dollar by the end of the week amid a deteriorating market sentiment. US indexes turned lower with the release, as speculative interest anticipates a potentially aggressive US Federal Reserve. The central bank has anticipated it would slow the pace of quantitative tightening, and Chair Jerome Powell hinted it could happen as soon as this month.
- However, resilient macroeconomic data leaves the door open for yet another 75 bps hike, ahead of a smaller one. Recession concerns add to the dismal mood, as the higher rate goes, the higher are the chances of an economic setback.
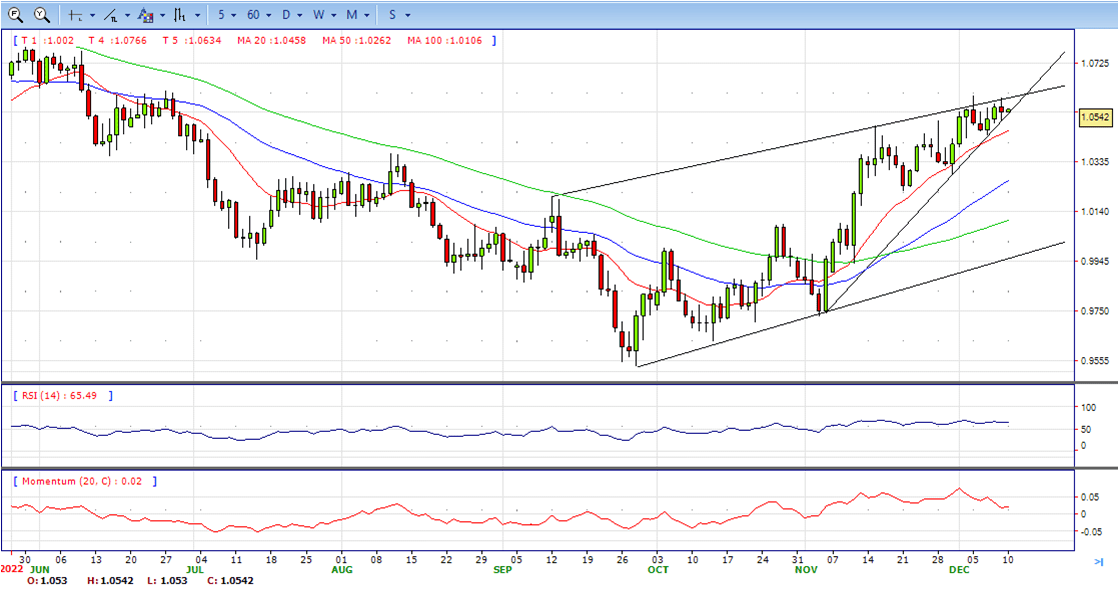
- The EUR/USD pair is trading near the 1.0530, unchanged for the day with bullish stance in daily chart. The pair stabilized above 20 and 50 SMA, indicates bullish strength. Meanwhile, the 20 SMA continued accelerating north and developing far above longer ones, suggests bulls not exhausted yet. On upside, the immediate resistance is 1.0600, break above this level will extend the advance to 1.0700.
- Technical readings in the daily chart support the bullish stances. The RSI indicators hovering above the midline and stabilized around 65. The Momentum indicator stabilized above the midline, indicating upward potentials. On downside, the immediate support is 1.0430 and below this level will open the gate to 1.0290.
- The GBP/USD pair peaked at 1.2321 after Wall Street’s opening but trimmed intraday gains and hovers at around 1.2250. The pair ends the week flat, as demand for the US Dollar remained subdued.
- On Friday, US indexes trade mixed, with the Dow Jones Industrial Average and the S&P 500 in the red, but the Nasdaq Composite up up. Generally better-than-anticipated US macroeconomic data has lifted concerns the US Federal Reserve will go for an aggressive 75 bps hike, which will end up raising the risk of a longer and steeper recession in 2023.
- The week ahead will bring the monetary policy decisions of the US Federal Reserve, the European Central Bank, and more relevantly for the British Pound, the Bank of England. Market participants have fully priced in a 50 bps, and little surprises are expected there. However, investors are unaware of what English policymakers have on the docket for 2023.
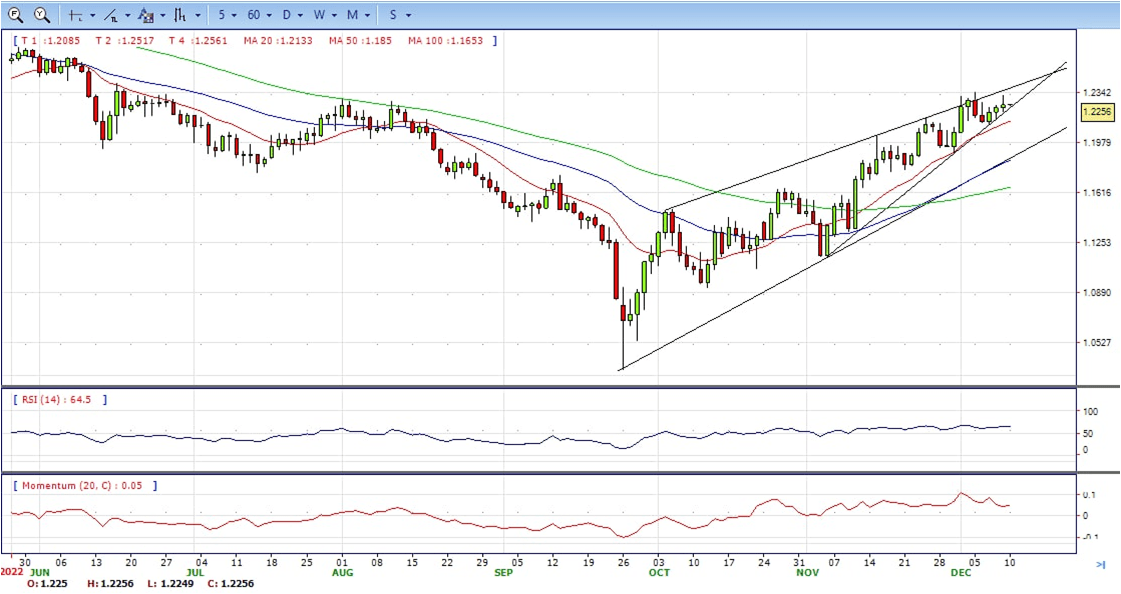
- The GBP/USD offers bullish stance in daily chart. Cable still stabilized above all main SMAs, indicating bullish strength in short term. Meanwhile, the 20 SMA continued accelerating north and developing above longer ones, suggests bulls not exhausted yet. On upside, The immediate resistance is 1.2350 with a break above it exposing to 1.2500.
- Technical readings in the daily chart support the bullish stances. RSI indicator stabilized around 65, while the Momentum indicator stabilized above the midline, suggesting upward potentials. On downside, the immediate support is 1.2200, unable to defend this level will resume the decline to 1.2100.


- Gold price has picked recovery after dropping marginally below $1,790.00. The precious metal is aiming to extend its recovery but failed to hold above resistance of $1,800.00 despite the risk-appetite theme has regained strength. The pair ended Friday at around 1797, still bullish in the daily chart.
- The US Dollar Index is struggling to conquer the immediate resistance of 105.00 as the broader theme doesn’t support a risk-aversion mood. S&P500 showed a precautionary mood on Friday ahead of the last Federal Reserve (Fed)’s monetary policy meeting of CY2022. The US Treasury yields displayed some choppy moved but settled near 3.60% on Friday, showing cautiousness in the global market.
- As per the projections, the headline CPI is expected to remain stable at 7.7%. While the core inflation could display a slight improvement to 6.4% from the former release of 6.3%. The inflationary pressures could display a surprise jump as labor demand remained extremely tight in November and the service sector is booming led by solid demand.
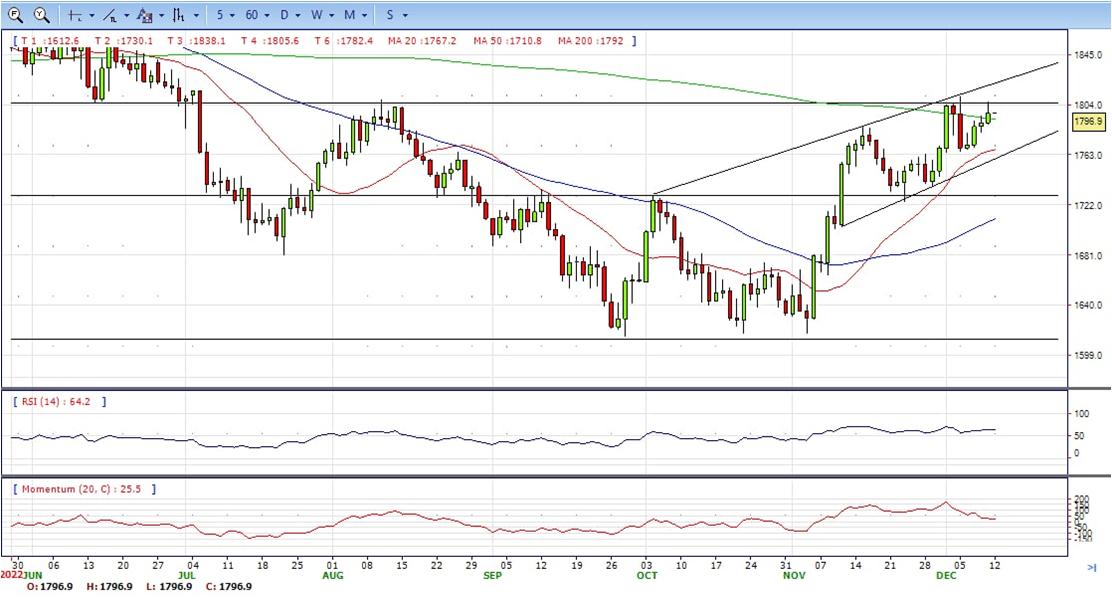
- Gold price stabilized around 1797, up for the day and bullish in the daily chart. The gold price still stabilized above 20 and 50 SMA, suggesting bullish strength in short term. Meanwhile, the 20 SMA continued accelerating north and developing above 50 SMA, indicating bulls not exhausted yet. On upside, the immediate resistance is 1810, break above this level will open the gate to extend the advance to 1830 area.
- From a technical perspective, the RSI indicator hold above the midline and stabilized around 64, suggesting bullish strength. The Momentum indicator stabilized above the midline, suggests upward potentials. On downside, the immediate support is 1765, below this area may resume the decline to 1730.


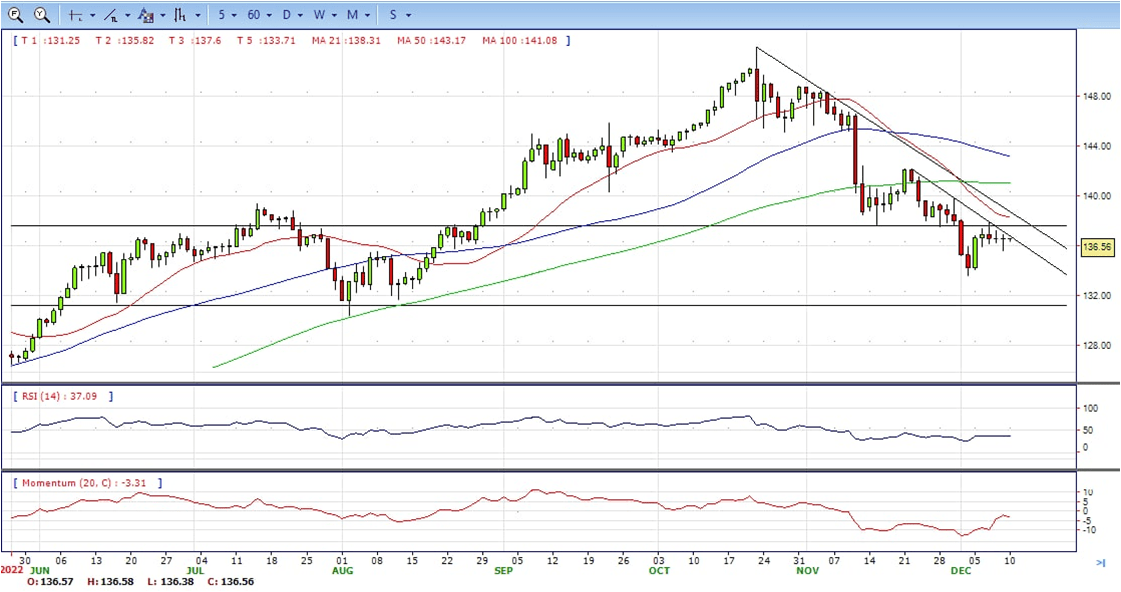
- The USD/JPY pair comes under fresh selling pressure on the last day of the week and drops to a multi-day low, albeit lacks follow-through. The pair trims a part of its intraday losses and trades around the 136.50 region, down around 0.1% for the day.
- The US Dollar prolongs its steady descent for the third successive day amid firming expectations for a less aggressive policy tightening by the Fed, which, in turn, is seen weighing on the pair. In fact, the markets seem convinced that the US central bank will slow the pace of its rate-hiking cycle and have been pricing in a 50 bps lift-off in December.
- In the meantime, traders on Friday will take cues from the US economic docket, featuring the release of the PPI and the Prelim Michigan Consumer Sentiment Index. This, along with the US bond yields, could provide some impetus to the USD. Apart from this, the broader risk sentiment might produce some trading opportunities around the USD/JPY pair.
- The USD/JPY pair stabilized around 136.50, down for the day and bearish in the daily chart. The price still maintains the downward slope and develops below all main SMAs, suggests bearish strength in short term. Meanwhile, 20 SMA continued accelerating south and developing below longer ones, indicating bears not exhausted. On upside, overcome 136.90 may encourage bulls to challenge 137.90, break above that level will open the gate to 139.60.
- Technical indicators suggest the bearish strength. RSI stabilized around 37, while the Momentum indicator continued developing below the midline, suggests downward potentials. On downside, the immediate support is 135.60, break below this level will open the gate to 135.00 area.
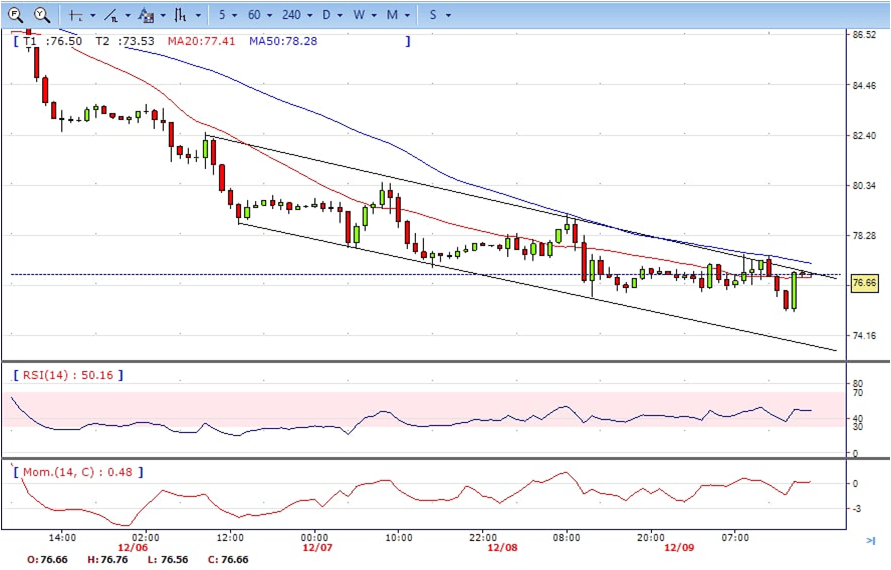
- Brent still under the sell pressure, dropped from intraday high 77.50 to intraday low 75.14 area. It recovered some losses and ended Friday at around 76.66, up for the day and neutral to bearish in the hourly chart. The price stabilized below 20 and 50 SMAs, suggests bearish strength in short term. Meanwhile, the 20 SMA continued developing below 50 SMA despite it started turning falt, indicating bearish bias. On upside, overcome 77.50 may encourage bulls to challenge 79.20, break above this level will open the gate to 80.50.
- Technical indicators suggest the neutral to bearish movement, hovering near the midline. RSI stabilized at around 49, while the Momentum indicator stabilized near the midline, suggests directionless potentials. On downside, the immediate support is 75.10, break below this level will open the gate for more decline to 74.00 area.