

10/02/2023 Daily Reports
- EUR/USD finally picks up some convincing upside traction and approaches the key resistance area near 1.0800 the figure on Thursday. It failed to hold that gains and back to familiar range 1.0735 to ended the day.
- The German Harmonized Index of Consumer Prices (HICP) unexpectedly rose by 9.2% YoY in January, below the 10% expected and easing from the previous 9.6%.
- The US Dollar benefited from higher government bond yields but also from comments from Richmond Federal Reserve President Thomas Barkin, who said that the effects of the Fed’s policy tightening has been substantial while adding that macroeconomic data put back the risk of a recession.
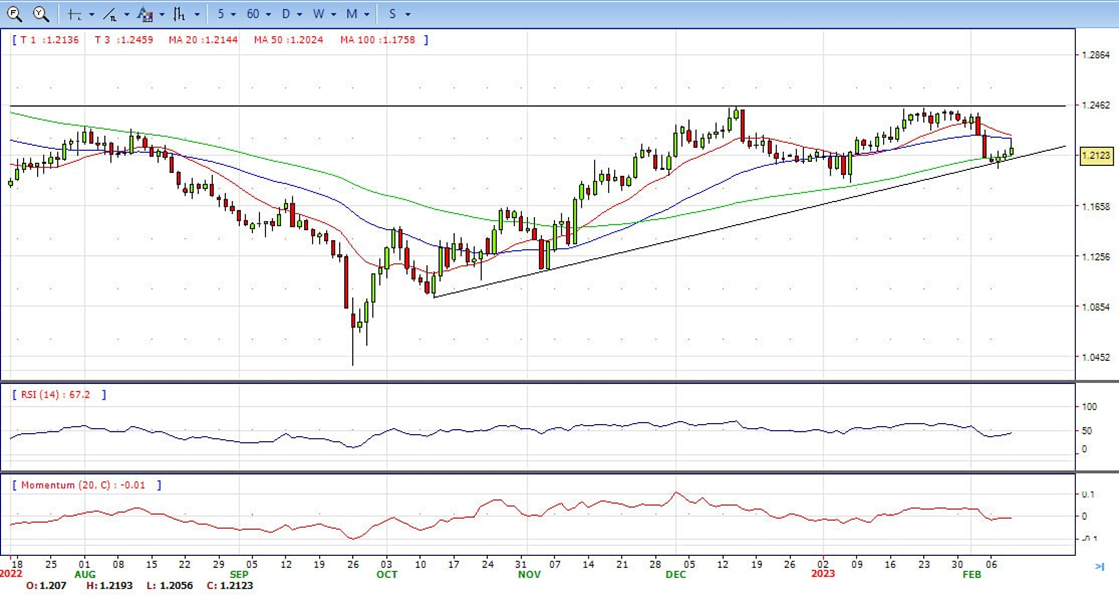
- The EUR/USD pair is trading near the 1.0735, unchanged for the day with bearish stance in daily chart. The pair stabilized below 20 and 50 SMA, indicates bearish strength. Meanwhile, the 20 SMA started turning south and heading towards longer ones, suggests bears not exhausted yet. On upside, the immediate resistance is 1.0800, break above this level will extend the advance to 1.0930.
- Technical readings in the daily chart support the bearish stance. The RSI indicator stabilizes around 47. The Momentum indicator holds below the midline, indicating downward potentials. On downside, the immediate support is 1.0670 and below this level will open the gate to 1.0580.

- GBP/USD rallied in a parabolic fashion on Thursday on the third day of demand for the British Pound. The pair travelled from a low of 1.2056 to a high of 1.2194 before reversing back to test the midpoint of the 1.21 area and recently reaching a sell-off low of 1.2125.
- The Bank of England (BoE) Monetary Policy Report Hearings provided support to the Pound. Governor Andrew Bailey, Chief Economist Huw Pill and policymaker Jonathan Haskel testified before the UK Treasury Select Committee.
- Among other things, they said that they expect inflation “to come down rapidly this year.” However, policymaker Silvana Tenreyro later in the day noted that, in her view, rates are now too high, and a massive recession would be needed to push inflation down to 2%. She finally added she would consider a rate cut.
- The GBP/USD offers bearish stance in daily chart. Cable stabilizes below 20 and 50 SMA, indicating bearish strength in short term. Meanwhile, the 20 SMA started turning south and heading towards longer ones, suggests bears not exhausted yet. On upside, The immediate resistance is 1.2200 with a break above it exposing to 1.2270.
- Technical readings in the daily chart support the bearish stances. RSI indicator stabilizes around 45, while the Momentum indicator stabilizes below the midline, suggesting downward potentials. On downside, the immediate support is 1.1960, unable to defend this level will resume the decline to 1.1840.


- Gold prices remained downward pressured on Thursday, even though USD is printing losses of 0.83%. Meanwhile, US Treasury bond yields extended their losses from around weekly highs at 3.692% to 3.592%, a tailwind for Gold prices. Despite all that, the XAU/USD is trading below its opening price, exchanging hands at 1860.
- Economic data from the US showed that unemployment claims rose above estimates, indicating a slight shift in the US labor market. Initial Jobless Claims for the week ending February 4 increased by 195K, above forecasts of 190K, as reported by the Department of Labor . Albeit high-tech companies had announced a series of layoffs, the US economy added more than 500K in January, as revealed by the last US Nonfarm Payrolls report.
- In the meantime, the US Dollar Index, a gauge of the buck’s value against a basket of six currencies, edges down by 0.31%, at 103.147, failed to bolster Gold prices. The US 10-year Treasury bond yield stages a recovery after dipping to its daily low of 3.575% and climbing to 3.609%.
- Gold price stabilized around 1859, slightly up for the day and neutral in the daily chart. The gold price stabilized below 20 SMA, suggesting bearish strength in short term. However, the 20 and 50 SMA continued accelerating north and developing above 200 SMA, indicating bulls not exhausted yet. On upside, the immediate resistance is 1891, break above this level will open the gate for more advance to 1920 area.
- From a technical perspective, the RSI indicator holds below the mid-line and stabilizes around 47, on a bearish strength. The Momentum indicator hold near the midline, suggests directionless potentials. On downside, the immediate support is 1860, below this area may resume the decline to 1830.


- The USD/JPY erases Wednesday’s gains and aims toward the 131.50 during the North American session. At the time of writing, the USD/JPY exchanges hands at 131.55, above its opening price by 0.14%..
- The US Dollar retreats from a one-month top amid the uncertainty over the Fed’s rate-hike path and is seen as a key factor exerting some downward pressure on the USD/JPY pair. Fed Chair Jerome Powell struck a balanced tone on inflation and reiterated on Tuesday that the process of disinflation was underway. This, in turn, fuels speculations that interest rates may not rise much further, which drags the US Treasury bond yields lower and weighs on the greenback.
- Powell, however, acknowledged that rates might need to move higher than expected if the economy remains strong. A slew of FOMC members echoed Fed Chair Jerome Powell’s hawkish view that additional rate hikes were likely warranted to control inflation. This, in turn, might hold back traders from placing bearish bets around the greenback. Apart from this, a generally positive tone around the equity futures – could undermine the safe-haven JPY and lend support to the USD/JPY pair..
- The USD/JPY pair stabilized around 131.55, up for the day and neutral to bullish in the daily chart. The price broke above the downward bearish trend line and develops above 20 SMA, suggests bullish strength in short term. However, 20 SMA started turning flat but continued developing far below longer ones, indicating bears not exhausted. On upside, overcome 131.80 may encourage bulls to challenge 133.00, break above that level will open the gate to 134.70.
- Technical indicators still suggest the neutral strength. RSI climbs to around 52, while the Momentum indicator stabilizes just above the midline, suggests upward potentials. On downside, the immediate support is 130.20, break below this level will open the gate to 129.00 area.

- DJI under the sell pressure again after rejected by 34230 strong resistance zone. It tumbled to intraday low 33628 area and recovered 120 pips to ended Thursday around 33740, down for the day and indicates bullish sign in the hourly chart. Right now market is standing below 20 and 50 SMAs, suggests bearish strength. Meanwhile, 20 SMA started turning south and heading towards longer ones, suggests bears not exhausted yet. On upside, overcome 33930 may encourage bulls to challenge 34230, break above that level will open the gate to 34490.
- Technical indicators suggest the bearish movement, developing below the mid-line. RSI stabilizes around 26, while the Momentum indicator stabilizes in the negative territory, suggests downward potentials. On downside, the immediately support is 33600, break below this level will open the gate for more decline to 33350 area.

- The Brent under the sell pressure on Thursday, tumbled from intraday high 85.50 area to low 83.08. It trimmed some losses and ended the day around 84.08. The price currently stabilizes below 20 and 50 SMA, suggests bearish strength in the hourly chart. Meanwhile, the 20 SMA continued accelerating south and heading towards longer ones, indicates bears not exhausted yet. On upside, overcome 84.70 may encourage bulls to challenge 85.50, break above that level will open the gate to 86.20.
- Technical indicators also suggest bearish movement, hovering below the midline. RSI drops to 44, while the Momentum indicator stabilizes in negative territory, suggests downward potentials. On downside, the immediately support is 83.00, break below this level will open the gate for more decline to 81.50 area.


