09/12/2022 Daily Reports
- EUR/USD is firmly higher on Thursday due to diminishing expectations for the Federal Reserve (Fed) to keep raising interest rates at the same aggressive pace. EUR/USD is currently 0.38% higher having rallied from a low of 1.0489 to a high of 1.0564 on the day so far.
- Weekly jobless claims rose to 230K, as expected. Continuing claims rose to 1.671M, topping the forecast of 1.6M and the data comes ahead of next week’s Federal Reserve meeting. Money markets show there is a 91% chance that the policy-setting Federal Open Market Committee (FOMC) will raise rates by half a point next week, and just a 9% chance there will be another 75 basis point increase.
- There will be more key data events coming up before the Federal Reserve December 14 meeting. The Producer Price Index and the University of Michigan’s consumer sentiment survey on Friday as well as November’s Consumer Price Index are due. Investors will be on the watch for any signs that the Federal Reserve is getting ready to pause its hikes.
- The EUR/USD pair is trading near the 1.0555, up for the day with bullish stance in daily chart. The pair stabilized above 20 and 50 SMA, indicates bullish strength. Meanwhile, the 20 SMA continued accelerating north and developing far above longer ones, suggests bulls not exhausted yet. On upside, the immediate resistance is 1.0600, break above this level will extend the advance to 1.0700.
- Technical readings in the daily chart support the bullish stances. The RSI indicators hovering above the midline and stabilized around 66. The Momentum indicator stabilized above the midline, indicating upward potentials. On downside, the immediate support is 1.0430 and below this level will open the gate to 1.0290.

- The GBP/USD is up on Thursday for the second day in a row but the upside remains limited by the 1.2250 area. Risk appetite and a weaker dollar are supporting the pair.
- Economic data released on Thursday showed US Initial Jobless Claims rose as expected to 230K in the week ended December 3 while Continuing Claims increased by 62K in the week of November 26 to 1.671 million, above the 1.575 million of market consensus, hitting the highest level since early February.
- On Friday, China will report the Consumer Price Index for November that is expected to show an increase of 1% (annual). The Bank of England will release the Consumer Inflation Expectations report. In the US are due the Producer Price Index and the University of Michigan Consumer Sentiment report.
- The GBP/USD offers bullish stance in daily chart. Cable still stabilized above all main SMAs, indicating bullish strength in short term. Meanwhile, the 20 SMA continued accelerating north and developing above longer ones, suggests bulls not exhausted yet. On upside, The immediate resistance is 1.2270 with a break above it exposing to 1.2350.
- Technical readings in the daily chart support the bullish stances. RSI indicator stabilized around 64, while the Momentum indicator stabilized above the midline, suggesting upward potentials. On downside, the immediate support is 1.2100, unable to defend this level will resume the decline to 1.2030.


- Gold price is up on the day by some 0.22% after rising from a low of $1,781 to a high of $1,794.80 so far on Thursday. Markets have been relatively quiet on the day with little data released and the Federal Reserve in a blackout. Yellow metal ended Thursday at around 1788, still bullish in the daily chart.
- The US Dollar index, as measured by the DXY index, fell 0.4% from a high of 105.433 to a low of 104.724, making gold less expensive for other currency holders. The dip came at the same time a rise in weekly jobless claims suggested that the labour market is slowing down. Weekly jobless claims rose to 230K, as expected. Continuing claims rose to 1.671M, topping the forecast of 1.6M and the data comes ahead of next week’s Federal Reserve meeting.
- Meanwhile, supportive of the Gold price, safe haven assets were in strong demand amid growing recessionary fears this week as seen in the thirty-year Treasuries that dropped more than 10bp to a three-month low while yields on the 10-year were also lower. The yield curve between the 2-year and 10-year Treasury notes US 10-year has also widened in recent days.
- Gold price stabilized around 1788, up for the day and bullish in the daily chart. The gold price still stabilized above 20 and 50 SMA, suggesting bullish strength in short term. Meanwhile, the 20 SMA continued accelerating north and developing above 50 SMA, indicating bulls not exhausted yet. On upside, the immediate resistance is 1810, break above this level will open the gate to extend the advance to 1830 area.
- From a technical perspective, the RSI indicator hold above the midline and stabilized around 63, suggesting bullish strength. The Momentum indicator stabilized above the midline, suggests upward potentials. On downside, the immediate support is 1765, below this area may resume the decline to 1730.


- The USD/JPY is falling on Thursday but still holds above the 136.00/30 support area. The pair peaked on Asian hours at 137.25 and then turned to the downside. It is hovering around 136.45, down for the second day in a row.
- The US Dollar Index (DXY) is down by 0.28% despite modestly higher US Treasury yields and on the back of risk appetite. The biggest gainers on Thursday are commodity prices as gold and silver rise sharply.
- The Japanese yen is up versus the US Dollar despite yields and higher equity prices. The Dow Jones is up by 0.74% and the Nasdaq gains more than 1%. Economic data released in the US came in below expectations with Initial Jobless Claims rising to 230K in the week ended December 3 while Continuing Claims increased by 62K in the week of November 26 to 1.671 million, the highest level since early February.
- The USD/JPY pair stabilized around 136.70, down for the day and bearish in the daily chart. The price still maintains the downward slope and develops below all main SMAs, suggests bearish strength in short term. Meanwhile, 20 SMA continued accelerating south and developing below longer ones, indicating bears not exhausted. On upside, overcome 137.90 may encourage bulls to challenge 139.60, break above that level will open the gate to 140.80.
- Technical indicators suggest the bearish strength. RSI stabilized around 37, while the Momentum indicator continued developing below the midline, suggests downward potentials. On downside, the immediate support is 136.00, break below this level will open the gate to 135.00 area.

- DJI jumped to intraday high 33930 area in the first half of the day. It trimmed some gains in the US session and ended Thursday at around 33750, up for the day and bullish in the daily chart. The price stabilized above 20 and 50 SMA, suggests bullish strength. Meanwhile, 20 SMA continued accelerating north and developing above 50 SMA, suggests bulls not exhausted yet. On upside, overcome 33930 may encourage bulls to challenge 34080, break above this level will open the gate to 34310.
- Technical indicators indicates the neutral to bullish strength. RSI stabilized around 50, while the Momentum indicator stabilized above the midline, suggests upward potentials. On downside, the immediate support is 33660, break below this level will open the gate for more decline to 33180 area.

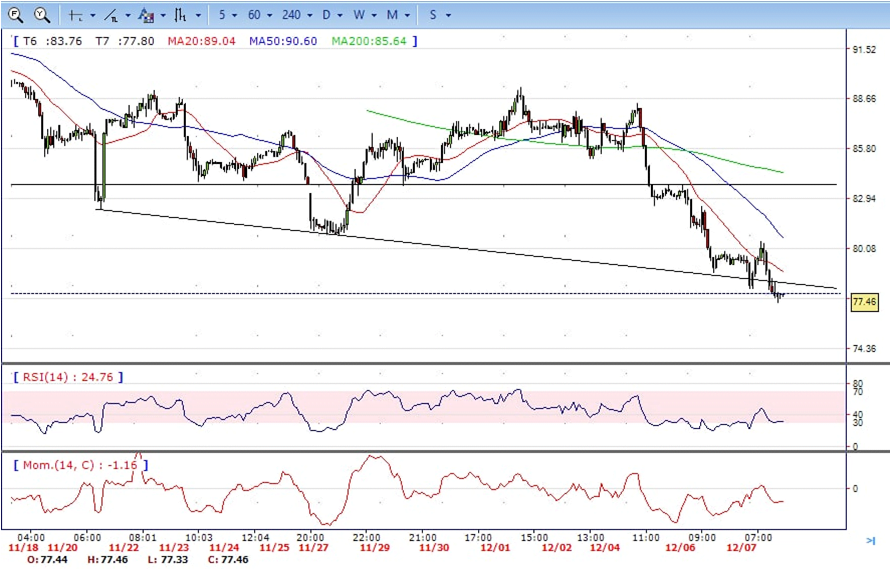
- Brent still under the sell pressure, dropped from intraday high 79.16 to intraday low 75.76 area. It hold near the bottom and ended Thursday at around 76.05, down for the day and bearish in the hourly chart. The price stabilized below 20 and 50 SMAs, suggests bearish strength in short term. Meanwhile, the 20 SMA continued accelerating south and developing below 50 SMA, indicating bearish bias. On upside, overcome 77.50 may encourage bulls to challenge 79.20, break above this level will open the gate to 80.50.
- Technical indicators suggest the bearish movement, hovering below the midline. RSI stabilized at around 36, while the Momentum indicator stabilized below the midline, suggests downward potentials. On downside, the immediate support is 75.70, break below this level will open the gate for more decline to 75.00 area.