08/12/2022 Daily Reports
- The EUR/USD dropped near 1.0500 following comments from Russian President Putin. The Euro is among the weakest currencies of the American session. Earlier it peaked at 1.0549, the highest level in two days.
- Market sentiment deteriorated briefly after Russian President Vladimir Putin said the threat of nuclear war is on the rise. He added they have the most advanced weapons but they don’t want to use them. He considers it possible using nukes as a response to an attack.
- The US Treasury yield curve inverted the most in over forty years, amid concerns related to the global economic growth and uncertainty ahead of the looming US Federal Reserve monetary policy decision. Yields finished the day in the red, as demand for government bonds resurged following news coming from Russia. The 10-year note currently yields 3.43%, while the 2-year note pays 4.26%.
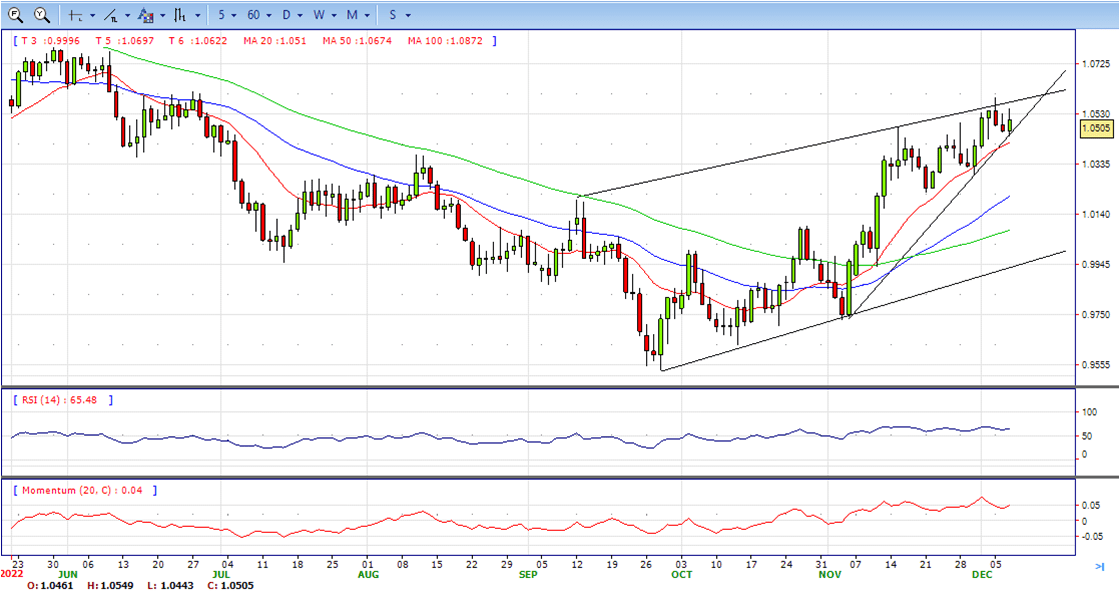
- The EUR/USD pair is trading near the 1.0505, up for the day with bullish stance in daily chart. The pair stabilized above 20 and 50 SMA, indicates bullish strength. Meanwhile, the 20 SMA continued accelerating north and developing far above longer ones, suggests bulls not exhausted yet. On upside, the immediate resistance is 1.0600, break above this level will extend the advance to 1.0700.
- Technical readings in the daily chart support the bullish stances. The RSI indicators hovering above the midline and stabilized around 64. The Momentum indicator stabilized above the midline, indicating upward potentials. On downside, the immediate support is 1.0430 and below this level will open the gate to 1.0290.
- The British Pound turned positive despite overall risk aversion triggered by China’s exports weakening. Additionally, the latest headlines involving Russian President Vladimir Putin, saying that “the threat of nuclear war is increasing,” bolstered the US Dollar, giving another leg-down to the GBP/USD pair. Nevertheless, the Sterling has recovered, and the GBP/USD is trading at 1.2205, above its opening price, after reaching a high of 1.2234.
- Sentiment remains deteriorated after China’s Trade Balance data weakened, showing that Exports plunged 8.7% YoY, below estimates of 0.3% contraction. Economic data since the second half of the last week from the US showed that the labor market remains tight and that wages are rising, a signal that is not going to be liked by Fed Chair Jerome Powell.
- The lack of economic data on the UK front keeps the Pound Sterling adrift to US Dollar dynamics. However, it appears that the political drama spurred during the premiership of Lizz Truss has abated so far, due to a fiscally responsible budget, by the new Prime Minister Rishi Sunak. Nevertheless, it should be said that the UK economy is “likely” already in recession, and a gloomy outlook with labor shortages, wage inflation, Brexit jitters, and weak investment, could hurt the prospects for higher GBP/USD spot prices.
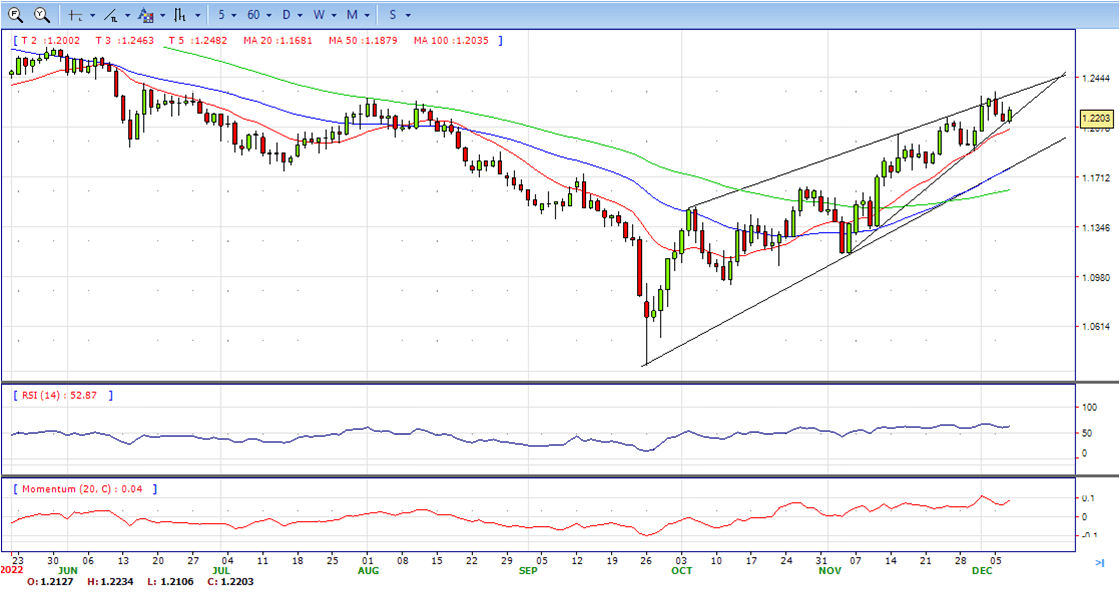
- The GBP/USD offers bullish stance in daily chart. Cable still stabilized above all main SMAs, indicating bullish strength in short term. Meanwhile, the 20 SMA continued accelerating north and developing above longer ones, suggests bulls not exhausted yet. On upside, The immediate resistance is 1.2240 with a break above it exposing to 1.2350.
- Technical readings in the daily chart support the bullish stances. RSI indicator stabilized around 63, while the Momentum indicator stabilized above the midline, suggesting upward potentials. On downside, the immediate support is 1.2100, unable to defend this level will resume the decline to 1.2030.


- Gold price is higher on the day having climbed from a low of $1,768.7 and reaching a high of $1,790.5 so far as the US Dollar tails off in the mid-afternoon session in the US. At the time of writing, XAU/USD is 1% higher at $1,787 as the greenback slides while China announces some easing in its zero-COVID strategy.
- The US Dollar finishes Wednesday with losses against most of its major rivals, despite a dismal market mood. The decline was contained, but it’s clear that the tie has changed for the American currency and more declines are now in the docket.
- The US Treasury yield curve inverted the most in over forty years, amid concerns related to the global economic growth and uncertainty ahead of the looming US Federal Reserve monetary policy decision. Yields finished the day in the red, as demand for government bonds resurged following news coming from Russia. The 10-year note currently yields 3.43%, while the 2-year note pays 4.26%.
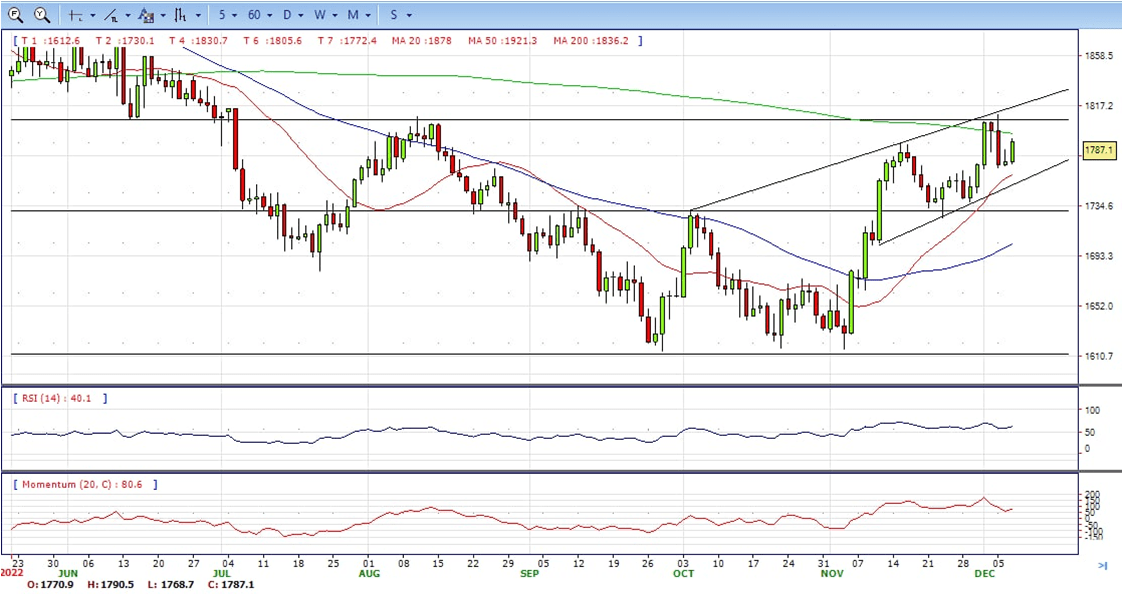
- Gold price stabilized around 1787, up for the day and bullish in the daily chart. The gold price still stabilized above 20 and 50 SMA, suggesting bullish strength in short term. Meanwhile, the 20 SMA continued accelerating north and developing above 50 SMA, indicating bulls not exhausted yet. On upside, the immediate resistance is 1810, break above this level will open the gate to extend the advance to 1830 area.
- From a technical perspective, the RSI indicator hold above the midline and stabilized around 62, suggesting bullish strength. The Momentum indicator stabilized above the midline, suggests upward potentials. On downside, the immediate support is 1765, below this area may resume the decline to 1730.


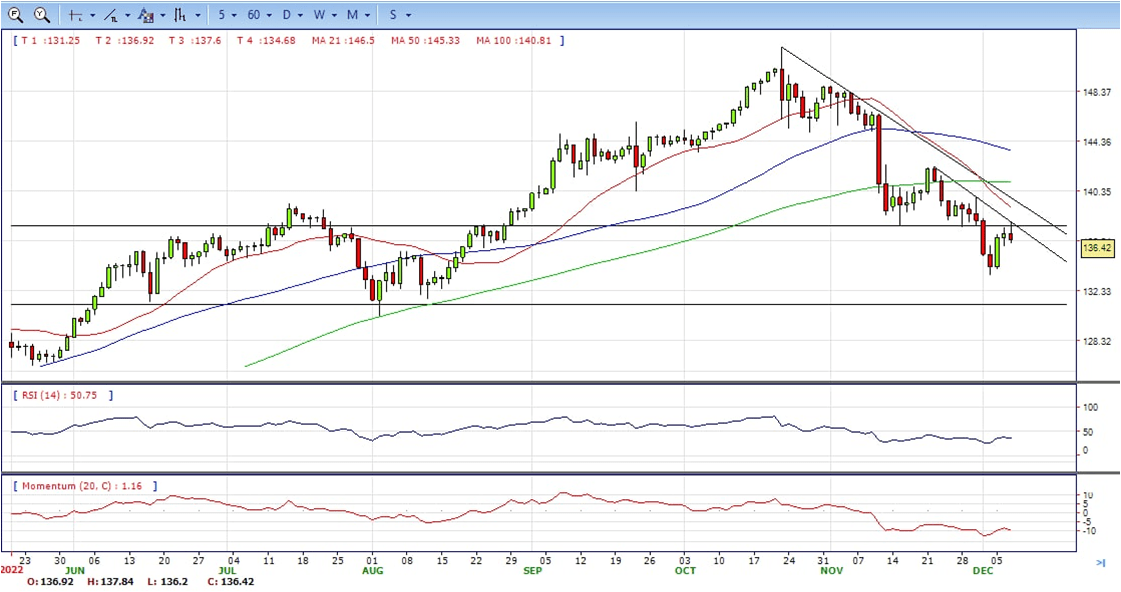
- The USD/JPY broke below the 137.55 area and fell to 136.39, printing a fresh daily low. The pair is retreating from weekly highs amid a weaker US Dollar. It is trading modestly lower for the day, after rising for two consecutive days.
- Data released on Wednesday, showed an increase in Unit Labor Cost in the US during the third quarter of 2.4%, below the 3.2% of markets consensus. Nonfarm Productivity rose by 0.8% surpassing expectations of an increase of 0.5%. On Thursday, Jobless Claims data is due and on Friday, the Producer Price Index. Next week, on Tuesday, is the Consumer Prices Index and on Wednesday the FOMC decision.
- The rally in Treasuries and the decline in equity prices are boosting the Japanese Yen which is among the top performers of the American session. On the contrary, the US Dollar is falling across the board. The DXY is down by 0.43%, approaching 105.00.
- The USD/JPY pair stabilized around 136.40, down for the day and bearish in the daily chart. The price still maintains the downward slope and develops below all main SMAs, suggests bearish strength in short term. Meanwhile, 20 SMA continued accelerating south and developing below longer ones, indicating bears not exhausted. On upside, overcome 136.90 may encourage bulls to challenge 137.90, break above that level will open the gate to 139.50.
- Technical indicators suggest the bearish strength. RSI stabilized around 37, while the Momentum indicator continued developing below the midline, suggests downward potentials. On downside, the immediate support is 136.00, break below this level will open the gate to 135.00 area.
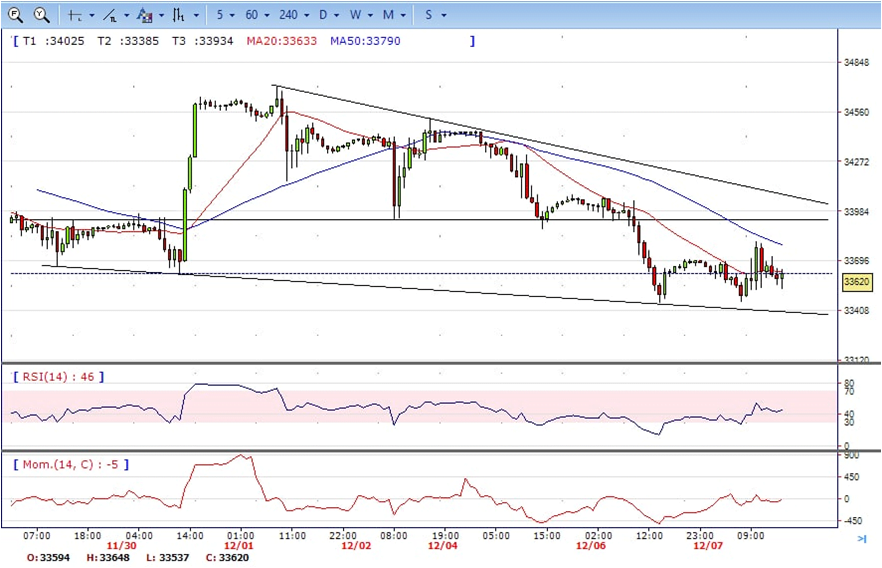
- DJI consolidated in the familiar range, advanced from intraday low 33460 area to high 33800. However, it failed to hold the gains and ended Wednesday at around 33610, unchanged for the day. The price stabilized below 20 and 50 SMA, suggests bearish strength. Meanwhile, 20 SMA continued developing below 50 SMA despite it started turning flat, suggests bears not exhausted yet. On upside, overcome 33800 may encourage bulls to challenge 34060, break above this level will open the gate to 34310.
- Technical indicators indicates the bearish strength. RSI stabilized around 46, while the Momentum indicator stabilized near the midline, suggests directionless potentials. On downside, the immediate support is 33450, break below this level will open the gate for more decline to 33180 area.
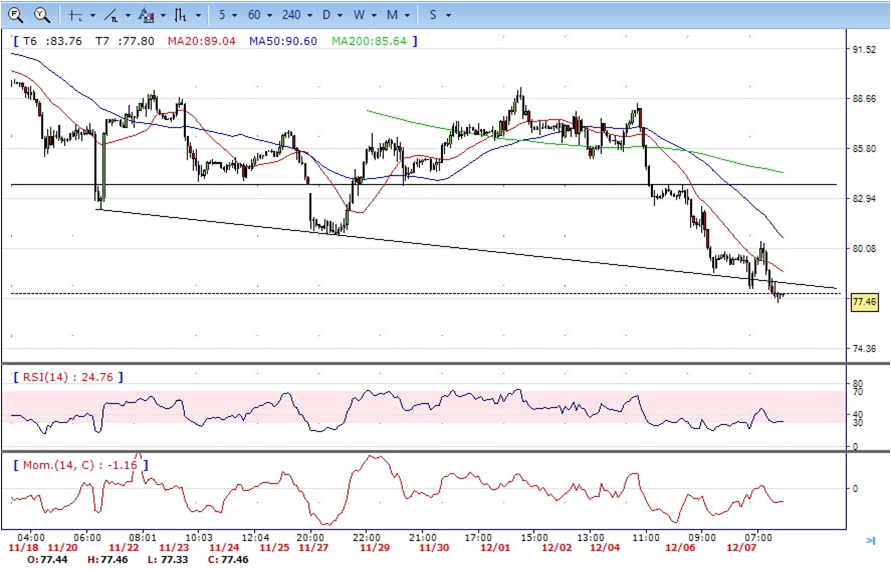
- Brent still under the sell pressure, dropped from intraday high 80.50 to intraday low 76.94 area. It hold near the bottom and ended Tuesday at around 77.50, down for the day and bearish in the hourly chart. The price stabilized below 20 and 50 SMAs, suggests bearish strength in short term. Meanwhile, the 20 SMA continued accelerating south and developing below 50 SMA, indicating bearish bias. On upside, overcome 80.50 may encourage bulls to challenge 82.50, break above this level will open the gate to 83.70.
- Technical indicators suggest the bearish movement, hovering below the midline. RSI stabilized at around 32, while the Momentum indicator stabilized below the midline, suggests downward potentials. On downside, the immediate support is 76.90, break below this level will open the gate for more decline to 75.50 area.