08/06/2023 Daily Reports
- EUR/USD bounces off the 200-day Exponential Moving Average and climbs above the 1.0700 handle due to ECB official hawkish commentaries boosting the Euro. Meanwhile, the US Dollar dives as expectations for Fed’s June rate hike fade. The EUR/USD is trading at around 1.070, a gain of 0.12%.
- Sentiment deteriorated after a brief jump in equities. A sudden slump of the CBOE Volatility Index, known as the fear index, to 2020 lows shifted investors’ mood, which appeared to book profits, though it remained away from the US Dollar. Before Wall Street opened, the US Bureau of Economic Analysis revealed the US deficit widened, as shown by the Balance of Trade to $-74.6B in April of 2023, vs. March $-60.B. Exports declined compared to April, came at $249B vs., $258.2B, while imports rose by $323B above March’s $318.8B.
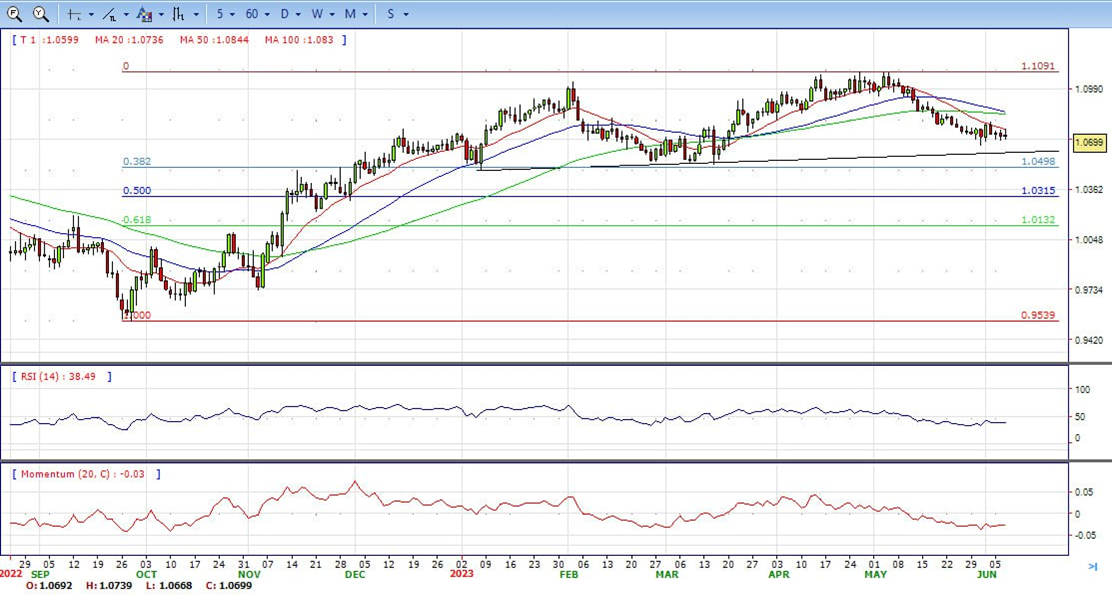
- The EUR/USD pair is trading near the 1.0699, unchanged for the day with bearish stance in daily chart. The pair stabilized below 20 and 50 SMA, indicates bearish strength. Meanwhile, the 20 SMA started turning south and heading towards 50 and 200 SMA, suggests bears not exhausted yet. On upside, the immediate resistance is 1.0780, break above this level will extend the advance to 1.0850.
- Technical readings in the daily chart support the bearish stance. The RSI indicator stabilizes around 38. The Momentum indicator holds below the midline, indicating bearish potentials. On downside, the immediate support is 1.0630 and below this level will open the gate to 1.0500.
- The GBP/USD pair catches aggressive bids following an early dip to sub-1.2400 levels and builds on its intraday positive move through the early North American session on Wednesday. Spot prices jump to 1.2470 region, or a fresh weekly high in the last hour, snapping a three-day losing streak and stalling the recent pullback from a nearly three-week high touched last Friday.
- The US Dollar comes under some renewed selling pressure as traders remain uncertain over the Federal Reserve’s rate-hike path and turns out to be a key factor acting as a tailwind for the GBP/USD pair. Last week’s dovish rhetoric by several Fed officials lifted bets for an imminent pause in the US central bank’s policy tightening cycle. That said, the recent inflation and labor market data from the US kept alive hopes for a 25 bps lift-off at the June FOMC meeting. This, in turn, leads to a modest recovery in the US Treasury bond yields, albeit fails to impress the USD bulls.
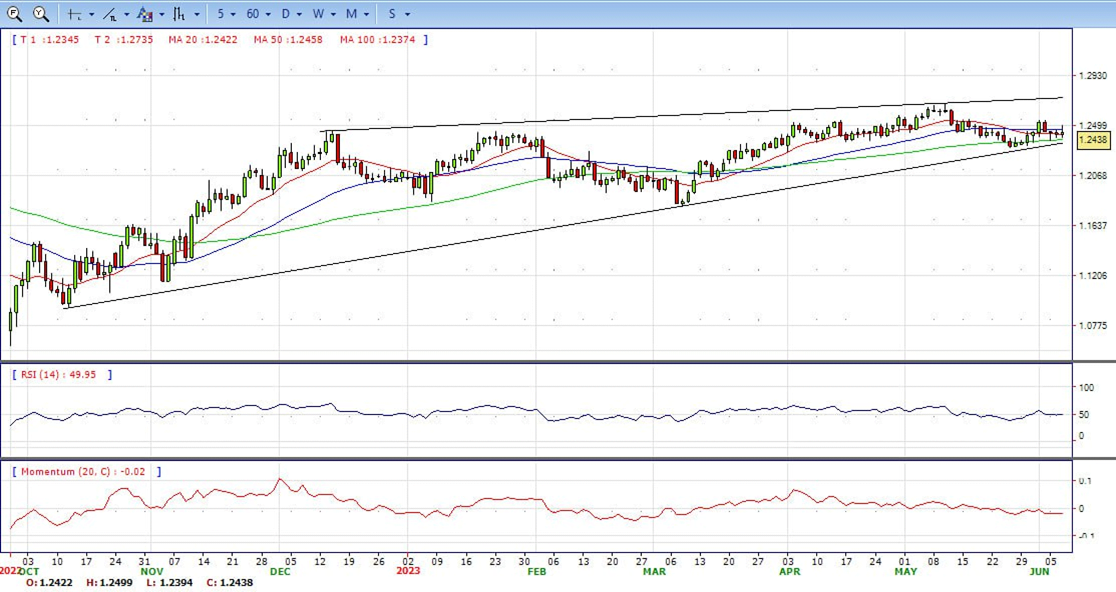
- The GBP/USD offers neutral stance in daily chart. Cable stabilizes near 20 and 50 SMA, indicating neutral strength in short term. Meanwhile, the 20 and 50 SMA started turning flat but continued developing above longer ones, suggests bulls not exhausted yet. On upside, the immediate resistance is 1.2550 with a break above it exposing to 1.2680.
- Technical readings in the daily chart support the neutral to bearish stances. RSI indicator stabilizes around 50, while the Momentum indicator stabilizes below the midline, suggesting downward potentials. On downside, the immediate support is 1.2370, unable to defend this level will resume the decline to 1.2300.


- Gold price retraces after facing solid resistance at the confluence of technical indicators, as well as weighed by rising US Treasury bond yields and a gloomy global economic outlook, with China’s export falling more than estimates. The XAU/USD is trading at $1940, down 1.16%, after hitting a daily high of $1970.
- XAU/USD is on the defensive, weighed by high US bond yields, with the 10-year benchmark note climbing more than ten bps, at 3.774%. US real yields are heading towards the 1.60% region, a headwind for the yellow metal. China’s data revealed that Exports declined 7.5% YoY in US Dollar terms, below estimates for a 1.8% drop; meanwhile, Imports fell a less-than-forecasts at 4.5% YoY in May, vs. an 8.1% plunge.
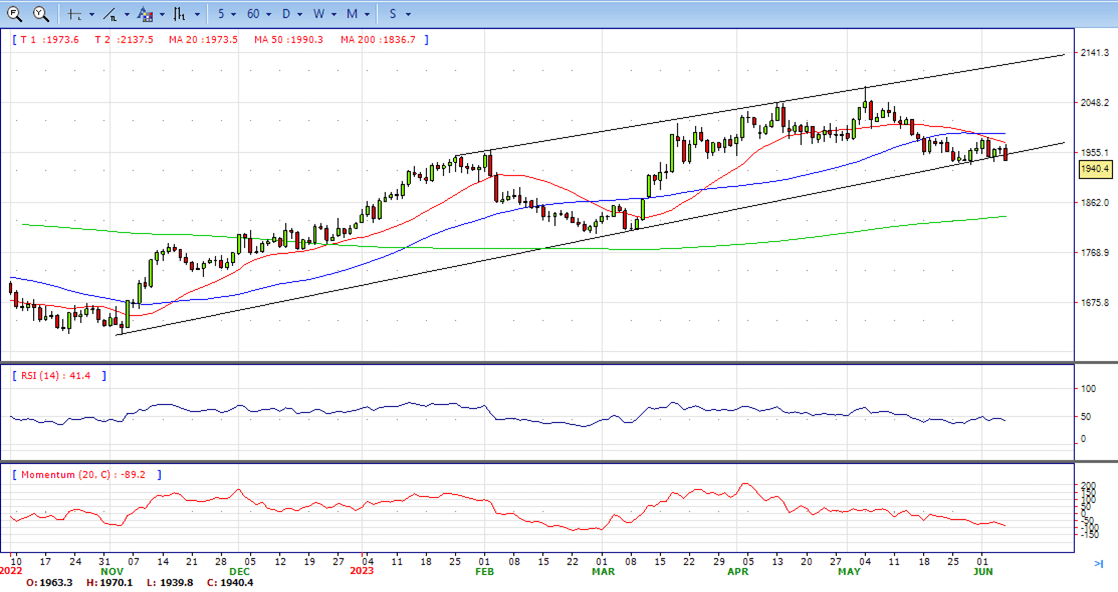
- Gold price stabilized around 1940, down for the day and bearish in the daily chart. The gold price stabilizes below 20 SMA, suggesting bearish strength in short term. However, the 20 SMA started turning flat but continued developing far above 50 and 200 SMA, indicates bulls not exhausted yet. On upside, the immediate resistance is 1985, break above this level will open the gate for more advance to 2000 area.
- From a technical perspective, the RSI indicator holds below the mid-line and stabilizes around 41, on a bearish strength. The Momentum indicator hold in negative territory, suggests downward potentials. On downside, the immediate support is 1931, below this area may resume the decline to 1900.


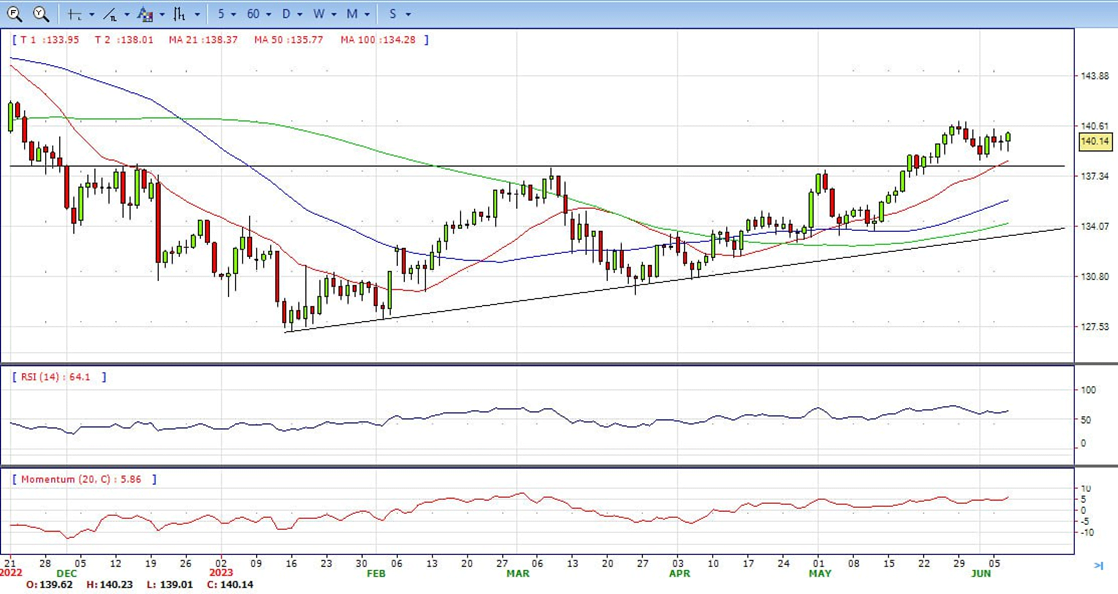
- The USD/JPY pair rose for a second consecutive day on Wednesday to currently trade around 140.00. On the other hand, as per the DXY index, the USD weakened against most of its rivals earlier but cleared daily losses finding support at 103.66 and recovering above 104.00 on the back of significant increases in the US bond yields.
- Market expectations for the upcoming June 13-14 Federal Reserve still favour a no-hike despite the BoC surprise hike on Wednesday boosted prospects of another Fed hike. According to the CME FedWatch Tool, investors are betting on higher odds (64.7%) of the Fed not raising interest rates with expectations of maintaining the target rate at 5.25% but the probabilities of a 25 bps hike jumped to 30%
- The USD/JPY pair stabilized around 140.15, up for the day and bullish in the daily chart. The price stabilizes above 20 and 50 SMA, suggests bullish strength in short term. Meanwhile, 20 SMA continued accelerating north and developing above longer ones, indicating bulls not exhausted. On upside, overcome 141.00 may encourage bulls to challenge 142.30, break above that level will open the gate to 144.00.
- Technical indicators suggest the bullish strength. RSI stabilizes around 64, while the Momentum indicator stabilizes above the midline, suggests upward potentials. On downside, the immediate support is 139.00, break below this level will open the gate to 138.40 area.
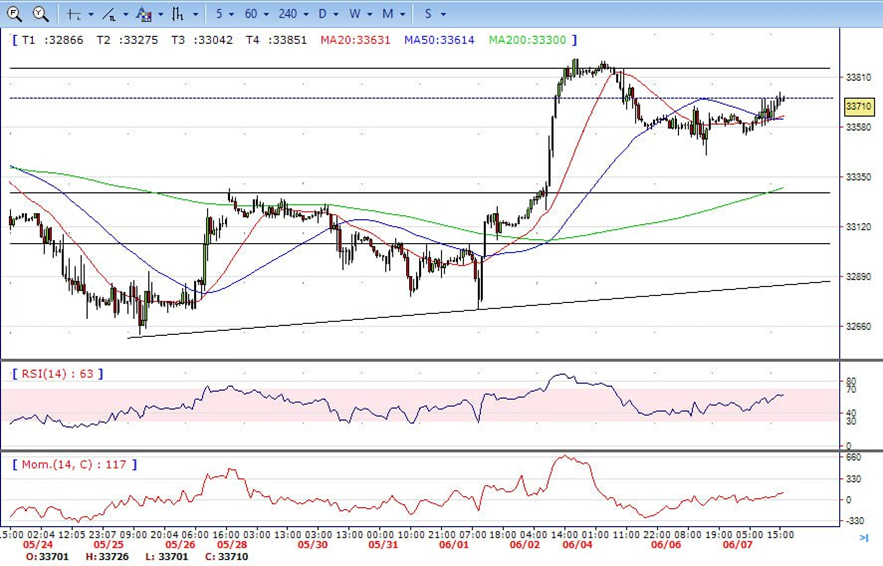
- DJI fluctuated in the familiar range on Wednesday, traded from intraday low 33450 level to high 33750, above 20 SMA, suggests bullish strength. Meanwhile, 20 SMA started turning north and continued developing above 200 SMA, suggests bulls not exhausted yet. On upside, overcome 33900 may encourage bulls to challenge 34050, break above that level will open the gate to 34360.
- Technical indicators suggest the bullish movement. RSI stabilizes around 62, while the Momentum indicator stabilizes above the midline, suggests upward potentials. On downside, the immediately support is 33450, break below this level will open the gate for more decline to 33300 area.
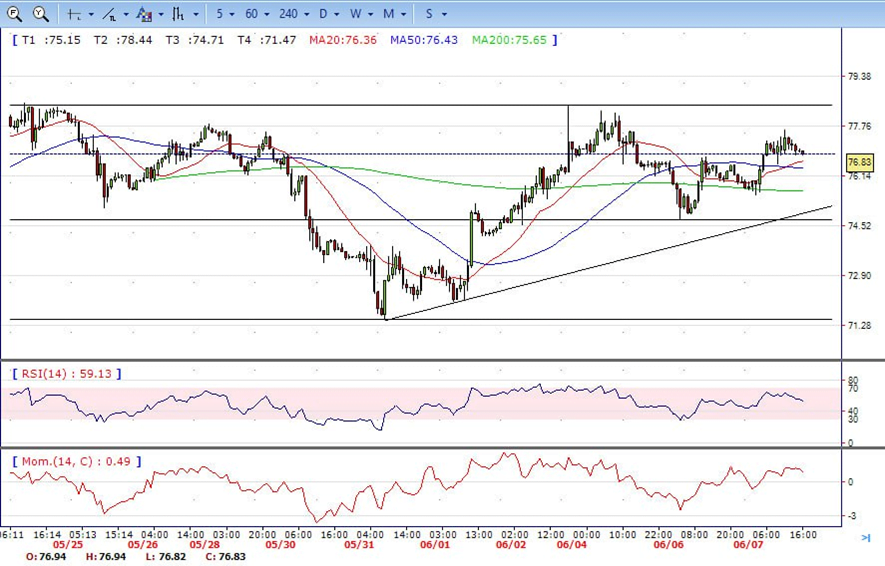
- Brent fluctuated with gains on Wednesday, traded from intraday low 75.50 level to high 77.60 level, it retreated modestly and ended the day around 76.85, up for the day and indicates bullish sign in the hourly chart. Meanwhile, the 20 SMA started turning north and developing above longer ones, indicates bulls not exhausted yet. On upside, overcome 78.50 may encourage bulls to challenge 80.30, break above that level will open the gate to 83.00.
- Technical indicators also suggest bullish movement, hovering above the midline. RSI stabilizes at 54, while the Momentum indicator stabilizes above the midline, suggests upward potentials. On downside, the immediately support is 74.70, break below this level will open the gate for more decline to 73.20 area.