06/03/2023 Daily Reports
- EUR/USD reversed its course and is set to finish the week with gains of more than 0.80% on a softer USD amidst speculations that the US Fed would not hike rates beyond what money market futures expect. The EUR/USD exchanges hands at 1.0635 after hitting a daily low at 1.0588.
- Business activity in the US improved, as shown by the US ISM Non-Manufacturing PMI for February was 55.1, a tick lower than the previous month’s 55.2, but exceeded expectations of 54.5, indicating that business activity is still strong. The prices index subcomponent, sought by investors for clues about inflation, jumped to 65.5, exceeding estimates of 64.5 but trailing January’s data.
- Aside from this, the Eurozone revealed S&P Global Services and Composite PMIs came above previous readings. Meanwhile, inflationary figures announced on Thursday came below last month’s data but above estimates, a reason for the ECB to continue to hike interest rates.
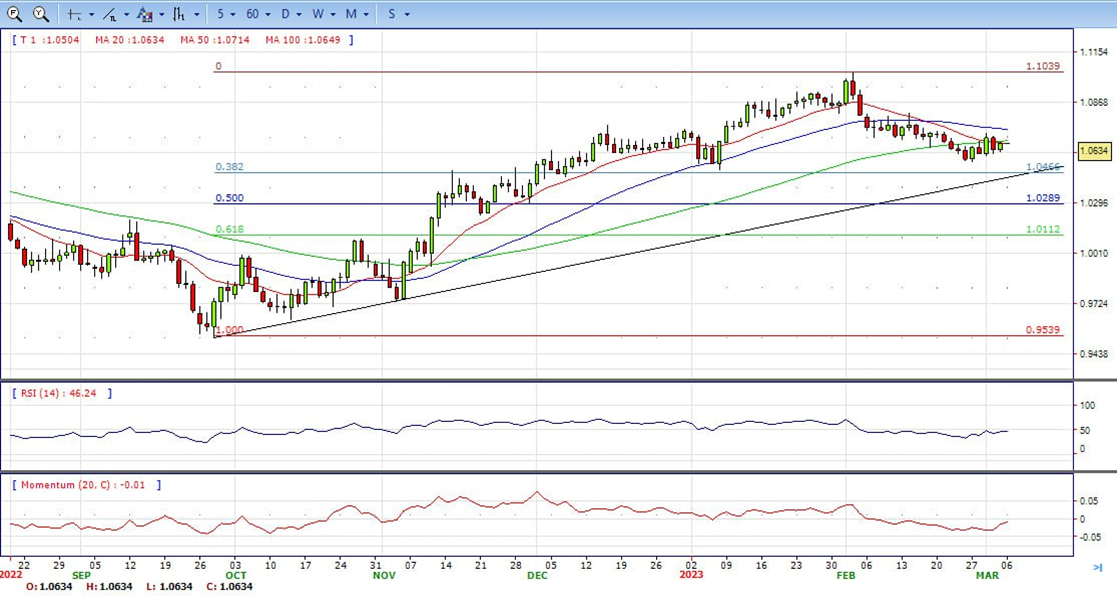
- The EUR/USD pair is trading near the 1.0635, up for the day with bearish stance in daily chart. The pair still stabilized below 20 and 50 SMA, indicates bearish strength. Meanwhile, the 20 SMA started turning south and heading towards longer ones, suggests bears not exhausted yet. On upside, the immediate resistance is 1.0700, break above this level will extend the advance to 1.0800.
- Technical readings in the daily chart support the bearish stance. The RSI indicator stabilizes around 47. The Momentum indicator holds below the midline, indicating downward potentials. On downside, the immediate support is 1.0530 and below this level will open the gate to 1.0470.
- The GBP/USD fell to 1.1960 after the release of the US ISM Service PMI and then rebounded. The pair continues to move on upside, near 1.2040, modestly high for the week.
- The last first-tier release of the week was the US ISM Service PMI for February which came at 55.1, below January’s 55.2, and slightly above the market consensus of 54.5. The Prices Paid Index sub-component dropped from 67.8 to 65.6, still above expectations for a slide to 64.5. The Employment Index jumped to 54, versus expectations of a decline to 49.8.
- The numbers gave the US Dollar some momentum, but price action remain subdued on Friday with major pairs consolidating. The greenback is moving with a positive intraday bias supported by a rebound in US yields. The US 10-year yield rose from 3.97% to 4.02%.
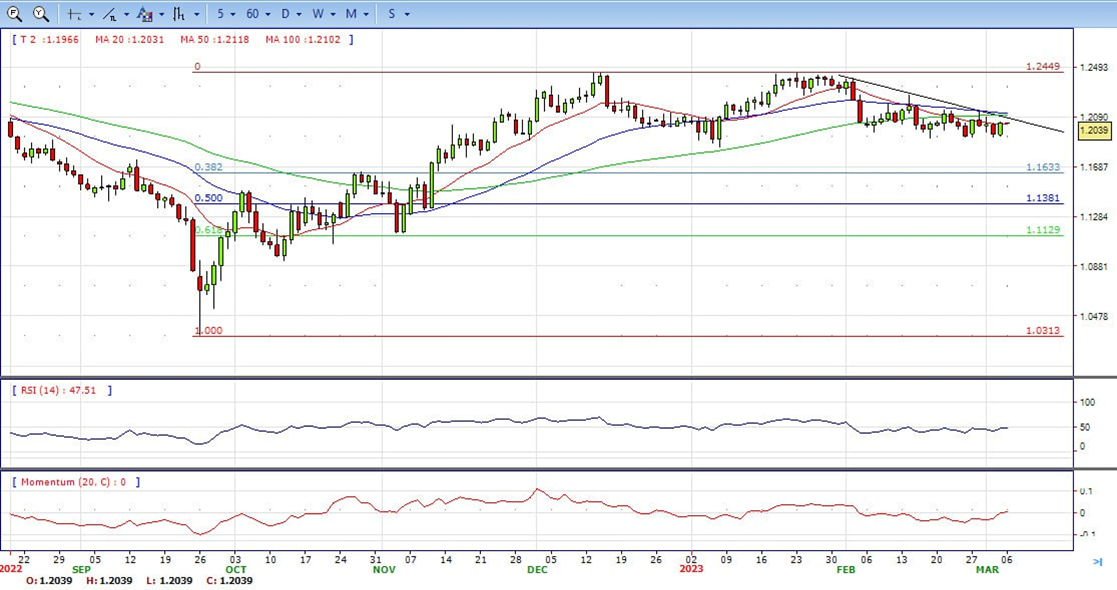
- The GBP/USD offers bearish stance in daily chart. Cable still stabilizes below 20 and 50 SMA, indicating bearish strength in short term. Meanwhile, the 20 SMA continued accelerating south and heading towards longer ones, suggests bears not exhausted yet. On upside, The immediate resistance is 1.2150 with a break above it exposing to 1.2270.
- Technical readings in the daily chart support the bearish stances. RSI indicator stabilizes around 48, while the Momentum indicator stabilizes below the midline, suggesting downward potentials. On downside, the immediate support is 1.1910, unable to defend this level will resume the decline to 1.1840.


- Gold price bulls have returned to action this week, helping the bright metal break out of a bearish trend that had dominated XAU/USD price action during February. The pair ended the day around $1856, neutral in the daily chart.
- The ISM Services PMI came in at 55.1 in February, above the 54.5 expected and slightly under the 55.2 of January. The Prices Paid Index pulled back from 67.8 to 65.5, above the 64.5 of market consensus. Ahead of the NFP week, the Employment Index jumped to 54, against expectations of a slide to 49.8.
- In the meantime, investors keep watching the US 10-year Treasury bond yield market, which rallied past the round 4% resistance on Wednesday and remains above this crucial level. The usual inverse correlation of Gold price with the US Treasury yields could provide downward pressures on XAU/USD if yields stay high, but a retracement in that bond market could propel the bright metal on a notable surge.
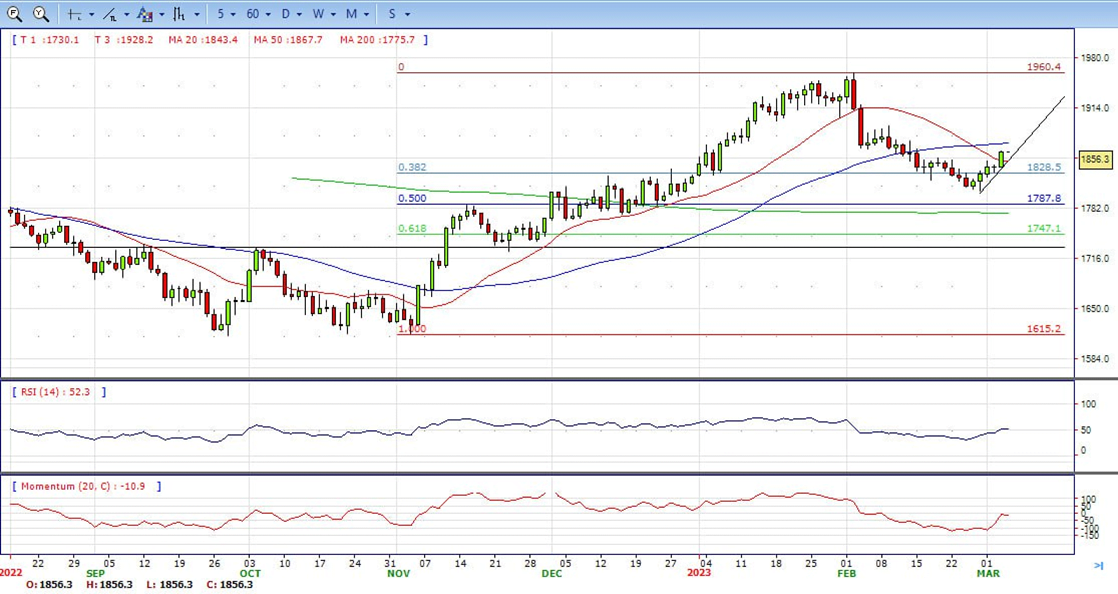
- Gold price stabilized around 1856, up for the day and neutral in the daily chart. The gold price stabilized between 20 and 50 SMA, suggesting neutral strength in short term. Meanwhile, the 20 SMA continued accelerating south and heading towards 200 SMA, indicating bears not exhausted yet. On upside, the immediate resistance is 1870, break above this level will open the gate for more advance to 1891 area.
- From a technical perspective, the RSI indicator holds near the mid-line and stabilizes around 51, on a neutral strength. The Momentum indicator hold just below the midline, suggests directionless potentials. On downside, the immediate support is 1830, below this area may resume the decline to 1805.


- The USD/JPY slides from 136.70s below the 136.00 area on Friday amidst broad US Dollar weakness even though data cemented the US economy resilience. At the time of writing, the USD/JPY exchanges hands at 135.81.
- The ISM Non-Manufacturing PMI data for February, showed a rise to 55.1, roundly beating expectations of 54.5, and almost pipping the previous month’s 55.2. US Dollar pairs reacted immediately, and began rising as traders bet on the Federal Reserve having to step in with sterner disinflationary measures, perhaps even raising interest rates more aggressively than is currently expected, with probabilities steadily rising of the higher 50 bps rate hike coming from the Fed in March.
- The data also showed a rise in the Employment component of the survey, to 54.0 from 50.0 and New Orders to 62.6 from 60.4. Price Paid fell to 65.6 from 67.8, however, offsetting the hype marginally and suggesting a slight easing in inflationary forces. The Business Activity component, meanwhile showed a fall 56.3 from 60.4.
- The USD/JPY pair stabilized around 135.80, down for the day and bullish in the daily chart. The price stabilizes above 20 and 50 SMA, suggests bullish strength in short term. Meanwhile, 20 SMA continued accelerating north and heading towards longer ones, indicating bulls not exhausted. On upside, overcome 137.10 may encourage bulls to challenge 138.20, break above that level will open the gate to 139.60.
- Technical indicators suggest the bullish strength. RSI stabilizes around 63, while the Momentum indicator stabilizes in the positive territory, suggests upward potentials. On downside, the immediate support is 135.20, break below this level will open the gate to 134.00 area.

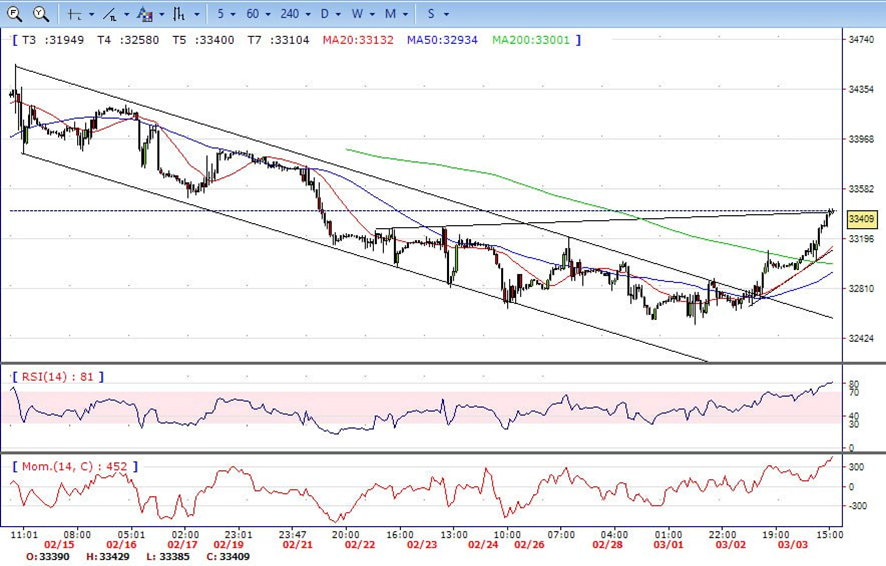
- DJI continued the advance on Friday, rallied from intraday low 32950 area to high above 33400 area. It hold near the top and ended the week around 33400, up for the day and indicates bullish sign in the hourly chart. Right now market is standing above 20 and 50 SMA, suggests bullish strength. Meanwhile, 20 and 50 SMA started turning north and heading towards longer one, suggests bulls not exhausted yet. On upside, overcome 33550 may encourage bulls to challenge 33860, break above that level will open the gate to 34220.
- Technical indicators suggest the bullish movement. RSI stabilizes around 81, while the Momentum indicator stabilizes in positive territory, suggests bullish potentials. On downside, the immediately support is 33130, break below this level will open the gate for more decline to 32830 area.
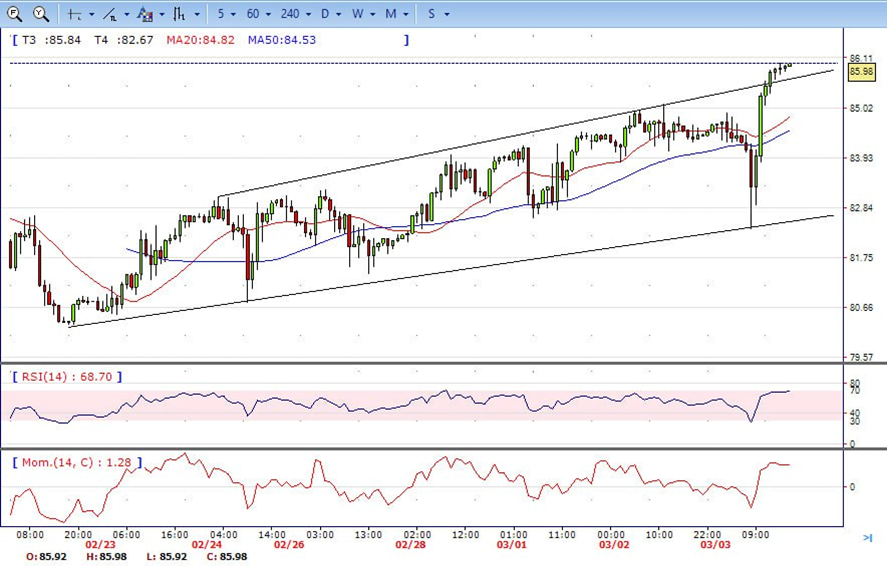
- Brent tumbled to low 82.40 in London session on Friday, but reversed the direction and jumped to high 86.00 area on US session. It hold near the top and ended the week with gains around 86.00. The price currently stabilizes above 20 and 50 SMA, suggests bullish strength in the hourly chart. Meanwhile, the 20 SMA continued accelerating north and developing above longer ones, indicates bulls not exhausted yet. On upside, overcome 87.00 may encourage bulls to challenge 89.00, break above that level will open the gate to 91.50.
- Technical indicators also suggest bullish movement, hovering above the midline. RSI climbs to 68, while the Momentum indicator stabilizes in positive territory, suggests upward potentials. On downside, the immediately support is 85.00, break below this level will open the gate for more decline to 83.70 area.