01/06/2023 Daily Reports
- EUR/USD stumbles past the 1.0700 mark erasing last Tuesday’s gains, and extends its fall toward the 1.0660s area after upbeat economic data from the US boosted the greenback. Earlier, EU data showed that inflation is easing, hence the EUR weakness. At the time of writing, the EUR/USD is trading at 1.0682m, down by more than 0.40%.
- Risk aversion has been the main driver since the beginning of the trading day. Further exacerbated by weak manufacturing activity in China and US debt-ceiling jitters, it triggered a flight to safety, namely the US Dollar. Data-wise, the US economic agenda featured a surprising JOLTs report for April, with vacancies climbing the most in three months, cane at 10.1M, exceeding estimates of 9.375M and 300K more than March.
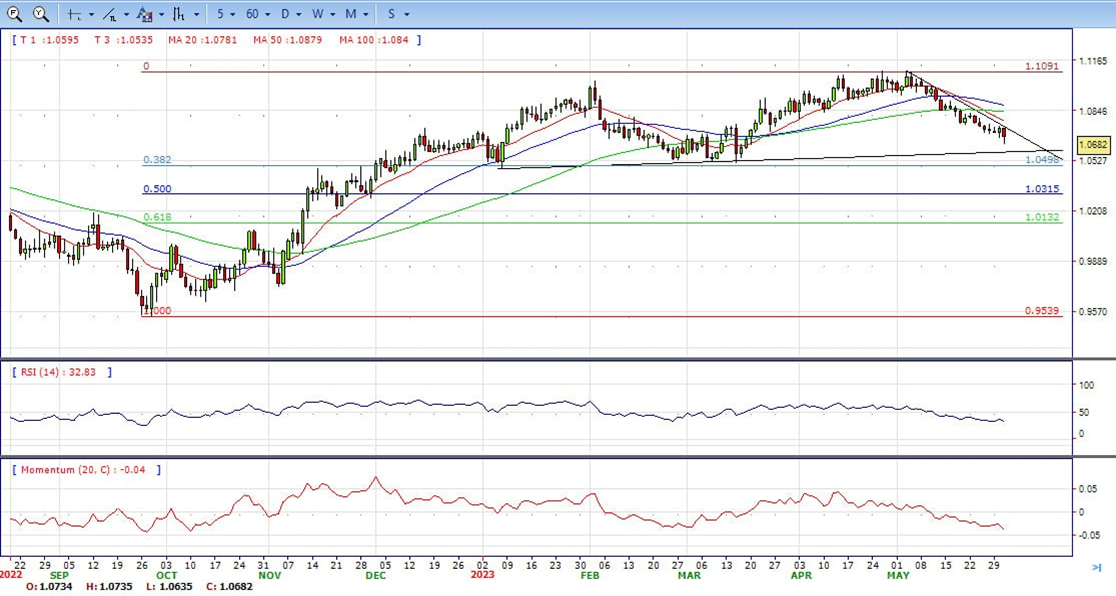
- The EUR/USD pair is trading near the 1.0680, down for the day with bearish stance in daily chart. The pair stabilized below 20 and 50 SMA, indicates bearish strength. Meanwhile, the 20 SMA started turning south and heading towards 50 and 200 SMA, suggests bears not exhausted yet. On upside, the immediate resistance is 1.0760, break above this level will extend the advance to 1.0850.
- Technical readings in the daily chart support the bearish stance. The RSI indicator stabilizes around 33. The Momentum indicator holds below the midline, indicating bearish potentials. On downside, the immediate support is 1.0630 and below this level will open the gate to 1.0500.
- The GBP/USD pair attracts some dip-buying near the 1.2350-1.2345 area on Wednesday and climbs to the top end of its daily trading range during the North American session. The pair is currently placed around the 1.2440 mark, up for the day.
- The US Dollar trims a part of its intraday gains to the highest level since mid-March in reaction to the disappointing release of the Chicago PMI, which fell to 40.4 in May from the 48.6 previous. The British Pound, on the other hand, continues to draw some support from the possibility of additional interest rate hikes by the BoE, bolstered by stronger-than-expected consumer inflation figures released last week. This, in turn, lends some support to the GBP/USD pair, though the lack of follow-through buying warrants caution before positioning for an extension of the recent bounce from the 1.2300 neighbourhood, or a nearly two-month low set last Thursday.
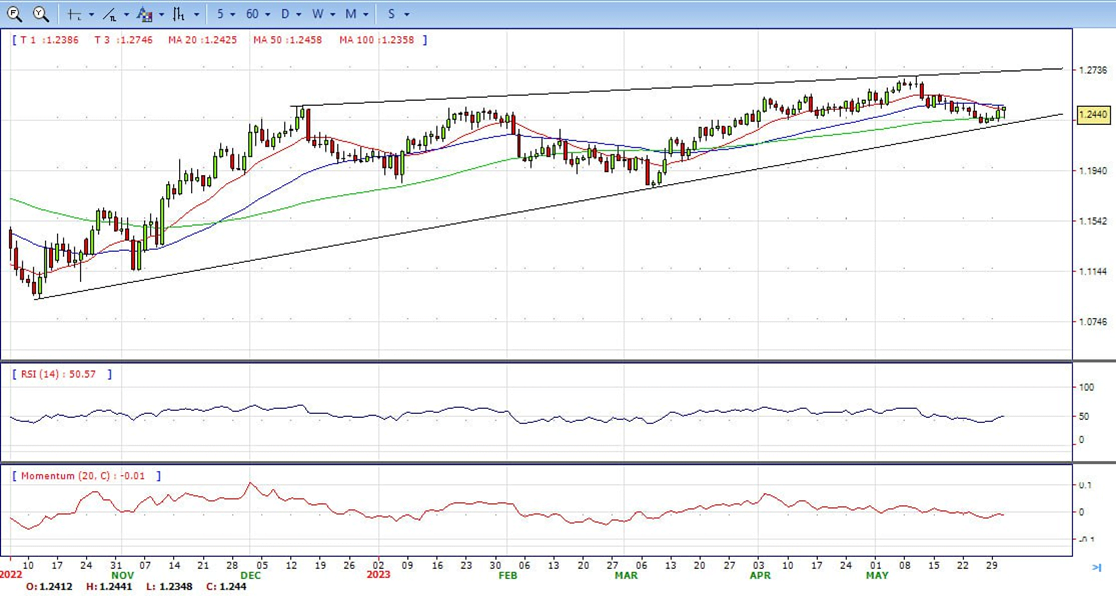
- The GBP/USD offers neutral to bearish stance in daily chart. Cable stabilizes between 20 and 50 SMA, indicating neutral strength in short term. Meanwhile, the 20 SMA started turning south and heading towards longer ones, suggests bears not exhausted yet. On upside, the immediate resistance is 1.2450 with a break above it exposing to 1.2550.
- Technical readings in the daily chart support the neutral to bearish stances. RSI indicator stabilizes around 50, while the Momentum indicator stabilizes below the midline, suggesting downward potentials. On downside, the immediate support is 1.2380, unable to defend this level will resume the decline to 1.2300.


- Gold prices are up for the second consecutive day on Wednesday, driven by lower government bond yields. The yellow metal reached its highest level in a week and now is trading above $1,963.
- US data released so far on Wednesday has been mixed. The JOLTS Job Openings came in at 10.10 million in April, against expectations of a decrease to 9.73 million. Meanwhile, the Chicago PMI showed a sharp decline in May from 48.6 to 40.4, against expectations of 47. These economic figures triggered market volatility. On Thursday, the ADP Employment report and the weekly Jobless Claims are due, while on Friday, the official Employment report will be released.
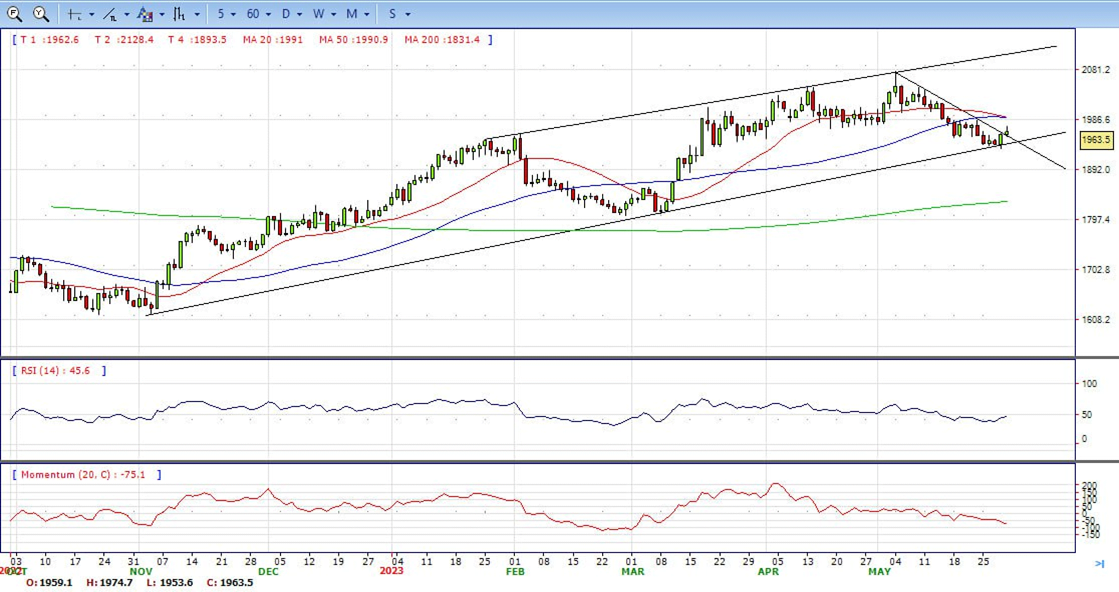
- Gold price stabilized around 1963, up for the day and bearish in the daily chart. The gold price stabilizes below 20 SMA, suggesting bearish strength in short term. However, the 20 SMA started turning flat but continued developing far above 50 and 200 SMA, indicates bulls not exhausted yet. On upside, the immediate resistance is 1975, break above this level will open the gate for more advance to 1985 area.
- From a technical perspective, the RSI indicator holds below the mid-line and stabilizes around 46, on a bearish strength. The Momentum indicator hold in negative territory, suggests downward potentials. On downside, the immediate support is 1950, below this area may resume the decline to 1932.


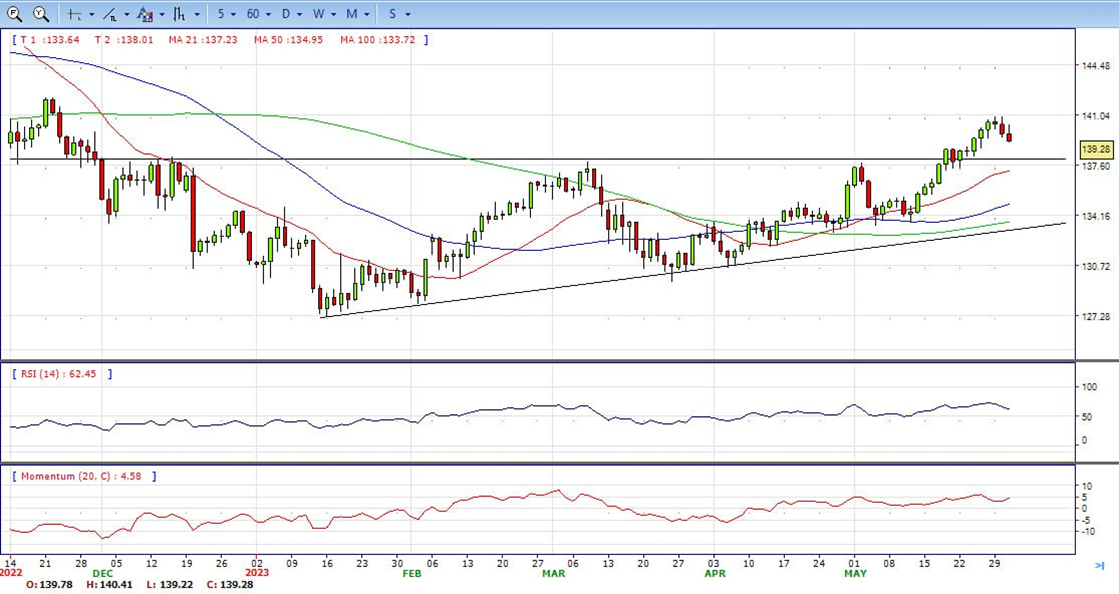
- The USD/JPY pair extends the overnight retracement slide from the vicinity of the 141.00 mark, or a six-month high and remains under some follow-through selling on Wednesday. The pair maintains its offered tone through the day and currently trade around 139.30, down over 0.30% for the day.
- A combination of factors provides a goodish lift to the JPY, which, in turn, is seem exerting downward pressure on the USD/JPY pair for the third successive day. The disappointing release of the official Chinese PMI prints for May adds to worries about a global economic slowdown and tempers investors’ appetite for riskier assets. This, along with the prospect of Japanese authorities intervening in the markets, boosts demand for the safe-haven JPY and contributes to the offered tone around the major.
- The USD/JPY pair stabilized around 139.30, down for the day and bullish in the daily chart. The price stabilizes above 20 and 50 SMA, suggests bullish strength in short term. Meanwhile, 20 SMA continued accelerating north and developing above longer ones, indicating bulls not exhausted. On upside, overcome 140.00 may encourage bulls to challenge 141.00, break above that level will open the gate to 142.30.
- Technical indicators suggest the bullish strength. RSI stabilizes around 62, while the Momentum indicator stabilizes above the midline, suggests upward potentials. On downside, the immediate support is 138.80, break below this level will open the gate to 137.20 area.
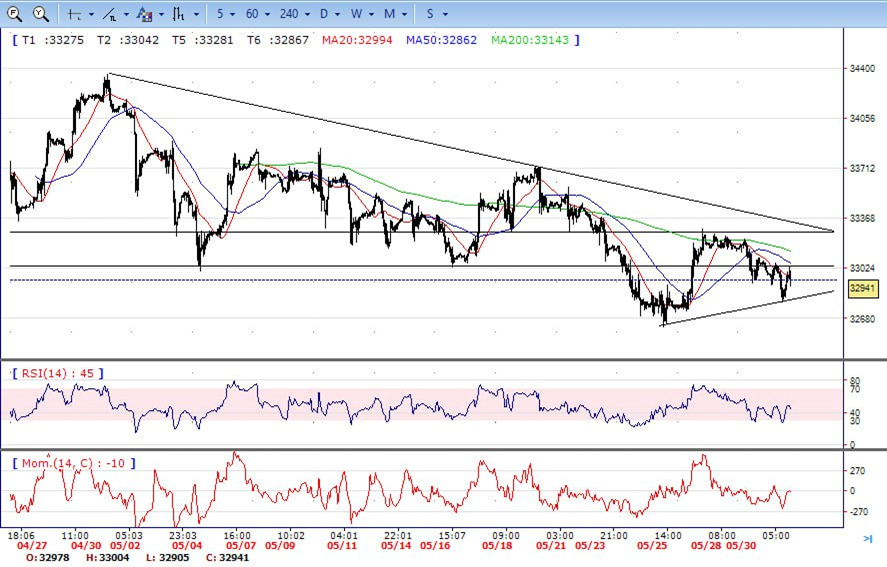
- DJI still under the sell pressure on Wednesday, traded from intraday high 33070 area to low 32800 level. It trimmed some losses and ended the day around 32950, below 20 and 50 SMA, suggests bearish strength. Meanwhile, 20 SMA started turning south and heading towards longer ones, suggests bears not exhausted yet. On upside, overcome 33300 may encourage bulls to challenge 33550, break above that level will open the gate to 33730.
- Technical indicators suggest the bearish movement. RSI stabilizes around 46, while the Momentum indicator stabilizes below the midline, suggests downward potentials. On downside, the immediately support is 32800, break below this level will open the gate for more decline to 32600 area.
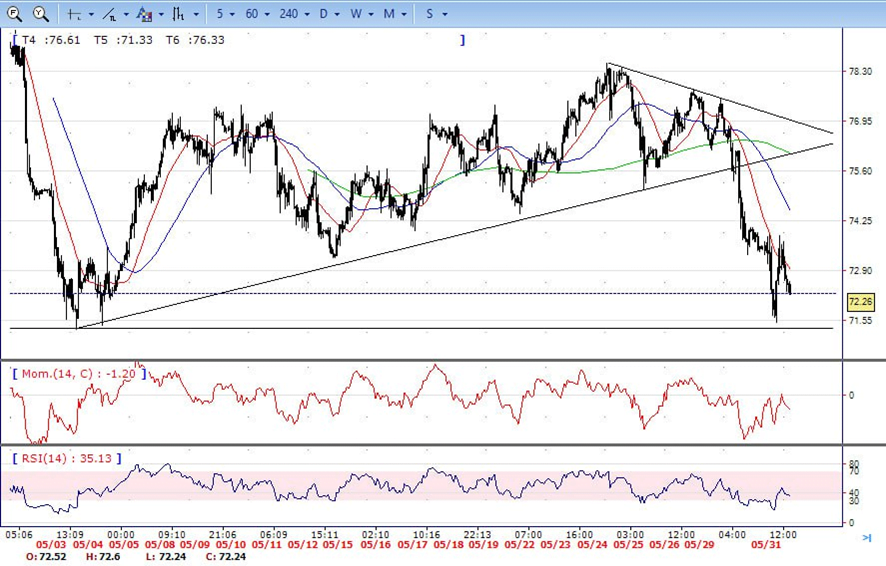
- Brent still under the strong sell pressure on Wednesday, traded from intraday high 73.80 area to low 71.50 level. It recovered modestly and ended the day around 72.20, down for the day and stabilized below 20 and 50 SMA, indicates bearish sign in the hourly chart. Meanwhile, the 20 SMA continued accelerating south and developing below longer ones, indicates bears not exhausted yet. On upside, overcome 74.00 may encourage bulls to challenge 75.20, break above that level will open the gate to 76.20.
- Technical indicators also suggest bearish movement, hovering below the midline. RSI stabilizes at 33, while the Momentum indicator stabilizes in negative territory, suggests downward potentials. On downside, the immediately support is 71.30, break below this level will open the gate for more decline to 70.00 area.