EUR/USD
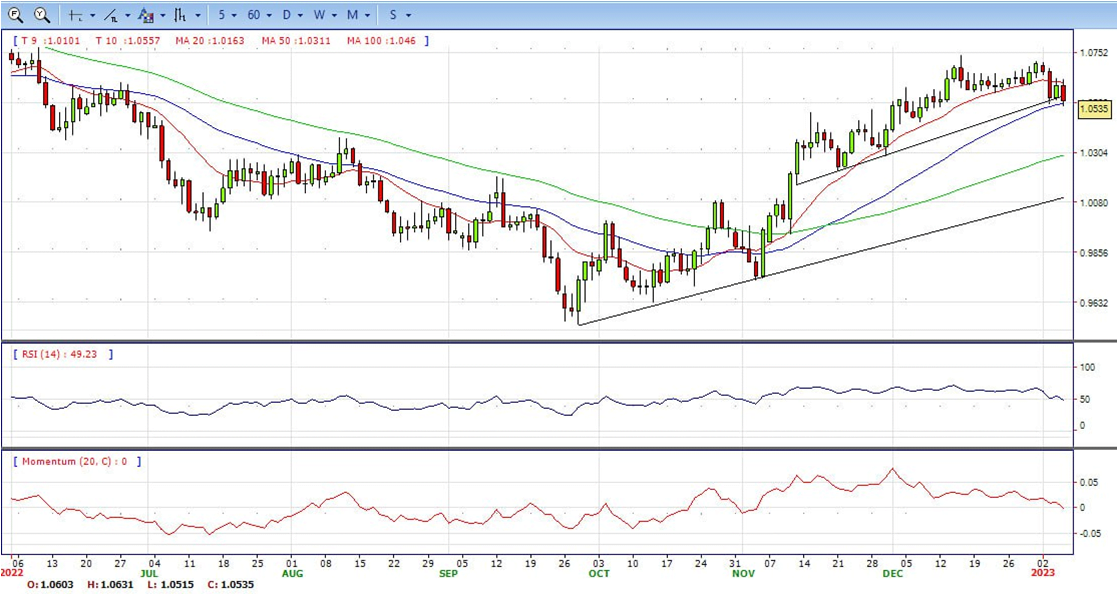
- The selling pressure in the Greenback now picks up further pace and drags EUR/USD back to the mid-1.0500s on Thursday, or daily lows. Further downside could retest 1.0520, EUR/USD quickly returned to the negative territory in response to the abrupt uptick in the Greenback, which approaches the key 105.00 hurdle when measured by the USD Index (DXY).
- The United States Challenger Job Cuts report showed that layoffs were down to 43.651K in December from 76.835K in the previous month. Additionally, the ADP survey on Employment Changed showed that the private sector created 235,000 new positions in the same month, much better than anticipated. Finally, Initial Jobless Claims declined to 204,000 in the last week of December. The upbeat figures hint at an upcoming solid December Nonfarm Payrolls report to be out this Friday. Also, the Euro Zone will publish fresh inflation data. The December Harmonized Index of Consumer Prices (HICP) is expected to have increased at an annual pace of 9.7%.
- The drop in the pair also falls in line with the uptick in US yields across the curve, while the German 10-year Bund yields also reverse part of the recent weakness. Earlier in the euro docket, Germany’s trade surplus widened to €10.8B in November (from €6.9B) and the Construction PMI improved marginally to 41.7 in December. In the broader Euroland, Producer Prices contracted 0.9% MoM in November and rose 27.1% YoY. In Italy, flash inflation figures saw the CPI at 11.6% in the year to December.
- Technical readings in the daily chart support the neutral to bearish stances. The RSI indicators hovering around 50. The Momentum indicator drop below the midline, indicating bearish potentials. On downside, the immediate support is 1.0470 and below this level will open the gate to 1.0400.
Open A Demo
CDO has wide range of tools, professional and friendly support for clients to achieve their financial markets trading goals. Open a live account now to enjoy this experience with virtual deposit.
GBP/USD
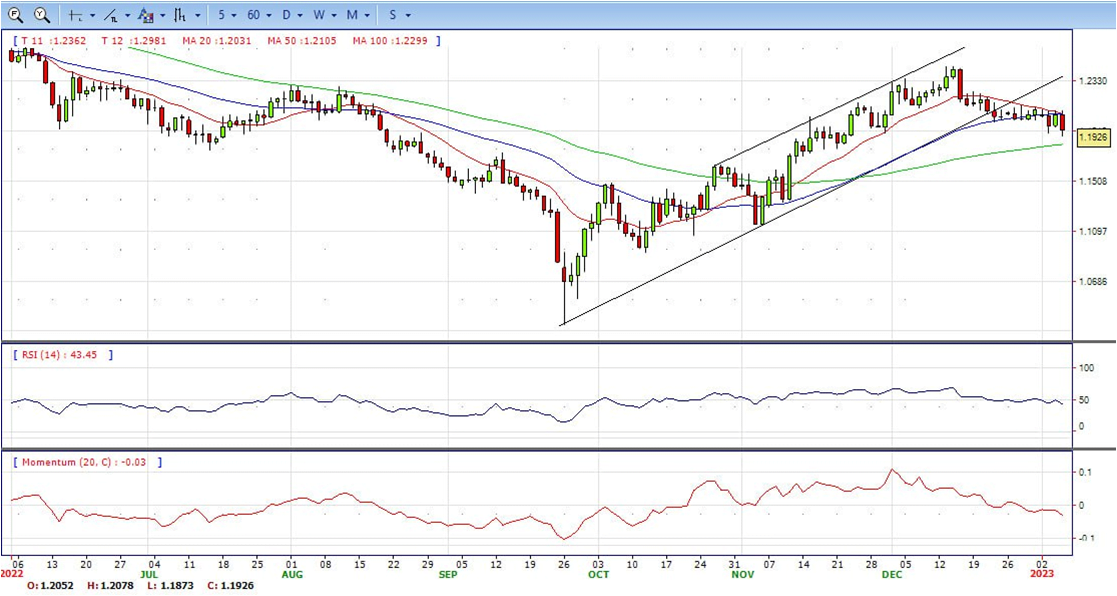
- The GBP/USD pair continues losing ground through the early North American session and weakens further below the 1.2000 psychological mark in reaction to the upbeat US ADP report.
- According to the data published by Automatic Data Processing (ADP), the US private sector employers added 235K jobs in December against expectations for a reading of 150K. This comes on the back of a hawkish assessment of the FOMC meeting minutes and provides a strong boost to the US Dollar, which, in turn, exerts downward pressure on the GBP/USD pair.
- Despite the easing of strict COVID-19 restrictions in China, concerns about a deeper global economic downturn continue to weigh on investors’ sentiment. This is evident from a fresh leg down in the US equity futures, which, in turn, is seen driving some haven flows towards the greenback and exerting downward pressure on the GBP/USD pair.
- From a technical perspective, the recent fall and acceptance below the 200-day SMA suggested that the strong recovery from an all-time low might have run out of steam already. This GBP/USD pair is seen flirting with support marked by the lower end of an ascending channel extending from late September, which if broken should pave the way for deeper losses
- Technical indicators developing below the midlines. RSI indicator is below 50, while the Momentum indicator continued in negative territory, suggesting bearish strength. On downside, the immediate support is 1.1870, unable to defend this level will resume the decline to 1.1770.

CDO TRADER
CDO TRADER, our cutting-edge trading platform, follows the technology from the forefront with new features added continuously. Moreover, CDO TRADER is now available for Android and iOS! So it allows you to trade on the go!
XAU/USD
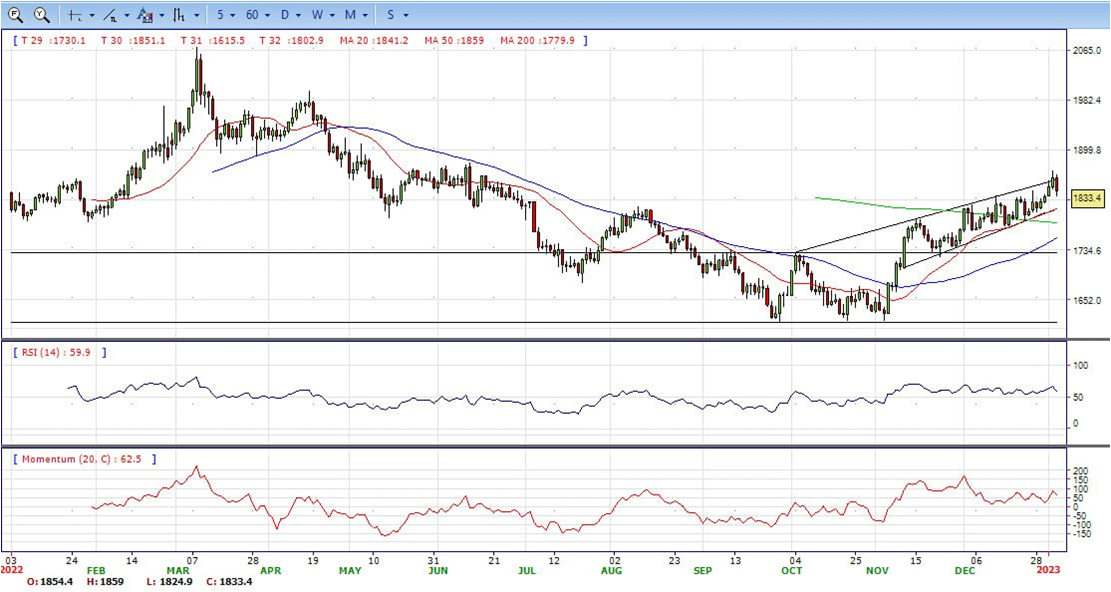
- Gold Prices are falling by more than 1% on Thursday, retreating from the highest level since mid-June on the back of a stronger US Dollar and surging Treasury bond yields. XAU/USD printed a fresh two-day low at $1,825/oz.
- The American Dollar aimed higher early Thursday, backed by the echoes of a hawkish Fed. It gained additional momentum ahead of Wall Street’s opening following the release of upbeat US employment-related figures.
- The United States Challenger Job Cuts report showed that layoffs were down to 43.651K in December from 76.835K in the previous month. Additionally, the ADP survey on Employment Changed showed that the private sector created 235,000 new positions in the same month, much better than anticipated. Finally, Initial Jobless Claims declined to 204,000 in the last week of December. The upbeat figures hint at an upcoming solid December Nonfarm Payrolls report to be out this Friday. Also, the Euro Zone will publish fresh inflation data. The December Harmonized Index of Consumer Prices (HICP) is expected to have increased at an annual pace of 9.7%
- XAU/USD looks vulnerable for the moment but losses seem limited while above the $1,825 area. The mentioned zone is a strong support that if broken should open the doors to another leg lower. On the upside, a recovery above $1,850 would change the intraday outlook to positive.
- From a technical perspective, the RSI indicator holds near the midline and stabilized around 55, still on a bullish strength. The Momentum indicator continued developing above the midline, suggests upside potentials. On downside, the immediate support is 1825, below this area may resume the decline to 1800.
MetaTrader 4
MT4 has user friendly interface that is providing simplicity and efficiency. The traders can perform trading strategies for different products like Forex and CFD. MetaTrader 4 has over 50 built-in indicators, also it’s the tool that predicts trends and defines the appropriate entry and exit points.

USD/JPY
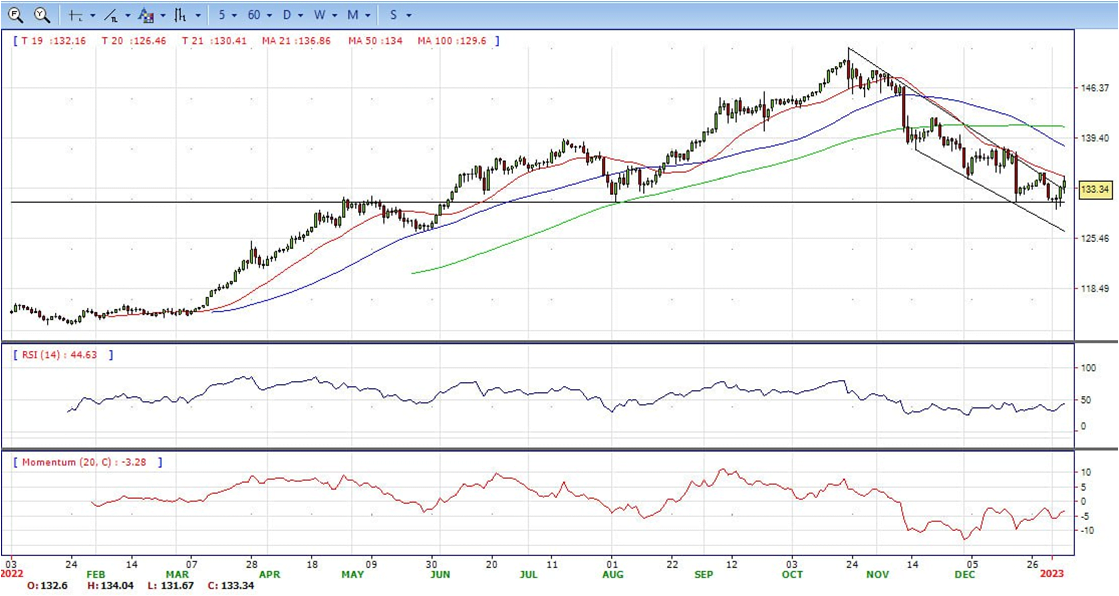
- The USD/JPY pair catches some bids during the early North American session and climbs to a one-week high in reaction to the upbeat US macro data. The pair is currently placed just above the mid-133.00s and looks to build on this week’s recovery move from its lowest level since June 2022.
- The US Dollar strengthens across the board following the release of the better-than-expected US ADP report, which, in turn, pushes the USD/JPY pair higher for the third successive day. In fact, the US private-sector employers added 235K jobs in December against consensus estimates for a reading of 150K. Adding to this, Initial Jobless Claims unexpectedly fell from 223K to 204K during the week ended December 30.
- This comes on the back of a hawkish assessment of the FOMC meeting minutes released on Wednesday and triggers a sharp intraday spike in the US Treasury bond yields. This, in turn, provides a goodish lift to the Greenback and acts as a tailwind for the USD/JPY pair. Apart from this, technical buying above the 133.00 mark could also be attributed to the latest leg-up witnessed over the past hour or so.
- The USD/JPY pair stabilized around 133.30 for settlement, up for the day and neutral in the daily chart. The price still hold below all main SMAs but breach of up trendline. On upside, overcome 134.50 may encourage bulls to challenge 136.00, break above that level will open the gate to 138.50.
- Technical indicators suggest the neutral strength, hovering above the midline. RSI stabilized around 50, while the Momentum indicator continued in negative territory, suggests neutral potentials. On downside, the immediately support is 131.5, break below this level will open the gate to 130 area.
DJI
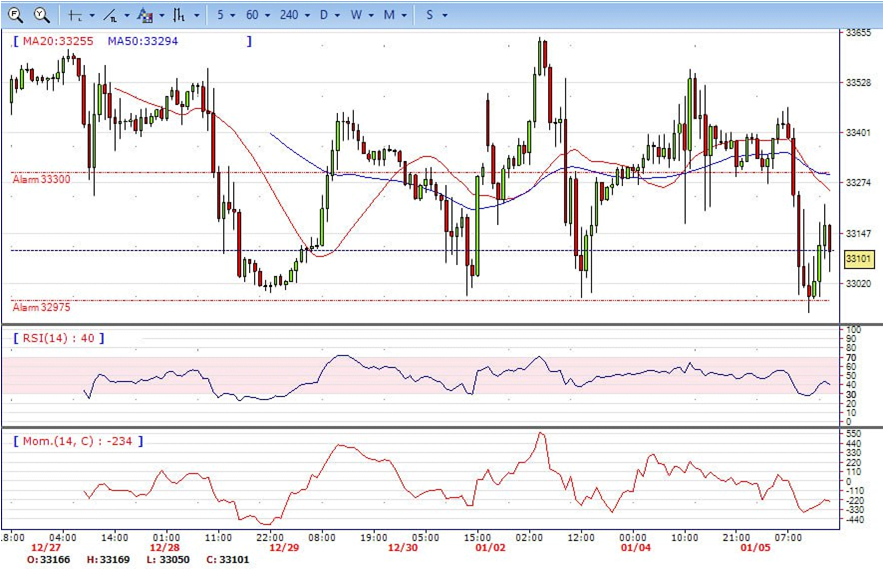
- DJI continued under sell pressure, hit intraday low 32944 area, then trimmed some losses and trading at around 33100 at the time of writing, down for the day and still neutral in the hourly chart. It stabilized below all main SMAs, suggests some bearish strength. Meanwhile, the 20 SMA continued accelerating south and heading towards longer ones, indicating bears not exhausted yet. On upside, overcome 33275 may encourage bulls to challenge 33470, break above that level will open the gate to 33600.
- Technical indicators suggest the bearish movement, developing below the midline. RSI stabilized around 35, while the Momentum indicator hovering bellow the midline, suggests downward potentials. On downside, the immediately support is 32950, break below this level will open the gate for more decline to 32700 area.
BRENT
- The Brent is still under the sell pressure, tumbled to a fresh low of 77.60 on early US session. It recovered modestly and settled around 79.00 area at the time of writing, down for the day and bearish in the hourly chart. The price stabilized around 20 SMA but below 50MA, suggests some bearish strength. The price still maintains the downward slope, the cross between 20 and 50MA, indicating bears not exhausted yet. On upside, overcome 80.00 may encourage bulls to challenge 82.00, break above that level will open the gate to 84.00.
- Technical indicators suggest the bearish movement, hovering below the midline. RSI stabilized around 38, while the Momentum index continued developing below the midline, suggests downward potentials. On downside, the immediately support is 77.60, break below this level will open the gate for more decline to 75.65 area.

Contact Us
Please, fill the form to get an assistance.


