30/11/2022 Daily Reports
- EUR/USD alternates gains with losses in the low-1.0300s following another failed attempt to retake the 1.0400 barrier earlier on Tuesday.
- The euro was initially buoyed earlier on Tuesday due to the hopes of a potential easing in China’s strict pandemic restrictions following an unprecedented episode of unrest in the country. Consequently, DXY fell 0.4% to 106.19. Nevertheless, two economic indicators sauntered through the door on Tuesday, missing expectations, and potentially weighing on risk sentiment.
- Meanwhile, flash euro zone inflation figures for November are due on Wednesday, with economists polled by Reuters expecting inflation to come in at 10.4% year-on-year. The key event, however, for Wednesday will be in the comments from Fed Chair Jerome Powell. These will be scrutinised for new signals on further tightening. The Fed is widely expected to hike rates by an additional 50 basis points when it meets on Dec. 13-14. WIRP suggests that is fully priced in, with around 15% odds of a larger 75 bp move. The swaps market is still pricing in a peak policy rate of 5.0%, with small odds of a 5.25% peak.
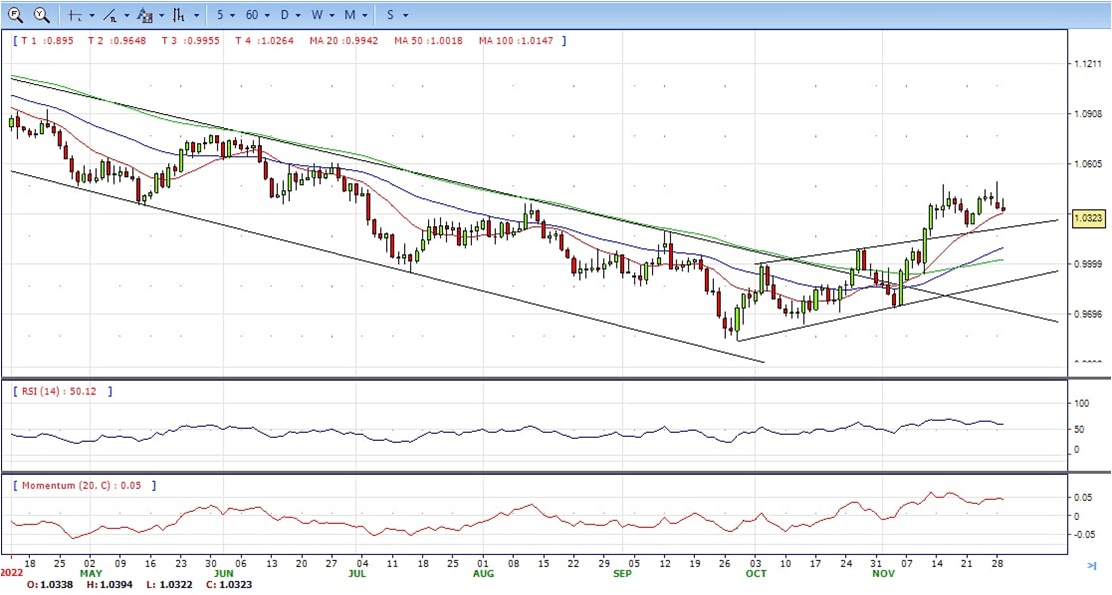
- The EUR/USD pair is trading near the 1.0330, down for the day with bullish stance in daily chart. The pair stabilized above 20 and 50 SMA, indicates bullish strength. Meanwhile, the 20 SMA continued accelerating north and developing above longer ones, suggests bulls not exhausted yet. On upside, the immediate resistance is 1.0400, break above this level will extend the advance to 1.0500.
- Technical readings in the daily chart support the bullish stances. The RSI indicators hovering above the midline and stabilized around 59. The Momentum indicator stabilized above the midline, indicating upward potentials. On downside, the immediate support is 1.0300 and below this level will open the gate to 1.0200.
- GBP/USD remains on the backfoot while gathering bearish momentum and leaning against a bearish structure below the psychological 1.2000 level. The short-term dynamic support was broken in prior sessions as fears of a lengthy UK recession are still seen weighing on sentiment.
- Data-wise, the US economic calendar featured the Conference Board Consumer Confidence, which decreased to 100.2 to a 4-month low. Lynn Franco, senior director of economic indicators at the Conference Board, said, “The combination of inflation and interest rate hikes will continue to pose challenges to confidence and economic growth into early 2023.”
- Aside from this, the Covid-19 outbreak in China has not escalated as initially thought, as global equities remained mixed but tilted to the upside. According to the Wall Street Journal, the National Health Commission urged local governments to avoid unnecessary and lengthy lockdowns. Chinese health officials said the Omicron variant is less severe while committed to vaccinating elder people aged 80 or older.
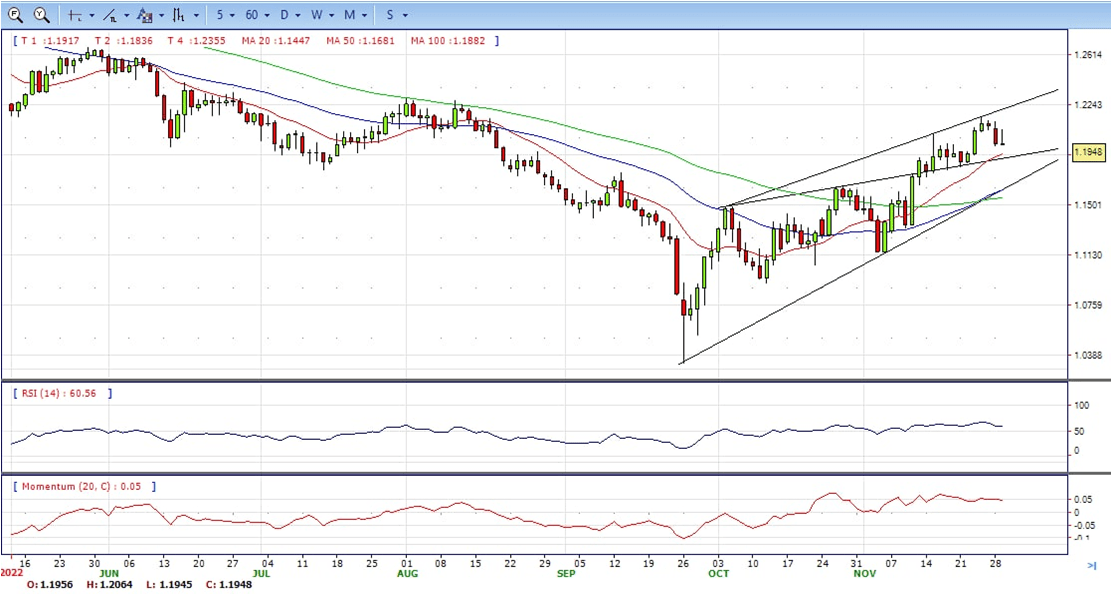
- The GBP/USD offers bullish stance in daily chart. Cable still stabilized above all main SMAs, indicating bullish strength in short term. Meanwhile, the 20 SMA continued accelerating north and developing above longer ones, suggests bulls not exhausted yet. On upside, The immediate resistance is 1.2060 with a break above it exposing to 1.2150.
- Technical readings in the daily chart support the bullish stances. RSI indicator stabilized around 59, while the Momentum indicator stabilized above the midline, suggesting upward potentials. On downside, the immediate support is 1.1935, unable to defend this level will resume the decline to 1.1850.


- Gold price regains positive traction on Tuesday and reverses the previous day’s retracement slide from more than a one-week high. The XAU/USD maintains its bid tone heading into the North American session and trades near the top end of its daily range, around the $1,750 region.
- The US Dollar fails to capitalize on the overnight bounce from a technically significant 200-day Simple Moving Average amid expectations for a less aggressive policy tightening by the Federal Reserve. The emergence of fresh selling around the Greenback turns out to be a key factor driving flows towards the US Dollar-denominated Gold price.
- The minutes of the November FOMC meeting released last week cemented bets for a relatively smaller 50 bps rate hike in December. This is reinforced by sliding US Treasury bond yields. In fact, the yield on the benchmark 10-year US government bond languishes near a two-month low and continues to weigh on the US Dollar.
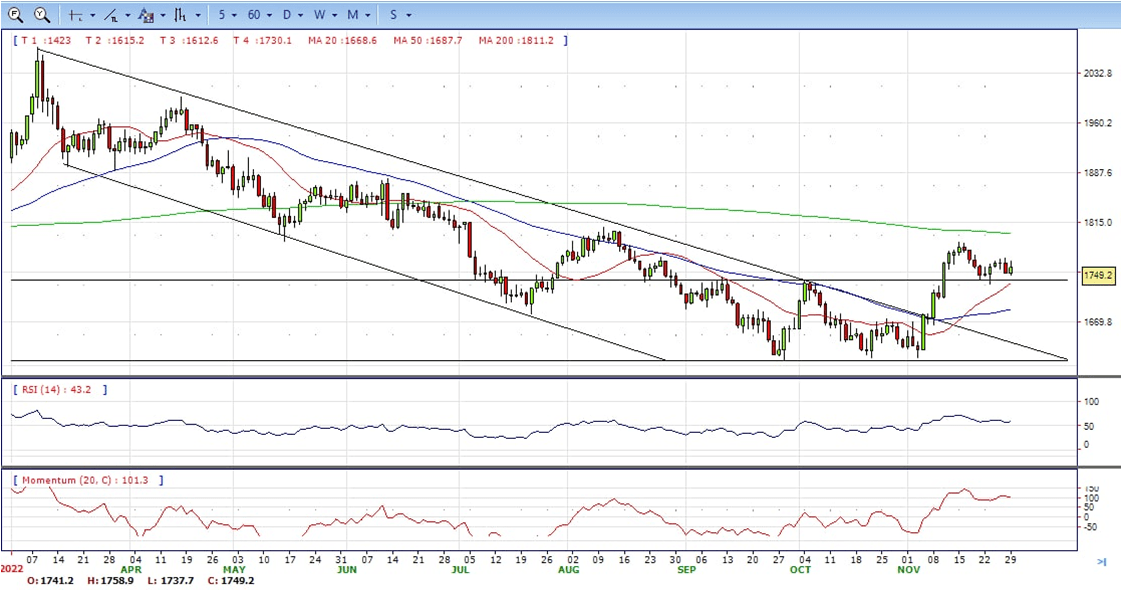
- Gold price stabilized around 1749, bullish in the daily chart. The gold price still stabilized above 20 and 50 SMA, suggesting bullish strength. Meanwhile, the 20 SMA continued accelerating north and developing above longer ones, indicating bulls not exhausted yet. On upside, the immediate resistance is 1787, break above this level will open the gate to extend the advance to 1800 area.
- From a technical perspective, the RSI indicator hold above the midline and stabilized around 59, suggesting bullish strength. The Momentum indicator stabilized above the midline, suggests upward potentials. On downside, the immediate support is 1730, below this area may resume the decline to 1700.


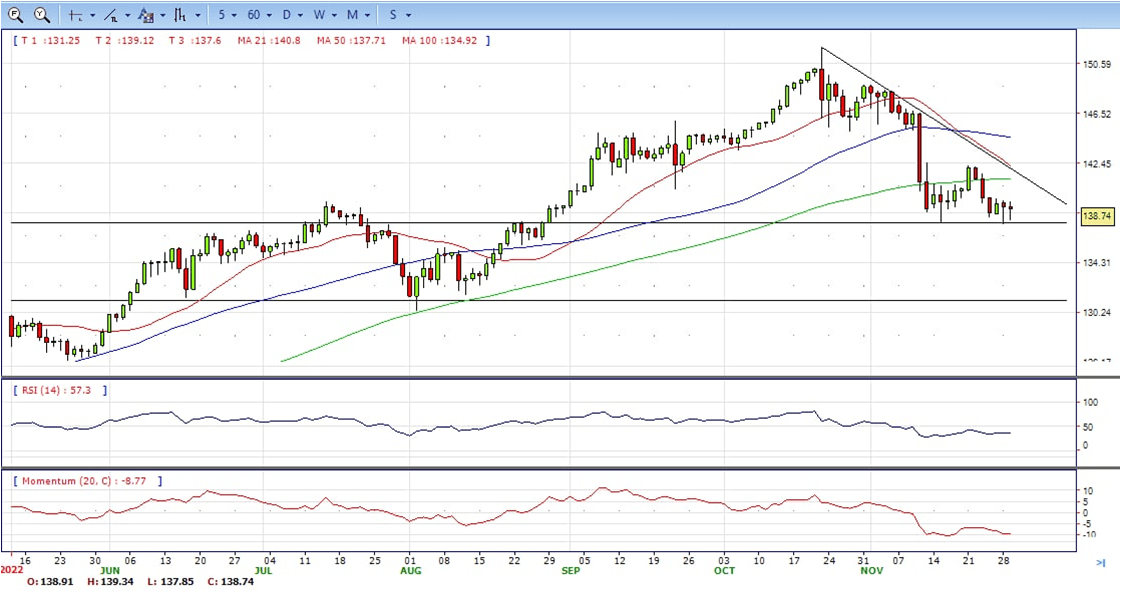
- The US Dollar falls against the Japanese Yen amid a risk-off sentiment as shown by US equities trading in the red, while US Treasury yields rise and the USD remains on the back foot. At the time of writing, the USD/JPY is trading at 138.70 after hitting a daily high of 139.35.
- The overnight US Dollar bounce from a technically significant 200-day Simple Moving Average (SMA) fades rather quickly amid expectations that the Fed will slow the pace of its policy tightening. In fact, the markets now expect the US central bank to deliver a relatively smaller 50 bps rate hike in December, which led to the recent sharp decline in the US Treasury bond yields. This, in turn, continues to weigh on the USD and is seen as a key factor exerting downward pressure on the USD/JPY pair.
- The Japanese Yen, on the other hand, draws support from speculations that the Bank of Japan (BoJ) will exit its ultra-lose policy stance. In fact, a Reuters poll indicated on Tuesday that more than 90% of economists expect that BoJ’s next policy move will be to unwind its massive monetary easing. The change, however, is not anticipated before the latter half of 2023. This, along with a positive risk tone, could undermine the safe-haven JPY and lend support to the USD/JPY pair.
- The USD/JPY pair stabilized around 138.70, down for the day and bearish in the daily chart. The price still maintains the downward slope and develops below all main SMAs, suggests bearish strength in short term. Meanwhile, 20 SMA continued accelerating south and heading towards longer ones, indicating bears not exhausted. On upside, overcome 139.70 may encourage bulls to challenge 141.00, break above that level will open the gate to 141.60.
- Technical indicators suggest the bearish strength. RSI stabilized around 37, while the Momentum indicator continued developing below the midline, suggests downward potentials. On downside, the immediate support is 137.50, break below this level will open the gate to 136.00 area.
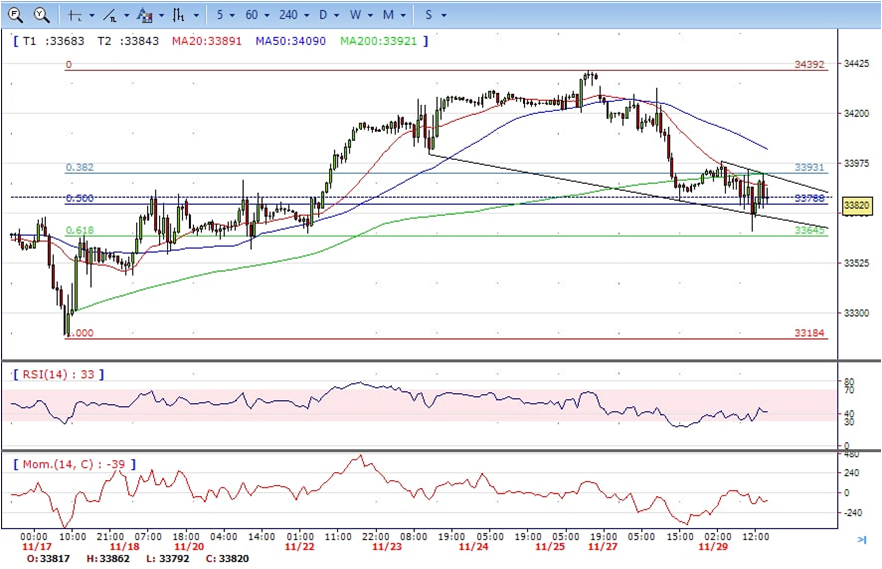
- DJI still under the sell pressure on Tuesday. The price tumbled from intraday high 33980 to low 33670 and ends Tuesday around 33850, down for the day and bearish in the hourly chart. The price stabilized below all main SMAs, suggests bearish strength. Meanwhile, 20 SMA continued accelerating south and developing far below 50 SMA, suggests bears not exhausted yet. On upside, overcome 34000 may encourage bulls to challenge 34200, break above this level will open the gate to 34400.
- Technical indicators suggest the bearish strength. RSI stabilized around 43, while the Momentum indicator stabilized below the midline, suggests downward potentials. On downside, the immediate support is 33650, break below this level will open the gate for more decline to 33400 area.
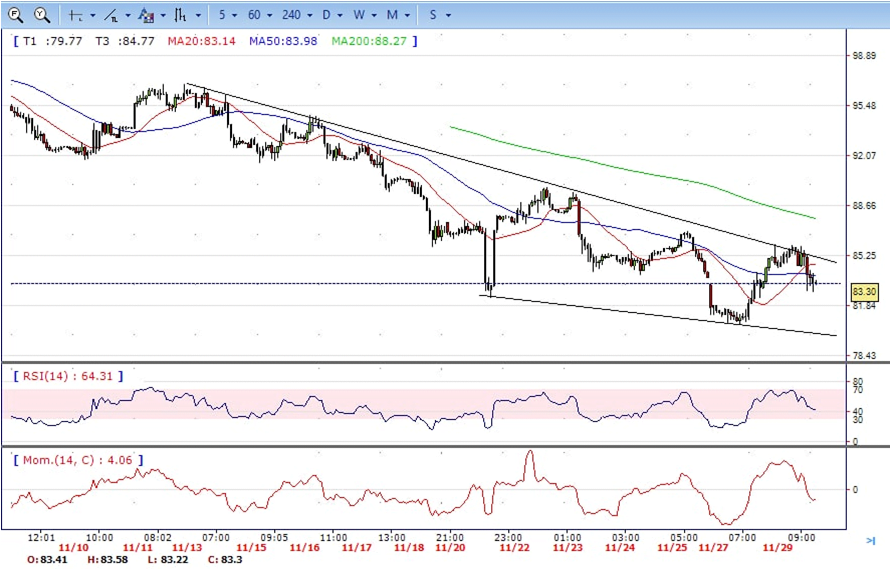
- Brent climbed to intraday high 86.00 area, but failed to hold the gains and back to 83.20 level to ended Wednesday, up for the day and bearish in the hourly chart. The price stabilized below 20 and 50 SMAs, suggests bearish strength in short term. Meanwhile, the 20 and 50 SMA continued developing far below 200 SMA despite they started turning flat, indicating bearish bias in the long term. On upside, overcome 86.00 may encourage bulls to challenge 87.00, break above this level will open the gate to 90.00.
- Technical indicators suggest the bearish movement, hovering below the midline. RSI stabilized at around 43, while the Momentum indicator stabilized below the midline, suggests downward potentials. On downside, the immediate support is 82.30, break below this level will open the gate for more decline to 80.50 area.