27/12/2022 Daily Reports
- The EUR/USD pair holds ccomfortably above the 1.0600 round-figure mark through the early North American session and moves little in reaction to the mixed US macro data. It ended Friday near 1.0620, still bullish in the daily chart.
- The US Bureau of Economic Analysis reported that the PCE Price Index rose a modest 0.1% in November, missing expectations for a reading of 0.3%. The slight disappointment, however, was offset by an upward revision of the previous month’s reading to 0.4% and the higher-than-anticipated yearly rate of 5.5%.
- Additional details showed that the Core PCE Price Index climbed by 0.2% MoM in November and decelerated to a 4.7% YoY rate from 5.0% previous. Separately, the US Durable Goods Orders missed consensus estimates by a big margin and does little to impress the US Dollar bulls or provide any impetus to the EUR/USD pair.
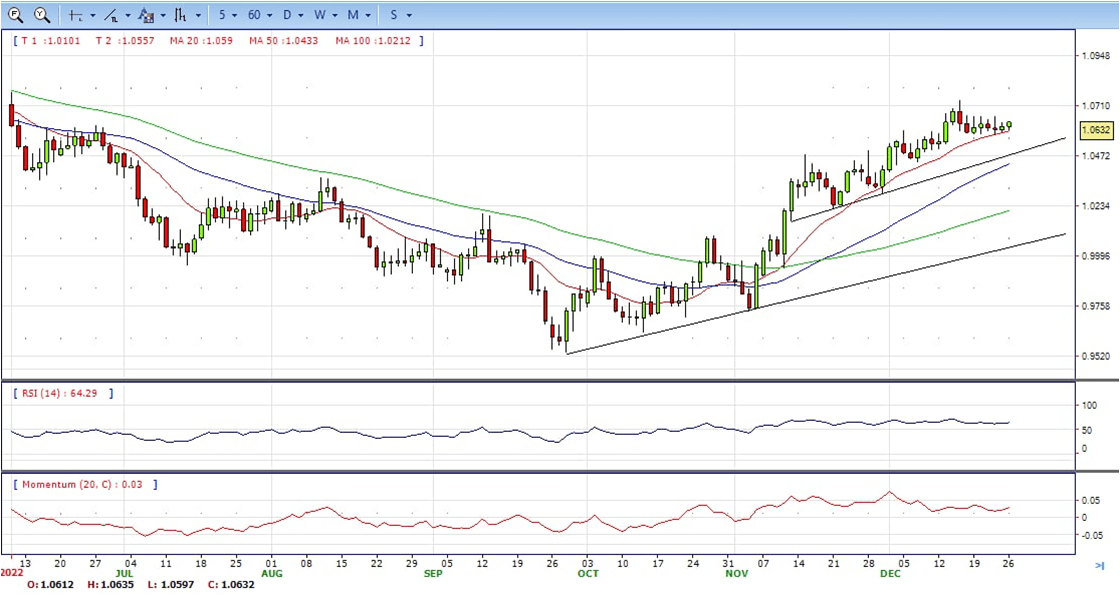
- The EUR/USD pair is trading near the 1.0620, up for the day with bullish stance in daily chart. The pair stabilized above 20 and 50 SMA, indicates bullish strength. Meanwhile, the 20 SMA continued accelerating north and developing far above longer ones, suggests bulls not exhausted yet. On upside, the immediate resistance is 1.0660, break above this level will extend the advance to 1.0740.
- Technical readings in the daily chart support the bullish stances. The RSI indicators hovering above the midline and stabilized around 65. The Momentum indicator stabilized above the midline, indicating upward potentials. On downside, the immediate support is 1.0570 and below this level will open the gate to 1.0500.
- The GBP/USD pair gains some positive traction on the last day of the week and snaps a two-day losing streak to over a three-week low touched on Thursday. Spot prices stick to intraday gains, around the 1.2055-1.2060 area, neutral in the daily chart.
- The US Dollar comes under some renewed selling pressure and turns out to be a key factor pushing the GBP/USD pair higher. A modest recovery in the equity markets is seen undermining the safe-haven buck, though looming recession risks could help limit the downside. Apart from this, speculations that the Fed will stick to its policy-tightening cycle support prospects for the emergence of some dip-buying around the USD.
- Worries about the economic headwinds stemming from a surge in new COVID-19 cases in China, along with geopolitical risk, might keep a lid on any optimism in the markets. In fact, Russia said on Wednesday that the continued arms supplies by Western allies to Ukraine would lead to a deepening of the ongoing conflict. Furthermore, North Korea reportedly fired a ballistic missile towards the sea off its east coast on Friday.
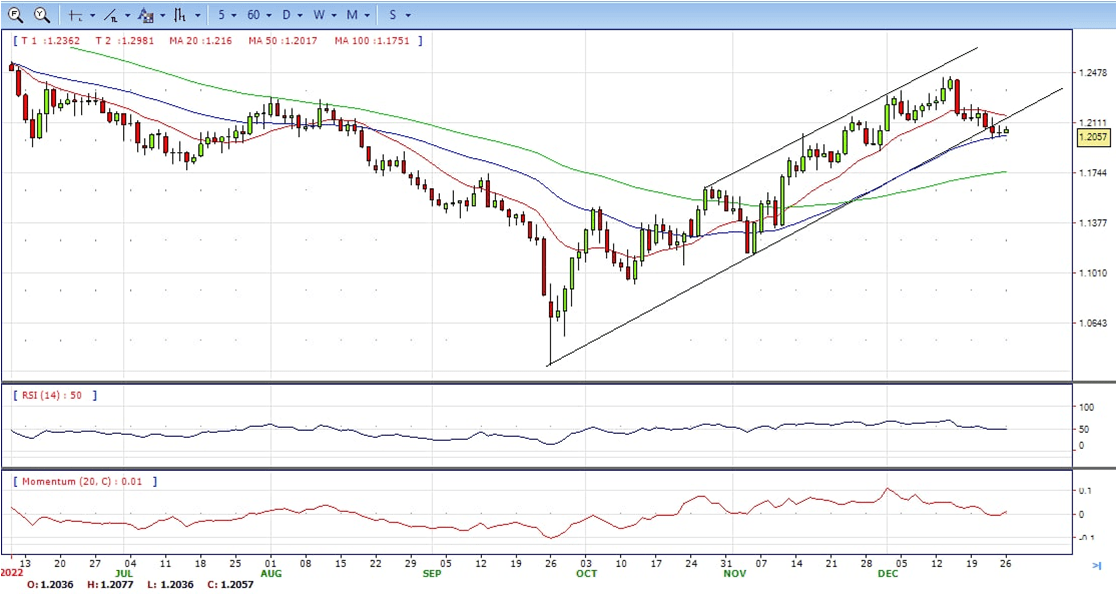
- The GBP/USD offers neutral to bearish stance in daily chart. Cable stabilized between 20 and 50 SMA, indicating neutral strength in short term. However, the 20 SMA started turning south and heading towards 50 SMA, suggests bears not exhausted yet. On upside, The immediate resistance is 1.2150 with a break above it exposing to 1.2250.
- Technical readings in the daily chart support the neutral stances. RSI indicator stabilized around 50, while the Momentum indicator stabilized near the midline, suggesting directionless potentials. On downside, the immediate support is 1.1990, unable to defend this level will resume the decline to 1.1900.


- Gold price remains mildly bid as bears take a breather after a two-day downtrend. Even so, mixed catalysts challenge the metal buyers in consolidation the biggest daily fall in over a week. It ended Friday at around 1797, still bullish in the daily chart.
- That said, the quote’s latest gains, or ability to stop the bearish move, could be linked to the news suggesting optimism over China’s pro-growth policies as the People’s Bank of China marked the biggest weekly cash injection in two months. The same joins the chatters surrounding Evergrande’s nearness to an offshore debt restructuring plan to underpin the firmer sentiment.
- However, recently increasing hawkish Fed bets, especially after Thursday’s upbeat US data, join a rally in Shanghai’s hospitalization and challenges to China’s medical system, due to the latest easing of the Zero-Covid policy, to probe the risk-on mood.
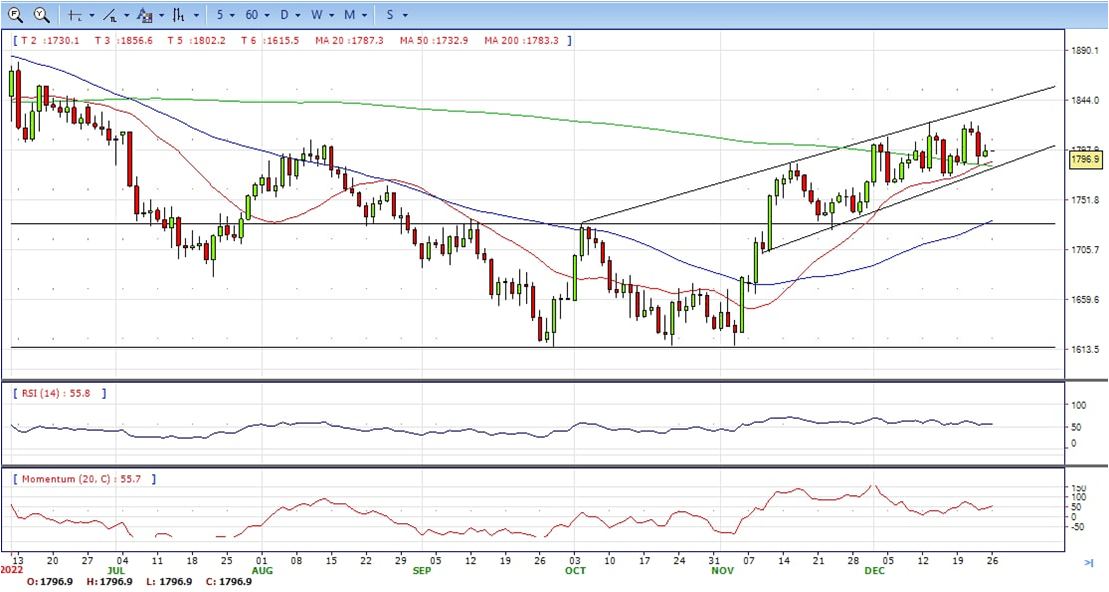
- Gold price stabilized around 1797, up for the day and bullish in the daily chart. The gold price still stabilized above 20 and 50 SMA, suggesting bullish strength in short term. Meanwhile, the 20 SMA continued accelerating north and developing above 50 SMA, indicating bulls not exhausted yet. On upside, the immediate resistance is 1825, break above this level will open the gate for more advance to 1848 area.
- From a technical perspective, the RSI indicator hold above the midline and stabilized around 56, suggesting bullish strength. The Momentum indicator stabilized above the midline, suggests upward potentials. On downside, the immediate support is 1784, below this area may resume the decline to 1784.


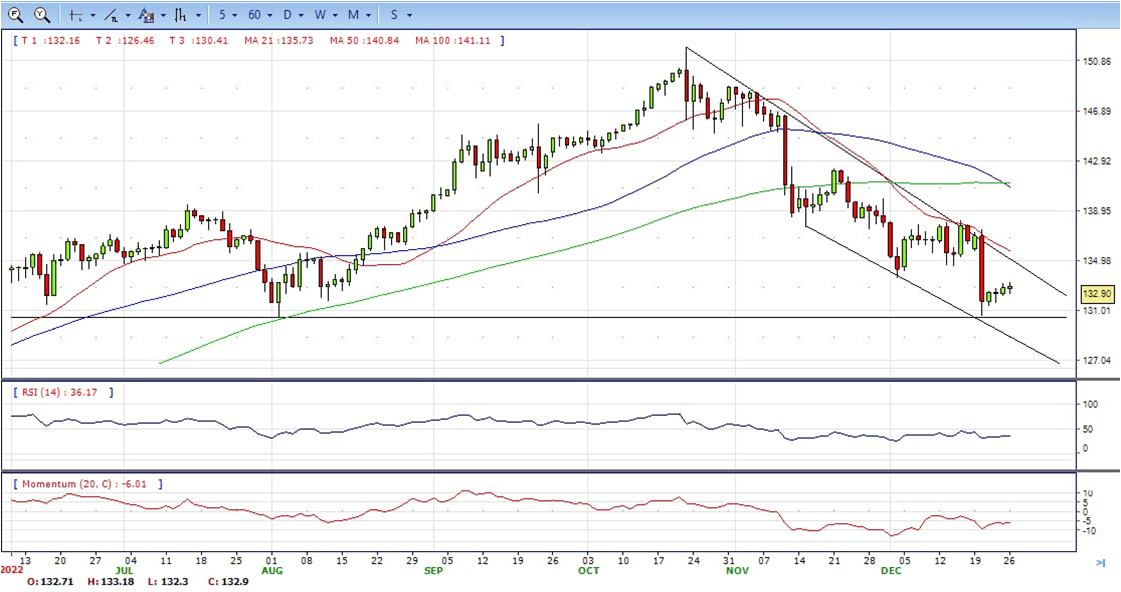
- The USD/JPY broke above 132.80 and climbed to 133.15, reaching the highest level since Tuesday. US Treasury yields rose following several economic reports from the US and weighed on the Japanese Yen, still bearish in the daily chart.
- The key report from the US was the Core Personal Consumption Expenditure Price Index which rose 0.2% in November, in line with expectations, and 4.7% from a year ago, a decline from the 5% in October. The inflation indicators are closely watched by the Federal Reserve.
- Durable Goods Orders fell more than expected by 2.6%. The Michigan Consumer Sentiment Index came in at 59.7 in December, above the 59.1 of the preliminary estimate. New Home Sales surprised with a 5.8% increase in November to an annual rate of 640K, above the 600K of market consensus.
- The USD/JPY pair stabilized around 132.90, up for the day and bearish in the daily chart. The price maintains the downward slope and develops below all main SMAs, suggests bearish strength in short term. Meanwhile, 20 SMA continued accelerating south and developing below longer ones, indicating bears not exhausted. On upside, overcome 133.20 may encourage bulls to challenge 133.70, break above that level will open the gate to 134.60.
- Technical indicators suggest the bearish strength. RSI stabilized around 36, while the Momentum indicator continued developing below the midline, suggests downward potentials. On downside, the immediate support is 132.00, break below this level will open the gate to 131.50 area.
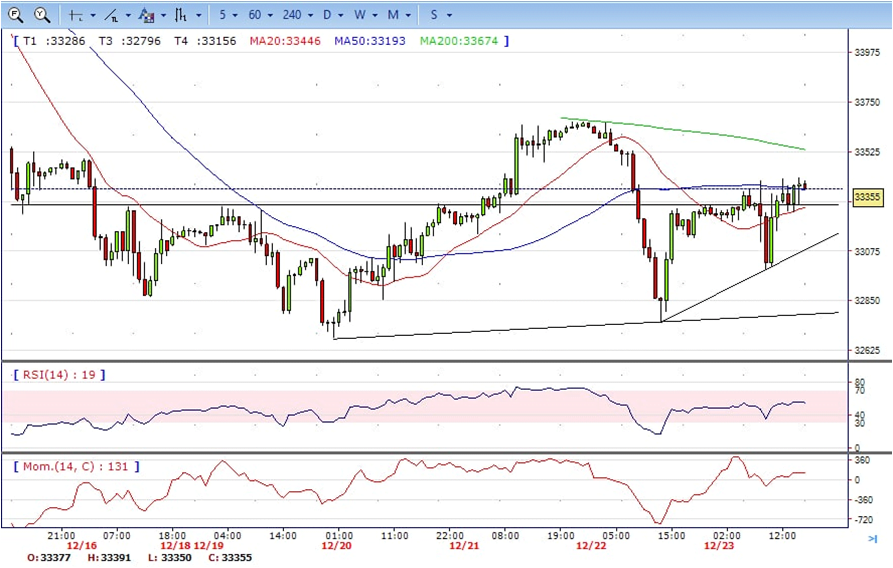
- DJI continued the advance, climbed from intraday low 32988 to high 33410 area. It retreated modestly and ended Friday at 33350, up for the day and bullish in the daily chart. The price stabilized above 20 and 50 SMA, suggests bullish strength in short term. Meanwhile, 20 SMA continued accelerating north and heading towards 50 SMA , suggests bulls not exhausted yet. On upside, overcome 33410 may encourage bulls to challenge 33650, break above this level will open the gate to 34000.
- Technical indicators suggests the bullish strength. RSI stabilized at around 54, while the Momentum indicator stabilized in positive territory, suggests upward potentials. On downside, the immediate support is 33130, break below this level will open the gate for more decline to 32980 area.
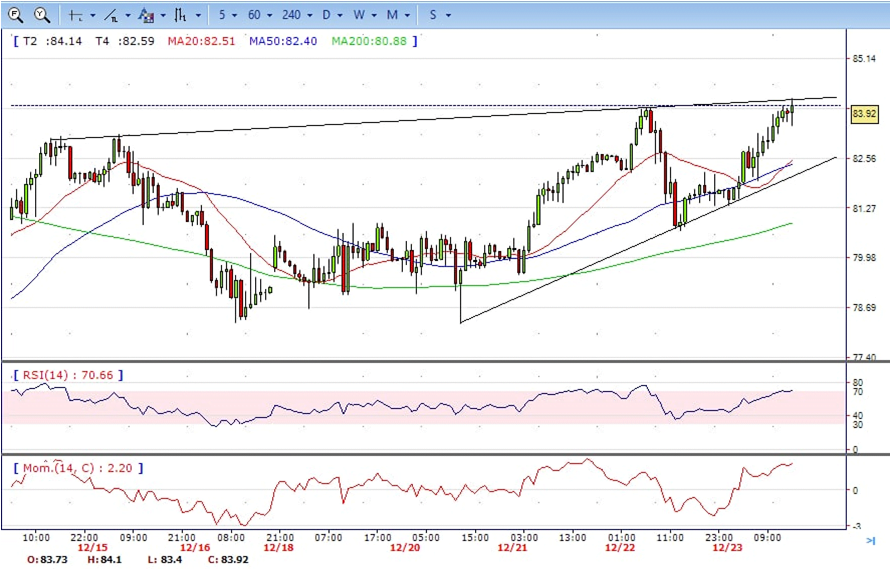
- Brent continued the advance on Friday, climbed to intraday high 84.10. It then retreated modestly and ended Friday at around 83.90, up for the day and bullish in the hourly chart. The price stabilized above 20 and 50 SMA, suggests bullish strength in short term. Meanwhile, the 20 SMA continued accelerating north and heading towards 50 SMA, indicating bulls not exhausted yet. On upside, overcome 84.10 may encourage bulls to challenge 86.00, break above this level will open the gate to 88.50.
- Technical indicators suggest the bullish movement, hovering above the midline. RSI stabilized at around 70, while the Momentum indicator stabilized in positive territory, suggests upward potentials. On downside, the immediate support is 82.00, break below this level will open the gate for more decline to 80.70 area.