27/10/2022 Daily Reports
- The euro is performing a surprising recovery after having appreciated more than 3% on a four-day rally. The common currency has stretched higher on Wednesday’s US session, breaching the previous session top at 1.0050 to reach 1.0085.
- The US dollar has been on the defensive over the last sessions weighed by market expectations of a certain softening on the Federal Reserve’s tightening path. A batch of downbeat US indicators has revived concerns that escalating interest rates are dampening growth.
- A news report by the Wall Street Journal suggesting that Fed officials might be discussing how to communicate lower rate hikes in the months ahead has given further backing to that thesis. This new scenario is weighing on the USD, which has surged about 20% this year, buoyed by the Fed’s hawkish stance.
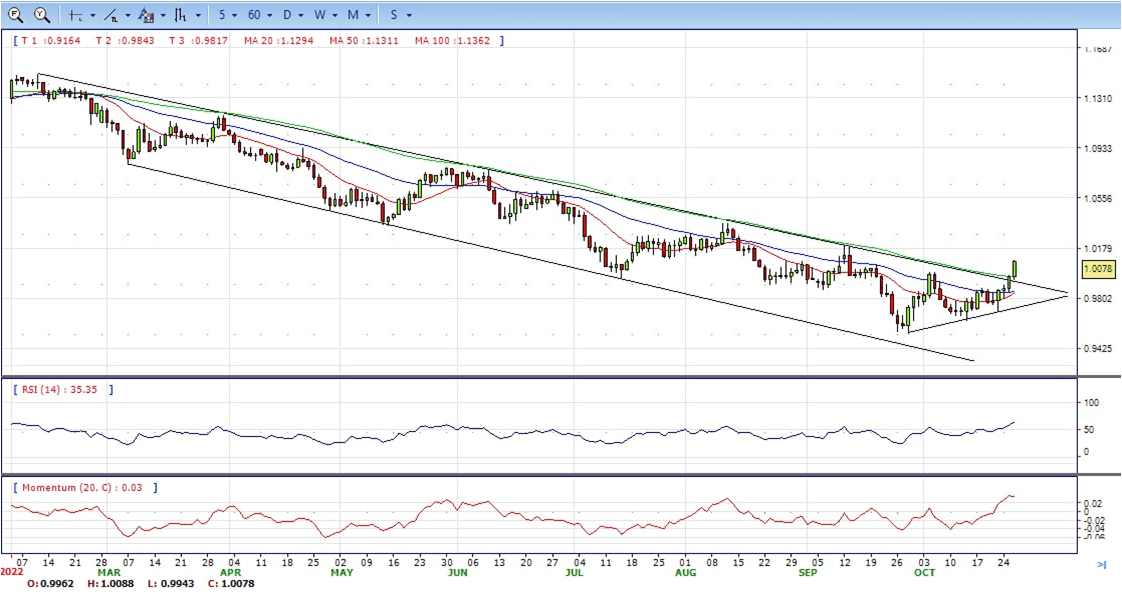
- The EUR/USD pair is trading near the 1.0080, up for the day with the bullish stance in daily chart. The pair stabilized above all main SMAs and stayed firmly above the long-term bearish channel, indicates bullish strength. Meanwhile, the 20 SMA started turning north and heading towards longer ones, suggests bulls not exhausted yet. On upside, the immediate resistance is 1.0100, break above this level will extend the advance to 1.0200.
- Technical readings in the daily chart support the bullish stances. The RSI indicators hovering above the midlines and stabilized around 65. The Momentum indicator stabilized in the positive territory, indicating upward potentials. On downside, the immediate support is 1.0000 and below this level will open the gate to 0.9900.
- The Pound Sterling extended its rally against the US Dollar for two consecutive days, above its opening price by more than 1%, on news that the UK new Prime Minister Rishi Sunak may delay the announcement of a fiscal plan on October 31, to mid-November. At the time of writing, the GBP/USD is trading at 1.1620.
- Sentiment remains positive, with Wall Street trading in the green. US economic data revealed by the US Commerce Department that home sales dropped at a 10.9% MoM pace in September, while August’s previous figures of 685K units were downward revised to 677K, signaling that the Federal Reserve aggression continues to dampen the housing market.
- Aside from this, Fed officials, in the blackout period ahead of the Federal Reserve Open Market Committee (FOMC) meeting in November, GBP/USD traders could shed some light on US economic data. On Thursday, the US calendar will feature the preliminary reading of the Gross Domestic Product (GDP) for Q3, which is expected at 2.4%. Of note, the last report of the Atlanta GDPNow estimates for Q3 GDP an increase of 2.9%.
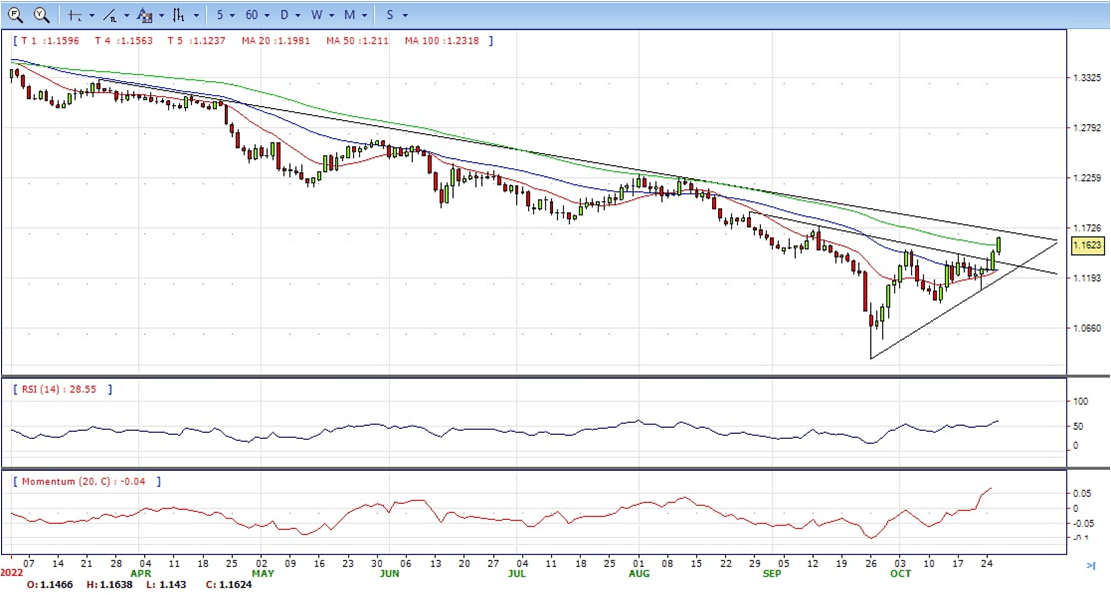
- The GBP/USD offers bullish stance in daily chart. Cable now is stabilizing above all main SMAs, indicating bullish strength in short term. Meanwhile, the 20 SMA started turning north and heading towards longer ones, suggests bulls not exhausted yet. On upside, The immediate resistance is 1.1700 with a break above it exposing to 1.1900.
- Technical readings in the daily chart support the bullish stances. RSI indicator stabilized around 60, while the Momentum indicator stabilized above the midline, suggesting upward potentials. On downside, the immediate support is 1.1500, unable to defend this level will resume the decline to 1.1350.


- The gold price is higher by some 0.70% on the day as the US dollar continues to bleed out in a risk-on environment. At the time of writing, XAU/USD is trading at $1,665 having travelled between a low of $1,649.70 the low and $1,674.90 the high.
- In fact, the USD Index, which measures the greenback’s performance against a basket of currencies, hits a one-month low amid diminishing odds for a more aggressive policy tightening by the Fed. The dismal US macro data released on Tuesday pointed to deteriorating growth in the world’s largest economy and might force the US central bank to soften its hawkish stance. Investors now anticipate a potential slowdown in the pace of the Fed’s rate-hiking cycle.
- The Fed, however, is still expected to continue to raise interest rates in the near future to combat stubbornly high inflation. Furthermore, other major central banks – the European Central Bank and the Bank of England- are also expected to deliver a jumbo rate hike at the upcoming policy meetings. This, in turn, might hold back traders from placing aggressive bullish bets around gold. Apart from this, signs of stability in the financial markets might further contribute to capping the safe-haven XAU/USD, at least for the time being.
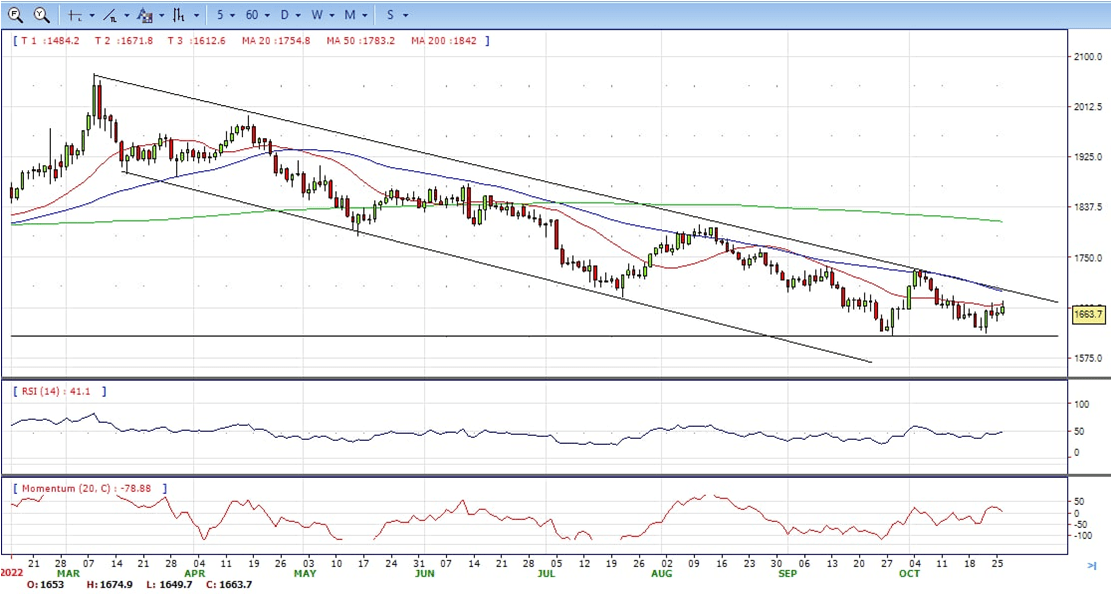
- Gold price stabilized around 1664, up for the day and neutral to bearish in the daily chart. The gold price stabilized below 20 and 50 SMA, suggesting bearish strength. Meanwhile, the 20 SMA continued developing far below longer ones despite it started turning flat, indicating bears not exhausted yet. On upside, the immediate resistance is 1675, break above this level will open the gate to extend the advance to 1686 area.
- From a technical perspective, the RSI indicator hold below the midline and stabilized around 50, suggesting neutral strength. The Momentum indicator struggled above the midline, suggests upward potentials. On downside, the immediate support is 1639, below this area may resume the decline to 1614.


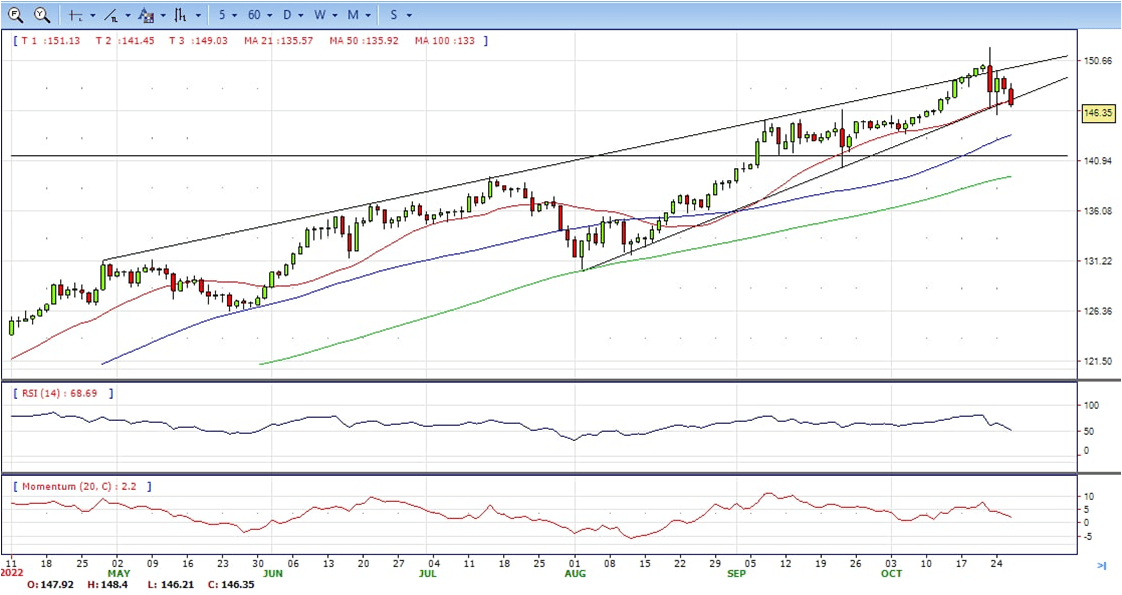
- The US dollar depreciated for the second consecutive day on Wednesday, breaking below 147.00 to reach levels right above 146.00, the area where the pair bottomed after the suspected BoJ interventions.
- The market is still pricing a 75 basis point hike next week, but the odds for December have been downgraded to a 0.50% rate hike. The mounting evidence that the aggressive tightening cycle is starting to bite into economic growth is adding pressure on the central bank to soften the monetary normalization plan.
- US Treasury bonds retreated further on Wednesday. The 10-year yield has reached the 4.00% area, from 4.25% at the beginning of the week, which added negative pressure on the US dollar.
- The USD/JPY pair stabilized around 146.40, down for the day and neutral to bullish in the daily chart. The price still maintains the upward slope but struggled near the 20 SMA, suggests neutral strength in short term. Meanwhile, 20 SMA continued accelerating north and developing above longer ones, indicating bulls not exhausted in the long term. On upside, overcome 147.40 may encourage bulls to challenge 148.40, break above that level will open the gate to 149.70.
- Technical indicators suggest the bullish strength. RSI stabilized around 51, while the Momentum indicator continued developing above the midline, suggests upward potentials. On downside, the immediate support is 145.40, break below this level will open the gate to 144.00 area.
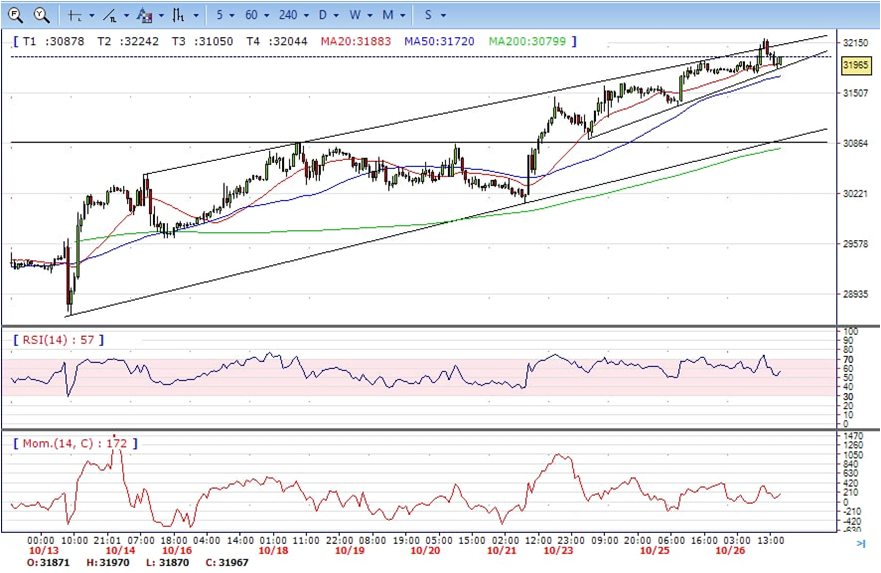
- DJI continued the advance, jumped from the intraday low 317800 area to 32210 daily high. It trimmed some gains and ended Wednesday at around 31960, up for the day and bullish in the hourly chart. It stabilized above all main SMAs, suggests bullish strength. Meanwhile, 20 SMA continued accelerating north and developing above longer one, suggests bulls not exhausted yet. On upside, overcome 32200 may encourage bulls to challenge 32700, break above this level will open the gate to 33000.
- Technical indicators suggest the bullish strength. RSI stabilized around 56, while the Momentum indicator stabilized above the midline, suggests upward potentials. On downside, the immediate support is 31750, break below this level will open the gate for more decline to 31350 area.
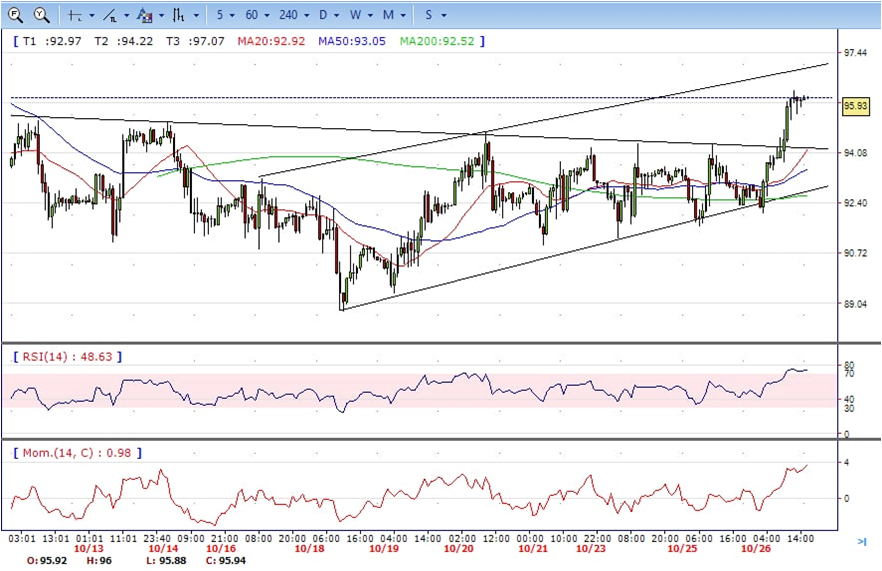
- Brent continued the advance , jumped from intraday low 92.06 to intraday high 96.19, it retreated modestly and ended Wednesday at around 95.80, up for the day and bullish in the hourly chart. The price stabilized above 20 and 50 SMA, suggests bullish strength in short term. Meanwhile, the 20 SMA continued accelerating north and developing above longer ones, indicating bulls not exhausted yet. On upside, overcome 96.50 may encourage bulls to challenge 98.60, break above this level will open the gate to 100.00.
- Technical indicators suggest the bullish movement, hovering above the midline. RSI stabilized around 68, while the Momentum indicator stabilized in positive territory, suggests upward potentials. On downside, the immediate support is 94.50, break below this level will open the gate for more decline to 93.50 area.