

19/04/2023 Daily Reports
- EUR/USD snaps two days of consecutive losses and climbs, and seesaws around the 1.0950 figure, spurred by falling US Treasury bond yields and broad American Dollar weakness. Hence, the EUR/USD is trading at 1.0973 after hitting a low of 1.0920.
- Sentiment deteriorated as Wall Street registers losses. Federal Reserve officials led by the St. Louis Fed President James Bullard reinforced the need for further tightening. Nevertheless, Bullard commented that he does not see a recession and expects rates to go between 5.50% and 5.75%. Of late, Atlanta’s Fed President Raphael Bostic noted that he estimates another hike and then a pause. He added that inflation would take some time to ease to the Fed’s target, and he also does not foresee a recession.
- The EUR/USD pair is trading near the 1.0973, up for the day with bullish stance in daily chart. The pair stabilized above 20 and 50 SMA, indicates bullish strength. Meanwhile, the 20 SMA continued accelerating north and heading towards 50 and 200 SMA, suggests bulls not exhausted yet. On upside, the immediate resistance is 1.1000, break above this level will extend the advance to 1.1070.
- Technical readings in the daily chart support the bullish stance. The RSI indicator stabilizes around 58. The Momentum indicator holds above the midline, indicating bullish potentials. On downside, the immediate support is 1.0900 and below this level will open the gate to 1.0830.

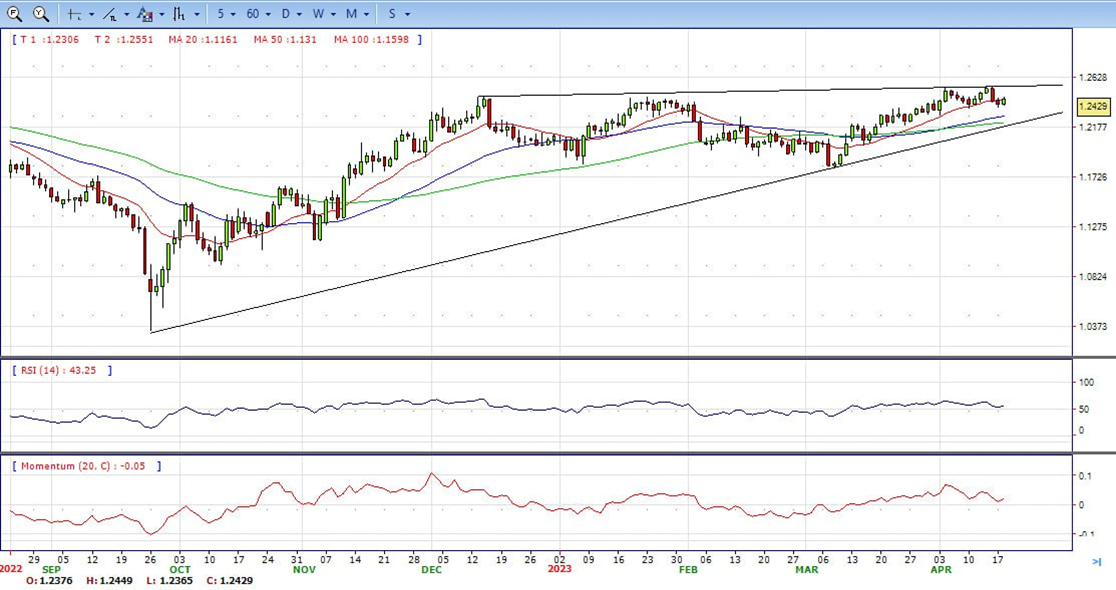
- GBP/USD was last trading at 1.2429, up 0.41% on the day, and has travelled from a low of 1.2366 to a high of 1.2449 so far. The market has been dominated by a correction in the US Dollar that has enabled GBP/USD to move up despite an unexpected rise in the unemployment rate in the three months to February.
- UK data gave the markets a mixed labor report with the Unemployment for the three months ending February that was expected to remain steady at 3.7% instead rose a tick to 3.8%. However, average hourly earnings came in at 5.9% YoY vs. the 5.1% expected and a revised 5.9% (was 5.7%) previously. Excluding bonuses, earnings grew even faster at 6.6% YoY. With the pay growth staying higher than forecast, this could prompt the Bank of England to hike its interest rate again in May which is supporting the price of the Pound Sterling.
- The GBP/USD offers bullish stance in daily chart. Cable stabilizes above 20 and 50 SMA, indicating bullish strength in short term. Meanwhile, the 20 SMA continued accelerating north and developing far above longer ones, suggests bulls not exhausted yet. On upside, the immediate resistance is 1.2450 with a break above it exposing to 1.2550.
- Technical readings in the daily chart support the bullish stances. RSI indicator stabilizes around 56, while the Momentum indicator stabilizes above the midline, suggesting upward potentials. On downside, the immediate support is 1.2340, unable to defend this level will resume the decline to 1.2270.


- Gold price regains some positive traction on Tuesday and moves away from a one-and-half-week low, around the $1,981 region touched the previous day. The XAU/USD sticks to its modest intraday gains, above the $2,000, though the intraday uptick lacks bullish conviction.
- The US Dollar Index is falling by 0.30%, back under 102.00 while US Treasury yields are little changed. Economic data from the US came in mixed. Housing Starts declined to 1.42 million in March, above the 1.4 million markets consensus, but Building Permits fell to 1.41 million against the consensus of 1.5 million.
- Gold price stabilized around 2005, up for the day and bullish in the daily chart. The gold price still stabilizes above all main SMAs, suggesting bullish strength in short term. Meanwhile, the 20 continued accelerating north and continued developing far above 50 and 200 SMA, indicates bulls not exhausted yet. On upside, the immediate resistance is 2015, break above this level will open the gate for more advance to 2032 area.
- From a technical perspective, the RSI indicator holds above the mid-line and stabilizes around 57, on a bullish strength. The Momentum indicator hold in the positive territory, suggests upward potentials. On downside, the immediate support is 1981, below this area may resume the decline to 1950.


- The USD/JPY pair retreats from a nearly five-week high, around the 134.80 region touched earlier this Tuesday and extends its steady intraday descent through the mid-European session. Spot prices slide just above the 134.00 mark in the last hour, eroding a major part of the previous day’s gains and snapping a two-day winning streak.
- The US Dollar comes under some renewed selling pressure and stalls a two-day-old recovery trend from a one-year low set last week, which, in turn, is seen as a key factor dragging the USD/JPY pair lower. Several counterparts are outperforming the buck: the better-than-forecast growth data from China, along with a hawkish tone from the RBA meeting minutes, boost the Australian Dollar. Adding to this, stronger UK wage growth data supported the British Pound and turns out to be a key factor weighing on the Greenback.
- The USD/JPY pair stabilized around 134.05, down for the day and bullish in the daily chart. The price stabilizes above 20 and 50 SMA, suggests bullish strength in short term. However, 20 SMA started turning flat but continued developing below longer ones, indicating bears not exhausted. On upside, overcome 135.10 may encourage bulls to challenge 137.00, break above that level will open the gate to 138.00.
- Technical indicators suggest the bullish strength. RSI stabilizes around 56, while the Momentum indicator stabilizes above the midline, suggests upward potentials. On downside, the immediate support is 133.70, break below this level will open the gate to 132.80 area.

- DJI surged to high 34280 level but failed to hold on the top and trimmed all gains. It tumbled to low 33930 and ended the Tuesday around 33130, unchanged for the day and indicates neutral sign in the hourly chart. Right now market is standing near 20 and 50 SMA, suggests neutral strength. Meanwhile, 20 SMA started turning flat but continued developing far above 200 SMA, suggests bulls not exhausted yet. On upside, overcome 34260 may encourage bulls to challenge 34410, break above that level will open the gate to 34750.
- Technical indicators suggest the directionless movement. RSI stabilizes around 50, while the Momentum indicator stabilizes around the midline, suggests neutral potentials. On downside, the immediately support is 33870, break below this level will open the gate for more decline to 33730 area.

- Brent under the sell pressure on the first half of the day and tumbled to intraday low 83.82. It bounced from here and climbed to intraday high 85.41. It ended Tuesday around 84.64, unchanged for the day and indicates bearish sign in the hourly chart. Meanwhile, the 20 SMA continued accelerating south and developing far below longer ones, indicates bears not exhausted yet. On upside, overcome 85.50 may encourage bulls to challenge 86.60, break above that level will open the gate to 87.50.
- Technical indicators also suggest bearish movement, hovering below the midline. RSI stabilizes at 44, while the Momentum indicator stabilizes in negative territory, suggests downward potentials. On downside, the immediately support is 83.50, break below this level will open the gate for more decline to 80.00 area.


