

14/04/2023 Daily Reports
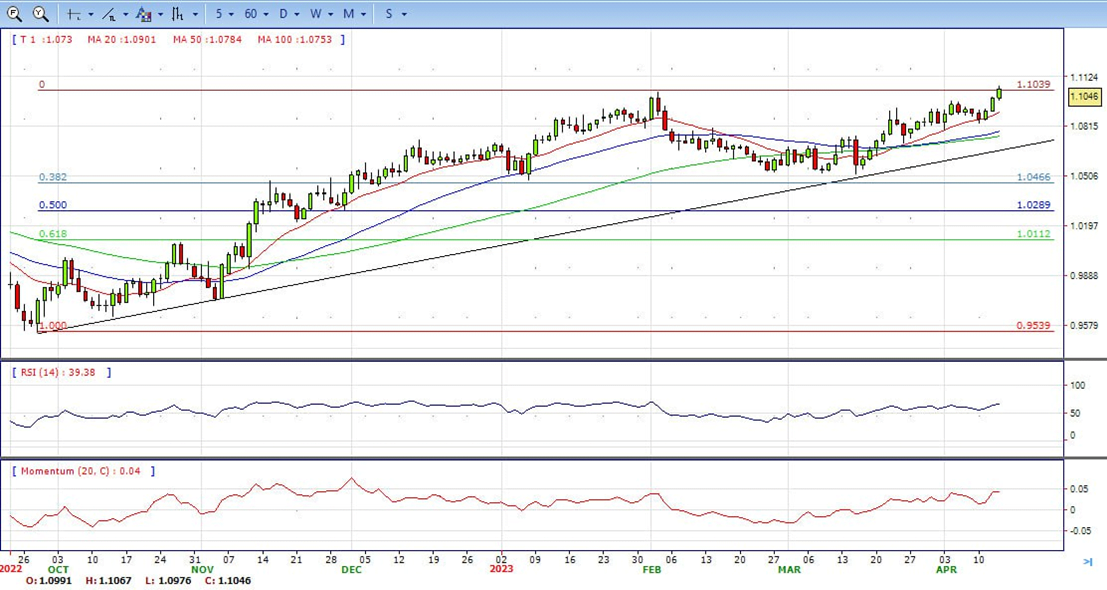
- EUR/USD keeps the bid stance well and sound for the third session in a row on Thursday and trades in levels last seen around a year ago on the back of the unabated sell-off in the dollar. The upside momentum in the single currency and around the risk complex in general lifts EUR/USD to new highs near 1.1070 on Thursday.
- Indeed, the greenback saw its decline gather extra impulse after US Producer Prices unexpectedly contracted 0.5% MoM in March, while weekly Initial Claims kept the recent uptrend in place after rising more than estimated by 239K in the week to April 8. Extra weakness in the dollar also comes in response to declining US yields in the short end and the belly of the curve, while expectations of a 25 bps rate hike by the Fed in May has been somewhat trimmed in the wake of US results.
- The EUR/USD pair is trading near the 1.1045, up for the day with bullish stance in daily chart. The pair stabilized above 20 and 50 SMA, indicates bullish strength. Meanwhile, the 20 SMA continued accelerating north and heading towards 50 and 200 SMA, suggests bulls not exhausted yet. On upside, the immediate resistance is 1.1070, break above this level will extend the advance to 1.1180.
- Technical readings in the daily chart support the bullish stance. The RSI indicator stabilizes around 65. The Momentum indicator holds above the midline, indicating bullish potentials. On downside, the immediate support is 1.0970 and below this level will open the gate to 1.0880.
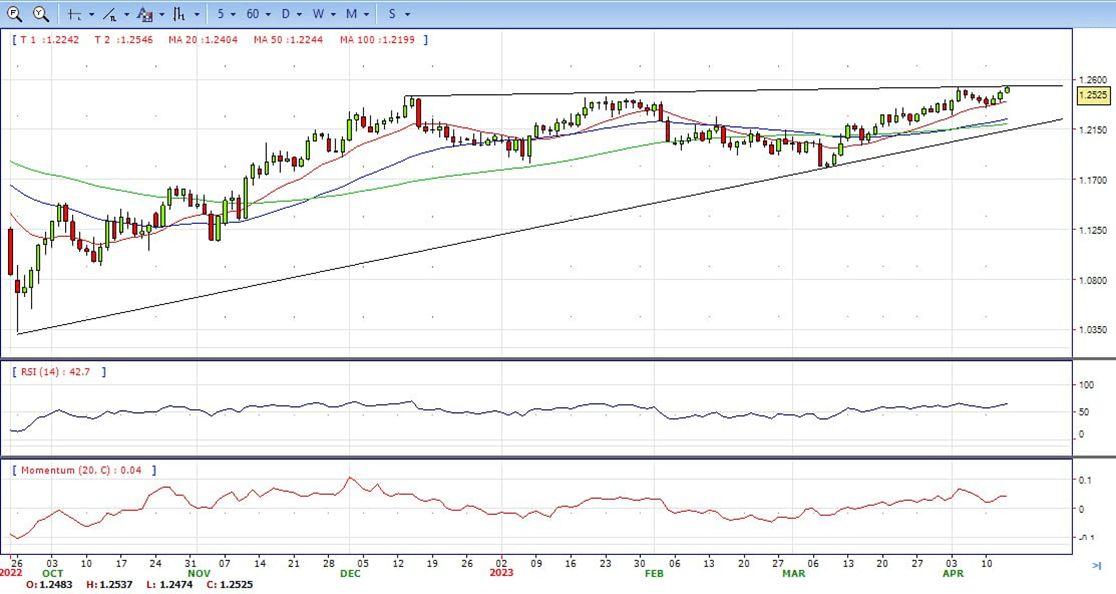
- GBP/USD is a touch higher on Thursday as the US Dollar slides deeper into what might be regarded as a meanwhile critical supporting area on the DXY´s daily chart. The price has travelled between a low of 1.2477 and a high of 1.2537 on the day so far and at the time of writing, the price is perched near the highs of the day at 1.2530, up 0.37%.
- The advance comes after the CPI inflation data on Wednesday came in at 5% year-on-year in March, down from 6% in February. The Greenback has been offered despite hotter Core inflation, which strips out volatile food and energy prices. The Core picked up to 5.6%, from 5.5% the previous month. Nevertheless, the data on Thursday confirmed the easing inflationary pressures with the PPI for final demand dropping 0.5% last month. In the 12 months through March, the PPI increased 2.7% which was the smallest year-on-year rise since January 2021 and followed a 4.9% advance in February.
- The GBP/USD offers bullish stance in daily chart. Cable stabilizes above 20 and 50 SMA, indicating bullish strength in short term. Meanwhile, the 20 SMA continued accelerating north and developing far above longer ones, suggests bulls not exhausted yet. On upside, the immediate resistance is 1.2540 with a break above it exposing to 1.2660.
- Technical readings in the daily chart support the bullish stances. RSI indicator stabilizes around 65, while the Momentum indicator stabilizes above the midline, suggesting upward potentials. On downside, the immediate support is 1.2400, unable to defend this level will resume the decline to 1.2340.


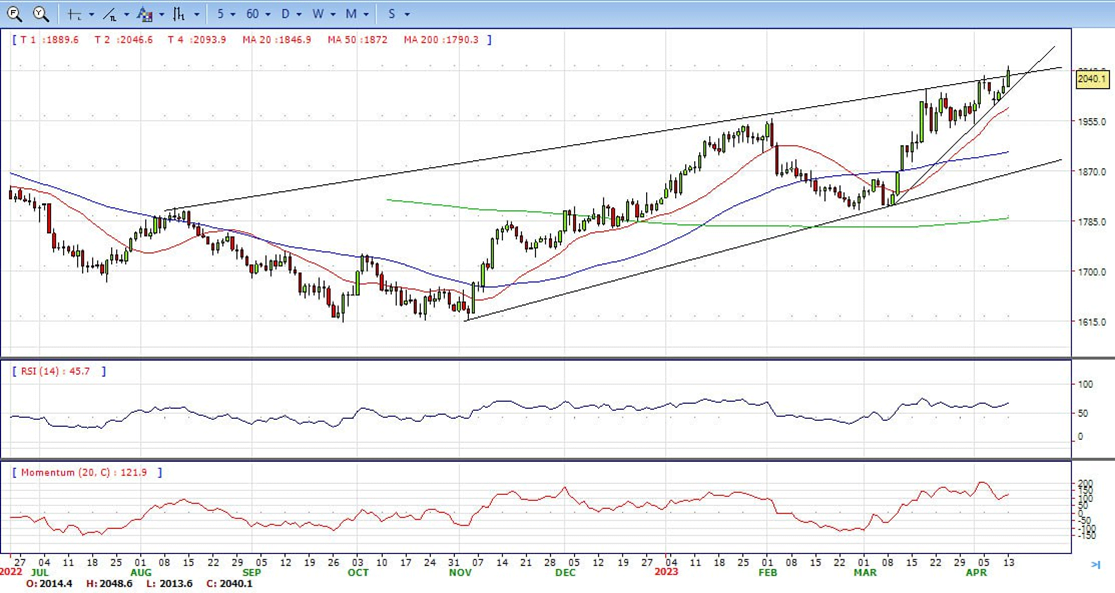
- Gold price advances though it remains off the highs of the year, reached earlier at around $2,048.79 after US data continued to show the economy is decelerating. Therefore, the USD weakened as US Treasury bond yields continued their downward trajectory, while Gold rallied on safe-haven flows. The XAU/USD is trading at $2,040 after reaching a low of $2,014.
- The US Bureau of Labor Statistics revealed that the March PPI plunged 0.5% MoM, below estimates of 0%. The so-called core PPI, which excludes volatile items, dropped 0.1% MoM, beneath the 0.3% foresaw by the consensus. When compared year-over-year, the PPI was 2.7%, lower than the 3% of the street’s projections, while the core PPI was unchanged at 3.4%. That weighed on the USD, which is seen losing 0.61%, per the US Dollar Index, at 101.913.
- Gold price stabilized around 2040, up for the day and bullish in the daily chart. The gold price still stabilizes above all main SMAs, suggesting bullish strength in short term. Meanwhile, the 20 continued accelerating north and continued developing far above 50 and 200 SMA, indicates bulls not exhausted yet. On upside, the immediate resistance is 2049, break above this level will open the gate for more advance to 2071 area.
- From a technical perspective, the RSI indicator holds above the mid-line and stabilizes around 67, on a bullish strength. The Momentum indicator hold in the positive territory, suggests upward potentials. On downside, the immediate support is 2032, below this area may resume the decline to 2014.


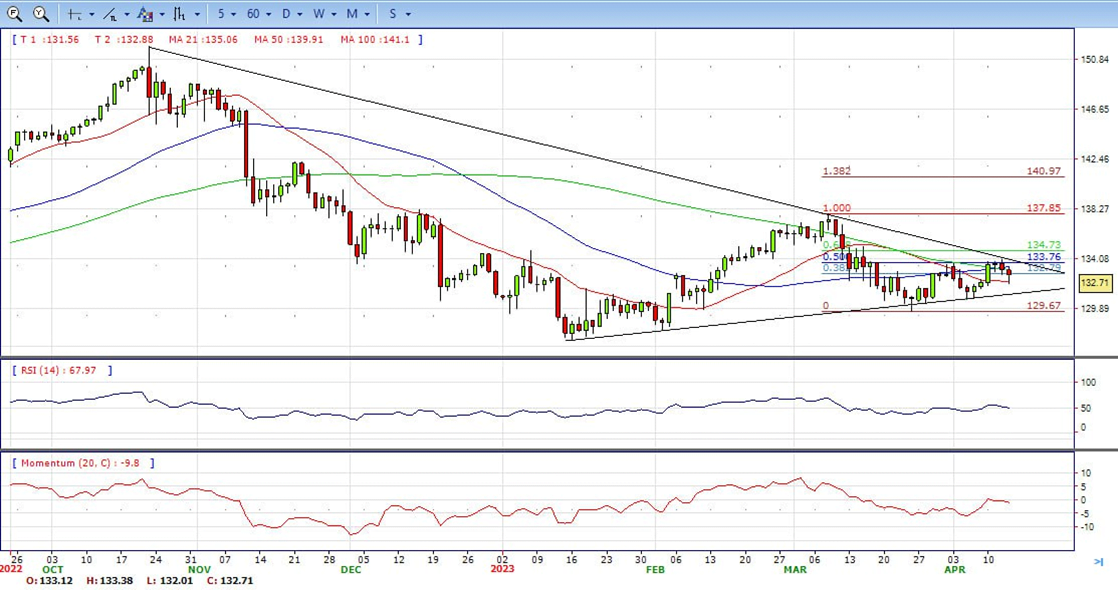
- The USD/JPY pair comes under heavy selling pressure during the early North American session and drops to a three-day low, around the 132.00 round-figure mark in the last hour. It ended the day around 132.70, down 0.29% on the daily basis.
- The US Dollar weakens across the board in reaction to the US PPI and turns out to be a key factor dragging the USD/JPY pair lower for the second successive day. Against the backdrop of the softer US CPI report released on Wednesday, the US PPI print suggests that disinflation is progressing smoothly and may even accelerate. This, in turn, reaffirms expectations that the Fed will be done with its monetary tightening after hiking one last time next month and weighs on the buck.
- The USD/JPY pair stabilized around 132.70, down for the day and neutral to bearish in the daily chart. The price stabilizes between 20 and 50 SMA, suggests neutral strength in short term. However, 20 SMA started turning flat but continued developing below longer ones, indicating bears not exhausted. On upside, overcome 134.00 may encourage bulls to challenge 135.10, break above that level will open the gate to 137.00.
- Technical indicators suggest the neutral strength. RSI stabilizes around 50, while the Momentum indicator stabilizes below the midline, suggests downward potentials. On downside, the immediate support is 132.00, break below this level will open the gate to 130.60 area.
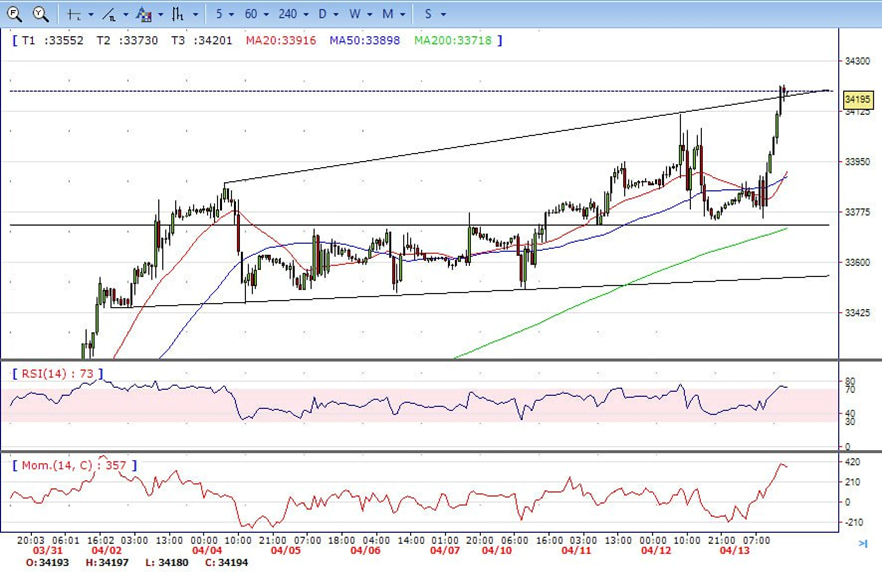
- DJI made a strong rally on Thursday after the release of US inflation data, jumped to intraday high 34216. It holds near the top and ended the day around 34190, up for the day and indicates bullish sign in the hourly chart. Right now market is standing above 20 and 50 SMA, suggests bullish strength. Meanwhile, 20 SMA started turning north and heading towards 50 SMA, suggests bulls not exhausted yet. On upside, overcome 34230 may encourage bulls to challenge 34410, break above that level will open the gate to 34750.
- Technical indicators suggest the bullish movement. RSI stabilizes around 73, while the Momentum indicator stabilizes above the midline, suggests upward potentials. On downside, the immediately support is 34000, break below this level will open the gate for more decline to 33730 area.
- Brent under the modest sell pressure post US inflation data, dropped to intraday low 86.06. It holds near the bottom and ended Thursday around 86.30, down for the day and indicates bearish sign in the hourly chart. Meanwhile, the 20 SMA started turning north and heading towards 50 SMA, indicates bears not exhausted yet. On upside, overcome 87.50 may encourage bulls to challenge 89.00, break above that level will open the gate to 90.60.
- Technical indicators also suggest bearish movement, hovering below the midline. RSI stabilizes at 40, while the Momentum indicator stabilizes below the midline, suggests downward potentials. On downside, the immediately support is 86.00, break below this level will open the gate for more decline to 83.50 area.


