13/01/2023 Daily Reports
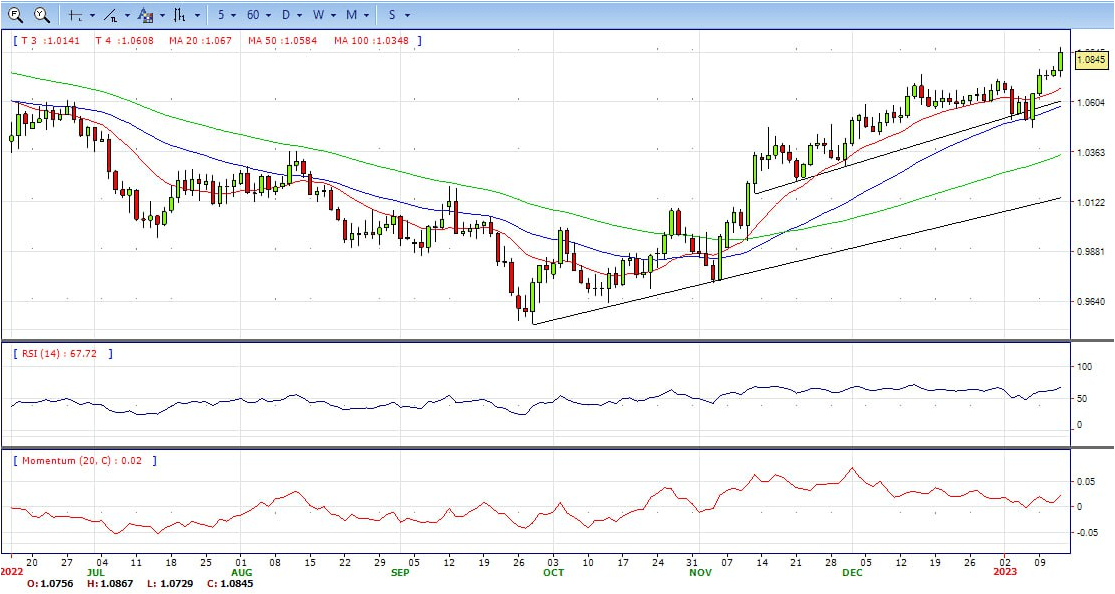
- EUR/USD resumed its advance and reached fresh multi-month highs, as market players made up their minds and increased bet for high-yielding assets. US Dollar under strong selling pressure as investors price in two Fed 25 bps hikes before pausing. EUR/USD sees its upside accelerated to levels last seen back in late April 2022 north of 1.0800 the figure on Thursday.
- The price advances for the fifth consecutive session to trade in levels past the 1.0800 barrier on the back of the increasing selling pressure in the dollar, particularly exacerbated following the release of US inflation figures during December. The euro continues to find support from hawkish messaging from European Central Bank officials, with four on Wednesday calling for additional rate increases.
- On the latter, the headline CPI rose at an annualized 6.5% in December and 5.7% YoY when it comes to the Core CPI, which excludes food and energy costs. Headline consumer prices therefore retreat for the sixth consecutive month so far and add to the rising perception of Fed’s pivot in the not-so-distant future.
- Technical readings in the daily chart support the bullish stance. The RSI indicator is above 50. The Momentum indicator is also above the mid-line, indicating bullish potentials. On downside, the immediate support is 1.0825 and below this level will open the gate to 1.0775.
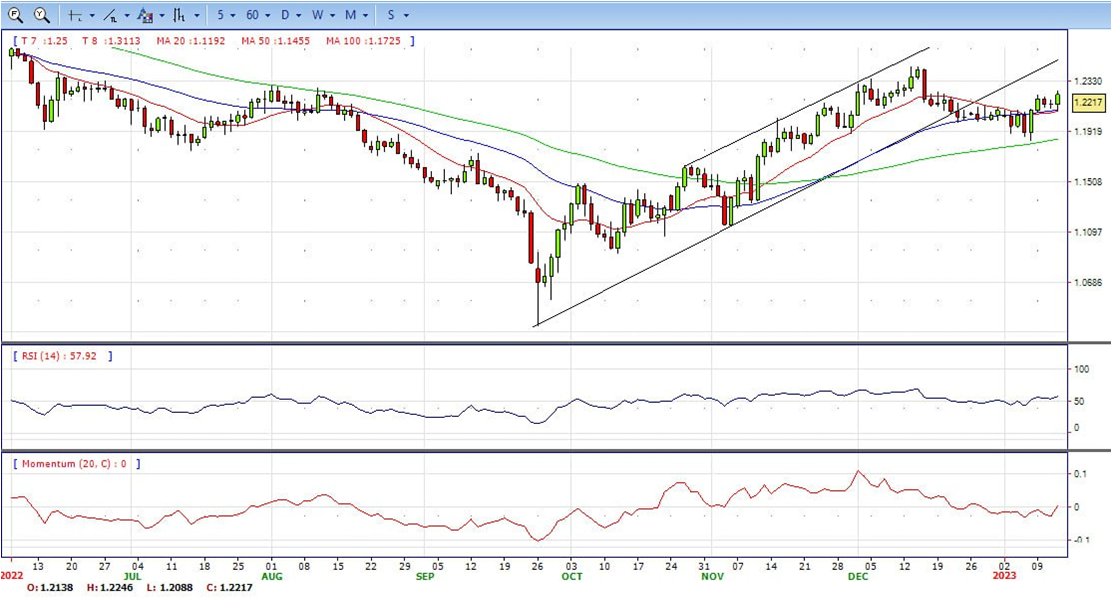
- The Pound Sterling (GBP) peaked after the release of US inflation data at 1.2246, the highest level in four weeks on Thursday. In a volatile session for FX, the US Dollar has reversed sharply during the last hour and turned positive across the board.
- Inflation data triggered a decline of the US Dollar that then recovered as equity prices in Wall Street dropped following the opening bell. The US Consumer Price Index fell in December 0.1% and the annual rate slowed to 6.5% from 7.1%, reaching the lowest level since October 2021.
- Following the inflation numbers, Patrick Harker, President of the Federal Reserve Bank of Philadelphia, said it was time for future Fed rate hikes to shift to 25 basis points increments. His comments added fuel to the Greenback’s decline as US yields sank.
- Equity prices in Wall Street turned negative after the opening. The deterioration in market sentiment was accompanied by a rebound in US yields. The US Dollar reversed its course and rose sharply, erasing all US CPI-losses.
- Technical indicators are showing bullish sign. RSI indicator is around 58, while the Momentum indicators slightly above 0, which suggesting a near term uptrend condition. On downside, the immediate support is 1.2185, unable to defend this level will resume the decline to 1.2135.


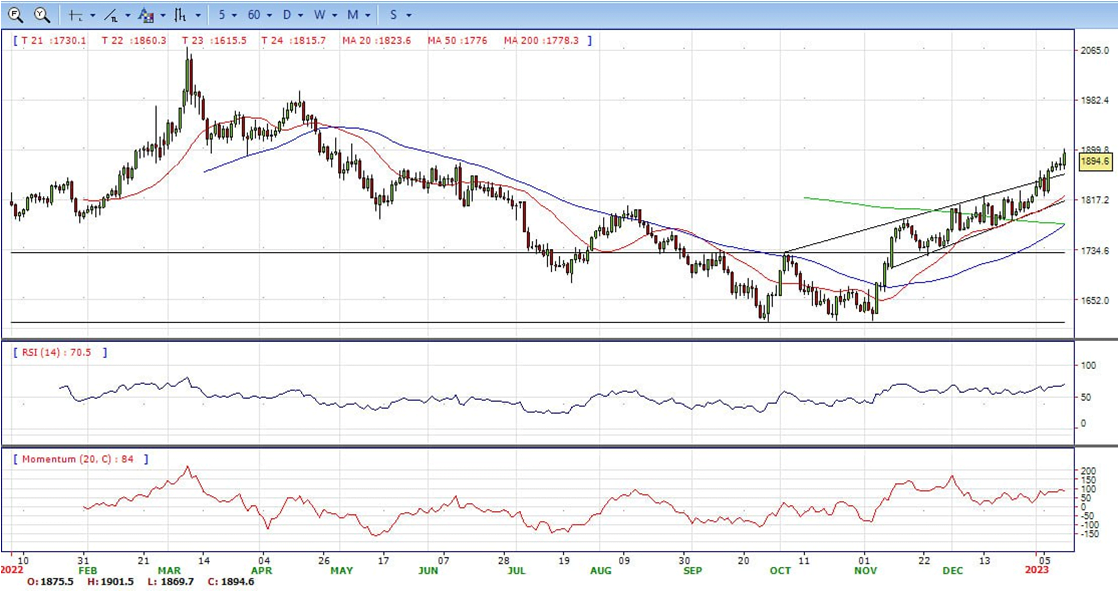
- Gold price reverses an early North American session dip to the $1,873 area and jumps to a fresh eight-month high following the release of the US consumer inflation figures. The XAU/USD is currently placed just below the $1,900 mark, up over 1.0% for the day, and seems poised to appreciate further.
- The US Dollar bounces off a seven-month low in reaction to mostly in-line US Consumer Price Index (CPI) data, which, in turn, acts as a headwind for the dollar-denominated Gold price. The US Bureau of Labor Statistics reported that the headline US CPI declined 0.1% in December as compared to estimates for a flat reading. The yearly rate, however, matched expectations and decelerated to 6.3% from 7.1% in November. Furthermore, core inflation, which excludes food and energy prices, edge up by 0.3% in December and fell to 5.7% on yearly basis from 6.0% in November.
- The mixed data, meanwhile, reaffirms market expectations for a less aggressive policy tightening by the Federal Reserve (Fed) and keeps the US Treasury bond yields depressed. In fact, the yield on the benchmark 10-year US Treasury note languishes near a multi-week low amid rising bets for smaller Fed rate hikes going further. This, in turn, caps the attempted USD recovery and provides a fresh lift to the non-yielding Gold price. That said, a generally positive tone around the equity markets might turn out to be the only factor capping gains for the safe-haven XAU/USD.
- From a technical perspective, the RSI indicator holds above the mid-line and stabilized around 70, still on a bullish strength. The Momentum indicator continued developing above the mid-line, suggests more upside potentials. On downside, the immediate support is 1880, below this area may resume the decline to 1867.


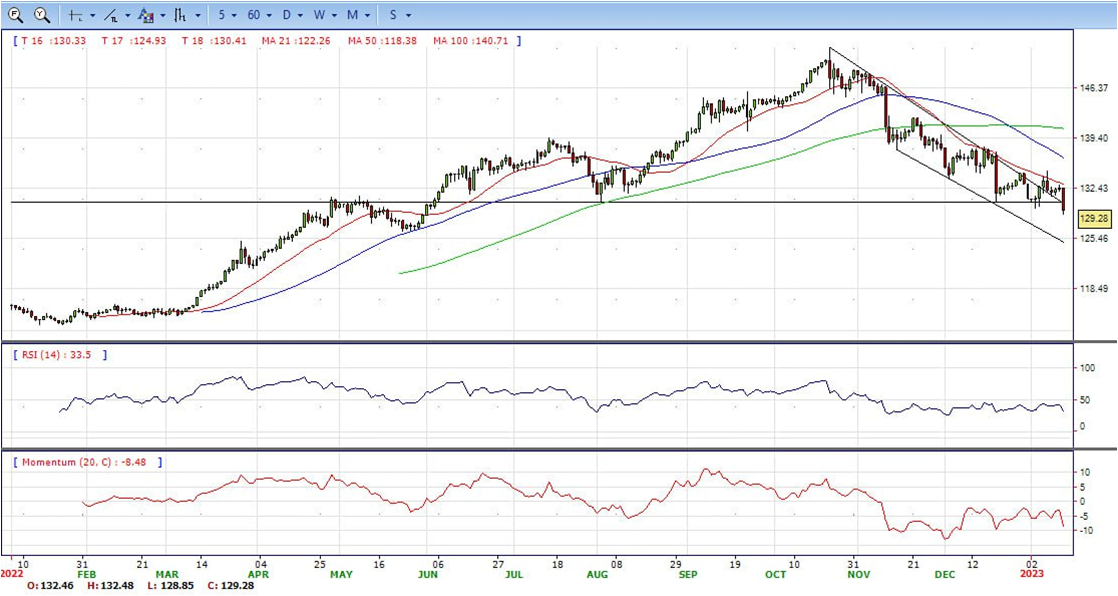
- The USD/JPY snaps two days of gains and tumbles more than 200 pips on Thursday, following the release of US inflation data, which had cooled down, while claims were lower than estimates. Hence, the USD/JPY hit a fresh half year low of 128.85.
- The US Department of Labor revealed that headline inflation, also known as the Consumer Price Index (CPI) for December, decelerated as expected to 6.5% YoY from 7.1% in November. Meanwhile, the month-over-month data showed inflation reading at -0.1%, lower than the 0% estimated. In the meantime, excluding volatile items inflation data, so-called core CPI came in at 5.7% YoY, below the 6% foreseen.
- At the same time, the Bureau of Labor Statistics (BLS) revealed that Initial Jobless Claims for the last week came in softer at 205K, less than the 215K petitions expected by analysts, reflecting continued labor market resilience and cushioning the Dollar’s fall.
- Aside from this, Philadelphia’s Fed President Patrick Harker said that 25 bps would be appropriate going forward after the release of the US CPI report. Harker commented that the time for super-size rate hikes had passed and he now expected a few more rate increases this year.
- Technical indicators still suggest the bearish strength, hovering below the mid-line. RSI fell below 50, while the Momentum indicator continued in negative territory, suggests bear potentials. On downside, the immediately support is 128.85, break below this level will open the gate to 126.55 area.
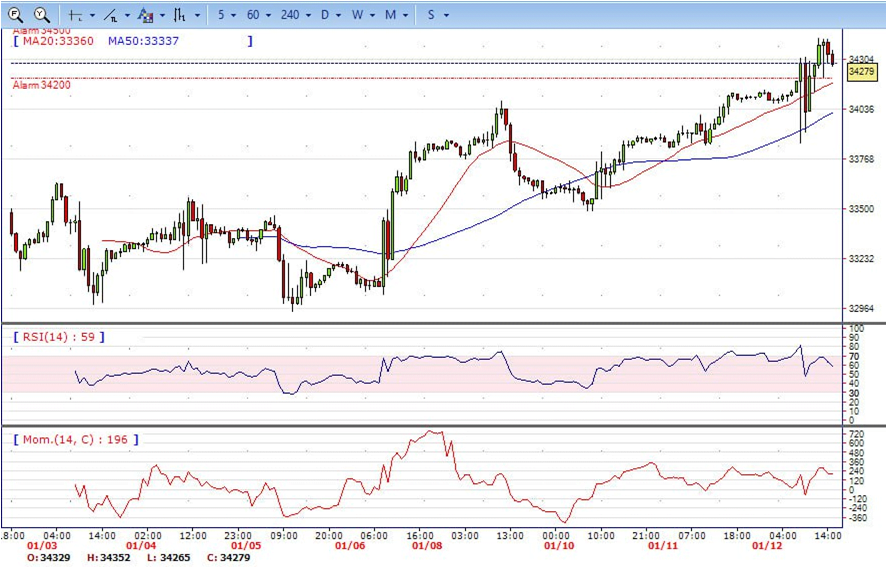
- DJI gained strength on Thursday, hit a fresh three-week high of 34421, the market was well supported by 33830 area early US session and then surged 600 points to 34400 area. market shows a strong bullish sign in the hourly chart. Right now market is standing above both 20 and 50 MAs, suggests a bullish sign. also we can see a cross between 20 and 50MA which brought more buying confidence. On upside, overcome 34421 may encourage bulls to challenge 34700, break above that level will open the gate to 34960.
- Technical indicators also suggest the bullish movement, developing above the mid-line. RSI stabilized around 60, while the Momentum indicator hovering well above the mid-line, suggests upside potentials. On downside, the immediately support is 34040, break below this level will open the gate for more decline to 33830 area.
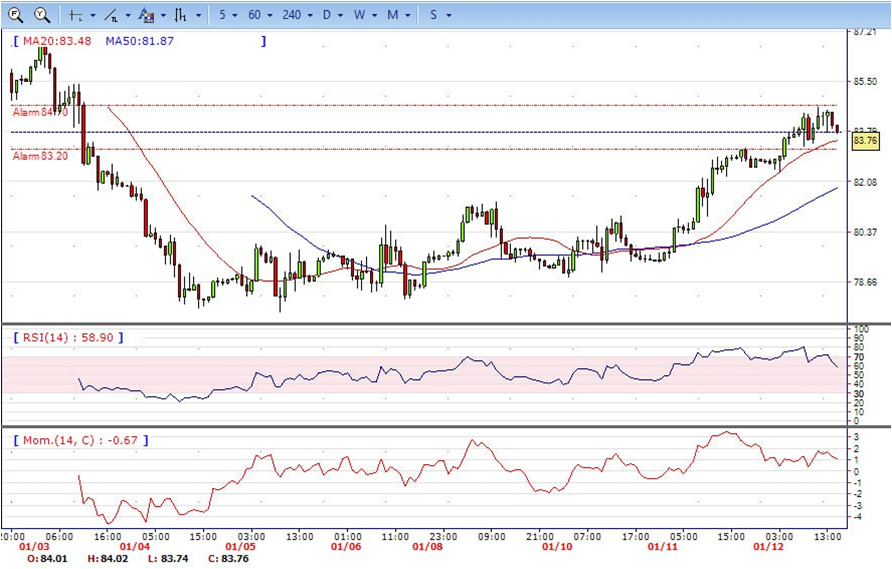
- The Brent continued its rally above 84 on Thursday as China reopened its economy for international travel, which has forced think tanks for an upward revision of oil demand projections., the prices hit as low as of 83.26 early US session and surged to a 6-day high of 84.62 US noon. The market is showing strong bullish sign in the hourly chart. The prices are standing on with a golden cross between two legs, indicating a bull potential. On upside, overcome 84.62 may encourage bulls to challenge 86.00, break above that level will open the gate to 87.00.
- Technical indicators also suggest bullish movement, hovering around the mid-line. RSI climbs to 60, while the Momentum index is well the mid-line, suggests a uptrend. On downside, the immediately support is 82.38, break below this level will open the gate for more decline to 81.20 area.